

Abstract
Most neurons fire in bursts, imposing episodic energy demands, but how these demands are coordinated with oxidative phosphorylation is still unknown. Here, using fluorescence imaging techniques on presynaptic termini of Drosophila motor neurons (MNs), we show that mitochondrial matrix pH (pHm), inner membrane potential (Δψm), and NAD(P)H levels ([NAD(P)H]m) increase within seconds of nerve stimulation. The elevations of pHm, Δψm, and [NAD(P)H]m indicate an increased capacity for ATP production. Elevations in pHm were blocked by manipulations that blocked mitochondrial Ca2+ uptake, including replacement of extracellular Ca2+ with Sr2+ and application of either tetraphenylphosphonium chloride or KB-R7943, indicating that it is Ca2+ that stimulates presynaptic mitochondrial energy metabolism. To place this phenomenon within the context of endogenous neuronal activity, the firing rates of a number of individually identified MNs were determined during fictive locomotion. Surprisingly, although endogenous firing rates are significantly different, there was little difference in presynaptic cytosolic Ca2+ levels ([Ca2+]c) between MNs when each fires at its endogenous rate. The average [Ca2+]c level (329 ± 11 nm) was slightly above the average Ca2+ affinity of the mitochondria (281 ± 13 nm). In summary, we show that when MNs fire at endogenous rates, [Ca2+]c is driven into a range where mitochondria rapidly acquire Ca2+. As we also show that Ca2+ stimulates presynaptic mitochondrial energy metabolism, we conclude that [Ca2+]c levels play an integral role in coordinating mitochondrial energy metabolism with presynaptic activity in Drosophila MNs.
Introduction
While neural activity never ceases, the activity of individual neurons can be highly variable (Kumar et al., 2010). Neurons, therefore, have variable ATP demands, and the variability must be accommodated as low levels of ATP would threaten the fidelity of neurotransmission. The excitability of neuronal membranes relies on Na+/K+ gradients maintained by Na,K-ATPases, and excitability can also be modulated by ATP-sensitive K+-channels (Haller et al., 2001). Furthermore, the release of neurotransmitter itself is sustained by ATP, which is used to reload and recycle synaptic vesicles and to clear Ca2+ from presynaptic termini (Attwell and Laughlin, 2001). As most nerve termini are characterized by a relatively small cytosolic volume, it is unlikely that the ATP bound by cytosolic ATP binding proteins provides sufficient reserve for any appreciable period of time in the absence of active ATP regeneration from ADP or AMP. It follows that in nerve termini capable of sustaining high rates of neurotransmitter release, the ATP production machinery must be highly responsive to nerve activity. Mitochondria accumulate within motor neuron (MN) termini (Yoshikami and Okun, 1984), and so it is likely that most of the ATP is supplied by oxidative phosphorylation and that oxidative phosphorylation, in addition to glycolysis, is called upon to accommodate variable demands in ATP. Indeed, MN termini without functional mitochondria fail to maintain Ca2+ homeostasis or sustain neurotransmitter release during prolonged activity (David and Barrett, 2003; Guo et al., 2005; Verstreken et al., 2005; Chouhan et al., 2010).
Classic studies on isolated mitochondria demonstrated that an increase in the ADP:ATP ratio stimulated oxidative phosphorylation (Chance and Williams, 1955). Within a cellular environment, this ratio has been proposed to integrate ATP supply with demand (Erecińska and Wilson, 1982). Over the last two decades, Ca2+ has been gathering recognition for its ability to stimulate oxidative phosphorylation via Ca2+-sensitive intramitochondrial dehydrogenases (Denton, 2009), F1F0-ATPases (Territo et al., 2000), and perhaps the adenine nucleotide transporter (Moreno-Sánchez, 1985). Ca2+ has been described as a metabolic integrator in hepatocytes and cardiomyocytes (Robb-Gaspers et al., 1998; Balaban, 2002). In cardiomyocytes, mitochondria accumulate Ca2+ in proportion to work done by the muscle, taking up Ca2+ with each cytosolic Ca2+ transient that drives excitation–contraction coupling. This Ca2+ then stimulates oxidative phosphorylation, thus coordinating ATP production with demand (Cortassa et al., 2003). It has also been suggested that Ca2+ coordinates mitochondrial metabolism with energy demands in neurons (Kann and Kovacs, 2007). For example, the stimulatory influence of Ca2+ on mitochondrial metabolism has been described in dissociated mouse neurons (Duchen, 1992), the cerebellar cortex in vivo (Reinert et al., 2004), and the neurohypophysis (Kosterin et al., 2005). However, the stimulatory influence of Ca2+ has not been detected at individually identified nerve termini where its relevance might be tested within the context of endogenous activity.
Here, we used fluorescence imaging techniques on Drosophila larval MN termini in situ and collected evidence of a Ca2+-dependent increase in mitochondrial energy metabolism that was evoked by nerve activity. Since presynaptic [Ca2+]c varies in proportion to firing rate and native firing patterns raise [Ca2+]c into a range where mitochondria acquire Ca2+, we propose that these MN termini harness the Ca2+ sensitivity of mitochondrial energy metabolism to coordinate presynaptic energy demands with oxidative phosphorylation. Interestingly, it appears that this coordination mechanism has been accommodated in different MN termini. The apparent mitochondrial affinities for Ca2+ are similar in different MN termini, yet despite a twofold difference in firing rates across MNs during fictive locomotion, presynaptic cytosolic Ca2+ levels are limited to a narrow range (∼330 nm), marginally in excess of the mitochondrial affinity for Ca2+ (∼280 nm).
Materials and Methods
Fly stocks.
Flies were raised on standard medium with dry yeast at 25°C. The w1118 strain was used as the wild-type control. We used enhancer-trap strains OK6-GAL4 (Aberle et al., 2002) and elav-GAL4 (Lin and Goodman, 1994) to drive expression of transgenes in motor neurons. Bloomington Drosophila Stock Center (Bloomington, IN) provided UAS-DsRed (stock no. 6282; cytosolic) and UAS-EGFP (stock no. 6874; cytosolic) transgenic flies. Transgenic UAS-GCaMP3 flies were a gift from Loren Looger (Janelia Farm Research Campus, Ashburn, VA). Flies carrying the UAS-interference RNA construct to knock down CG4589 (Letm1) (transformant no. 6662) was obtained from the Vienna Drosophila RNAi Center (Dietzl et al., 2007). Transgenic UAS-mito-RP [ratiometric pericam (RP) targeted to the mitochondrial matrix (mito)] flies were described previously (Chouhan et al., 2010).
Solutions and chemicals.
Unless indicated otherwise, chemicals were purchased from Sigma-Aldrich. Bongkrekic acid (catalog no. BML-CM113) was purchased from Enzo Life Sciences. KB-R7943 mesylate (catalog no. 1244) was purchased from Tocris Bioscience. Tetraphenylphosphonium chloride (TPP+; catalog no.88060) was purchased from Fluka Analytical (Sigma-Aldrich). Tetramethylrhodamine ethyl ester (TMRE; catalog no.T669), DMSO (with 20% pluronic acid; catalog no. P3000MP), synthetic Ca2+-reporters (rhod-FF AM, mag-Fluo-4 AM, fura-dextran, and rhod-dextran; catalog nos. R23983, M14206, F3029, and R34677, respectively), and AF647-dextran (catalog no. D22914) were obtained from Invitrogen. Hemolymph-like solution no.6 (HL6) containing 15 mm Mg2+ and buffered to pH 7.3 was used in all experiments (Macleod et al., 2002).
Generation of mtAlpHi transgenic flies.
The genetically encoded mitochondrial pH reporter, mtAlpHi, was expressed under the control of the GAL4/UAS system in MNs (Brand and Perrimon, 1993). cDNA for mtAlpHi was provided by Tullio Pozzan (University of Padua, Padua, Italy). MtAlpHi was targeted to the matrices of mitochondria using a tandem repeat of the first 36 aa of subunit VIII of human cytochrome oxidase (2mt8; Filippin et al., 2005). cDNA encoding this duplicate targeting sequence was fused in frame 5′ to the N terminus of the cDNA for mtAlpHi, cloned into a P-element vector (pUAST; Drosophila Genetic Resource Center, Bloomington, IN), and injected into w1118 Drosophila embryos by Rainbow Transgenics Flies. Strains homozygous for transgene inserts were obtained after determining the chromosome harboring the transgene through standard genetic crosses involving the use of balancer chromosomes and out-crossing all other chromosomes to the w1118 strain.
Wide-field Ca2+ imaging.
Imaging of fluorescent Ca2+ reporters, pH reporters, and TMRE was performed using wide-field microscopy on an Olympus BX51WI microscope fitted with a 100× water-immersion objective (1.0 numerical aperture). A Sutter Instrument 150 W DG4 fluorescence excitation system was used to select excitation wavelengths, while a Sutter Instrument Lambda 10-B filter wheel, placed before an Andor Technology EMCCD camera (DU860), was used to filter emitted fluorescence. Filters and dichroic mirrors were provided by Chroma Technology or Semrock. The imaging system was controlled through an Andor Technology PCU100 and a Dell PC running Andor IQ software (ver.1.8). Neutral density filters were used to reduce excitation intensity to 3.1, 6.3, or 12.5%.
To stimulate axons leading to the MN termini, the segmental nerve was cut close to the ventral ganglion and drawn into the lumen of a glass micropipette. Individual stimulus impulses, sufficient to elicit action potentials, were 300 μs in duration and 2.4 V in amplitude and delivered by a model DS2A Mk.II stimulator (Digitimer). Stimulus trains were triggered by a Master-8 stimulator (A.M.P.I.). Ca2+ imaging was performed in HL6 containing 7 mm l-glutamic acid to desensitize postsynaptic glutamate receptors and eliminate muscle contraction.
Fura-dextran, a high-affinity (KD = 594 nm in vitro) Ca2+ reporter conjugated to 10,000 MW dextran, was used to measure the concentration of free Ca2+ in the cytosol ([Ca2+]c). Fura was forward filled into termini by cutting the segmental nerve of a dissected larva and exposing the cut end to a mixture of HL6 or Schneider's insect medium with 5 mm fura in distilled water. After ∼40 min, fura was rinsed off and allowed to equilibrate in the axon for >60 min (Macleod et al., 2002). Fura fluorescence was examined using alternating 340/26 and 387/11 nm excitation filters, a 409 nm dichroic mirror, and a 510/84 nm emission filter. Fluorescence signals were converted to [Ca2+] using the Equation 5 of Grynkiewicz et al. (1985). Values of Rmax were obtained in situ through incubation of preparations in HL6 containing 10 mm Ca2+ and 100 μm ionomycin (catalog no. I9657; Sigma) for 30 min. Values of Rmin were obtained through incubation of preparations in Ca2+-free HL6 with 1 mm EGTA and 100 μm BAPTA-AM (1% DMSO) for 20 min (catalog no. B6769; Invitrogen) (Chouhan et al., 2010). The KD value used for fura-dextran was 865 nm (Tank et al., 1995).
Rhod-dextran, a low-affinity 10,000 MW dextran-conjugated Ca2+-reporter (KD = 3.0 μm), was forward filled as described in the above paragraph and examined using a 543/22 nm excitation filter, a 552 nm dichroic mirror and a 593/40 nm emission filter. As rhod-dextran is almost invisible at resting [Ca2+]c, AF647-dextran, a Ca2+-insensitive dextran-conjugated fluorophore (10,000 MW), was also forward filled. AF647-dextran was examined using a 628/40 nm exciter filter, a 660 nm dichroic mirror and a 692/40 nm emission filter.
Loading of synthetic mitochondrial Ca2+-reporters.
Rhod-FF and mag-Fluo-4 were loaded by bath application of the acetoxymethyl (AM) form of the Ca2+-reporters to a larval preparation with uncut segmental nerves. A 2 mm stock was made in 100% DMSO/20% pluronic acid. This was diluted to 5 μm (0.25% DMSO/0.05% pluronic acid) in HL6, applied to the preparation at room temperature, and incubated in the dark for 10 min. To clear the Ca2+ reporter from the cytosol, the preparation was then rinsed in Ca2+ reporter-free chilled HL6 and incubated for at least 30 min before imaging. HL6 was replaced every 30 min during this incubation, and nerves were cut and drawn into a stimulating pipette at least 20 min before imaging.
TMRE imaging.
Changes in mitochondrial membrane potential were measured as changes in mitochondrial TMRE fluorescence in the nonquench mode (Scaduto and Grotyohann, 1999). The preparation was exposed to 50 nm TMRE in chilled Schneider's (0.0005% DMSO/0.0001% pluronic acid), placed in the dark at room temperature for 7 min, and then rinsed in chilled Schneider's. The preparation was kept in the dark until required for imaging, and during this period (30–300 min) Schneider's was replaced every 30 min. TMRE was excited using a 543/22 nm bandpass filter via a 562 nm dichroic mirror, and fluorescence was viewed through a 593/40 nm emission filter. Because TMRE is washed from the preparation, it is unlikely that any increase in mitochondrial fluorescence is due to continued TMRE loading. TMRE will slowly leak from termini over time, resulting in a decrease in mitochondrial TMRE fluorescence, and an underestimate of Δψm if TMRE is used to monitor Δψm over extended periods. In this study, TMRE is only used to monitor Δψm over periods of tens of seconds. Changes in the potential of the plasma membrane will also influence the amount of TMRE available to mitochondria (Ward et al., 2007). However, the MN membrane will recover to a similar potential after activity, making a similar amount of TMRE available to mitochondria afterward. To the extent that these MNs might hyperpolarize after activity, the amount of TMRE available to mitochondria will decrease, leading to an underestimate of Δψm.
NAD(P)H imaging.
Two-photon microscopy was performed on a custom-built system based on an Olympus AX70 microscope frame that was coupled to diode pumped Millena X and Tsunami Ti:sapphire lasers. The laser system generated pulses with a frequency of 80 MHz and a duration of 70 fs. The laser scanning unit (6215H, Cambridge Technology) was controlled by a custom-written algorithm through a LabVIEW interface (version 7, National Instruments). A 730 nm excitation wavelength was selected by a group velocity dispersion prism. Average pixel dwell time was 2 μs. The emission signal was detected with a photomultiplier tube (H7732 MOD2, Hamamatsu Photonics). NAD(P)H fluorescence was filtered using a HQ430/25 filter (NC042339, Chroma Technology). Laser power output was tuned to 3 mW at the nosepiece of the objective (60× Olympus water immersion; 0.90 numerical aperture).
Image analysis.
All images were analyzed using Andor IQ software or ImageJ (http://rsbweb.nih.gov/ij/). Briefly, to obtain the background value for each image, average pixel intensity was calculated for regions of interest not containing a MN axon terminal or structures that change in fluorescence in response to nerve stimulation. To obtain the fluorescence value (F) for each image, the background value was subtracted from the average pixel intensity value calculated for regions of interest containing several boutons along an identified terminal. In most cases, values of F were scaled between 0 and 1, with 0 as the average value immediately before stimulation and 1 being the maximum stimulated response. Unless indicated, values of F were not corrected for bleaching. Where bleaching was corrected, a monoexponential fit was fitted to prestimulus values (≥12 s), and this fit was used to correct F for the entire image series.
Electrophysiology.
All experiments were performed on fillet-dissected wandering third instar larvae (w1118 strain) pinned on Sylgard (Dow Corning). Electrophysiological measurements were made within 30 min of dissection in HL6 containing Ca2+ but no l-glutamic acid. Recordings were made under the 20× water immersion objective of a BX51 Olympus microscope (200× magnification), allowing unequivocal identification of body wall muscles 7, 6, 13, 12, and 4 in abdominal segment 4 (Hoang and Chiba, 2001). Micropipettes were filled with a 1:1 mixture of 3 m KCl and 3 m K-acetate to give a final resistance of ∼50 MΩ. Each electrode was connected to an Axoclamp 900A amplifier through 0.1 or 1.0 gain headstages (Molecular Devices). Data were digitized (4/30, PowerLab) and acquired with Chart 5.5.6 software (AD Instruments). Data were analyzed using Chart software.
To quantify firing frequencies during fictive locomotion, segmental nerves were left intact and micropipette tips were placed into muscle fiber pairs as listed in Figure 3A. Due to strong muscle contractions during fictive locomotion, it was often difficult to maintain long-lasting paired micropipette recordings. Hence, records were accepted for analysis even if one or both muscle resting membrane potentials fell as low as −30 mV during rhythmic activity. Because we were quantifying a presynaptic phenomenon and excitatory junction potentials (EJPs) at high Ca2+ can be unambiguously resolved from the baseline, it is unlikely that accepting such data could compromise the conclusions drawn from our analysis. MNs contributing EJPs were identified as described previously (Chouhan et al., 2010).
Statistical analysis and data presentation.
Sigma Stat (version 3.5; Systat Software) was used for statistical analysis. For pairwise comparisons, Student's t tests were used. For multiple comparisons, ANOVA with post hoc Holm–Sidak or Tukey's tests were used as indicated. When data were found to be not normally distributed (Kolmogorov–Smirnov test), analogous nonparametric tests were used unless a two-way ANOVA was required, in which case data were transformed and retested. Associations were tested by calculating Pearson's Product Moment Correlation coefficient. Differences were considered to be statistically significant at α values of p < 0.05. Values are reported as mean ± SEM. Figures were generated in SigmaPlot (version10; Systat Software) and imported to Canvas (version X; ACD Systems) for panel assembly and labeling.
Results
Presynaptic mitochondrial energy metabolism is stimulated by nerve activity
Presynaptic mitochondria in Drosophila motor neurons acquire Ca2+ when trains of electrical impulses are applied to transected nerves (Fig. 1A). Mitochondrial Ca2+ acquisition can be detected using either synthetic (Fig. 1B–D) or genetically encoded Ca2+-reporters (Fig. 1E; blue trace), targeted to the matrices of presynaptic mitochondria (see also Guo et al., 2005; Chouhan et al., 2010). When axon firing is driven at high rates (80 Hz), the mitochondrial free Ca2+ level ([Ca2+]m) reaches close to its maximum within ∼0.5 s, regardless of the identity of the mitochondrial Ca2+ reporter or the duration of the impulse train (Fig. 1C–E). Having previously established that mitochondrial Ca2+ uptake does not limit cytosolic free Ca2+ levels in these termini (Chouhan et al., 2010), we hypothesized that mitochondrial Ca2+ uptake serves to stimulate oxidative phosphorylation or, more generally, mitochondrial energy metabolism. Through the application of synthetic and genetically encoded fluorescent reporters, along with NAD(P)H imaging, we examined the impact of nerve stimulation on three different measures of mitochondrial energy metabolism: mitochondrial matrix pH (pHm; Fig. 1E,F), inner mitochondrial membrane (IMM) potential (Δψm; Fig. 1G), and mitochondrial NAD(P)H levels ([NAD(P)H]m; Fig. 1H,I).

Presynaptic mitochondrial matrix pH (pHm), inner mitochondrial membrane potential (Δψm), and mitochondrial NAD(P)H levels ([NAD(P)H]m) increase in response to nerve stimulation. A, Schematic of a motor neuron terminal examined in situ. Electrical impulses were applied to the transected nerve to elicit action potentials. B, Image of presynaptic mitochondria (mito.) loaded with rhod-FF in type-Ib terminal boutons on muscle 13 containing the cytosolic (cyto.) Ca2+-reporter GCaMP3. C, A nerve stimulus train (bar: 80 Hz, 2 s) evoked changes in the concentration of cytosolic and mitochondrial Ca2+ ([Ca2+]c and [Ca2+]m reported by GCaMP3 and rhod-FF, respectively). D, Longer nerve stimulus trains (5 s) evoked changes in [Ca2+]c and [Ca2+]m (reported by rhod-dextran and mag-Fluo-4 respectively) with similar kinetics to those evoked by 2 s trains. E–G, Nerve stimulus trains also evoked changes in pHm (E and F) and Δψm (G). Fluorescent reporters are identified on each plot and changes in fluorescence are normalized to a range of 1 U (arbitrary units), except for mito-RP where peak 470 nm excitation fluorescence (RP/470: pHm) is normalized to 1 and the 420 nm excitation fluorescence (RP/420: −[Ca2+]m) is scaled in proportion, as the relative displacement of the traces is informative. A decrease in RP/420 represents an increase in [Ca2+]m; the inverted [Ca2+]m trace is thus labeled −[Ca2+]m. In each panel (C–G), the data come from a single terminal in separate larvae, and representative traces are shown with no bleaching correction and no data averaging. H, Nerve stimulation (5 s) produces changes in NAD(P)H autofluorescence at presynaptic mitochondria (open circles). Filled circles indicate autofluorescence in the absence of stimulation (stim.). Pooled data are presented as mean ± SEM; n, number of different termini. Asterisks indicate significant differences (p < 0.01) between stimulated and nonstimulated responses (two-way ANOVA, p < 0.05 overall, Tukey post hoc test). Fluorescence data not normalized as in C–G. I, Top, NAD(P)H autofluorescence image of a large presynaptic bouton embedded in the muscle surface. Look-up-table is on right. Middle, Interpretation of top image showing presynaptic mitochondria (m; arrowhead), approximate location of presynaptic bouton (p), muscle subsynaptic reticulum from which mitochondria are excluded (ssr), muscle mitochondria (mm), and the branch of a tracheole (t). Bottom, TMRE fluorescence image from the same field of view as in the top image, subsequent to NAD(P)H imaging. Scale bar, 5 μm. NAD(P)H and TMRE imaging were not conducted simultaneously due to the damaging excitation levels that would be required to maintain signal strength from both fluorophores. Where no transgene is indicated, larvae were w1118 wild type. Other genotypes were: GCaMP3: w-; OK6-GAL4/UAS-GCaMP3.0; +/+, mito-RP: w−; OK6-GAL4/UAS-mito-RP(#8); +/+, and, mtAlpHi: w−; OK6-GAL4/UAS-mtAlpHi(#2); +/+. All experiments were performed on MN13Ib termini in 2 mm Ca2+ physiological saline (HL6), with 7 mm l-glutamic acid.
The proton gradient across the IMM (ΔpH) is a significant component of the proton motive force (Δp) used by the F1F0-ATPase to generate ATP (Nicholls and Ferguson, 2002). Changes in pHm were monitored in large bouton (type-Ib) axon termini of MN innervating muscle 13 (MN13Ib). Two genetically encoded fluorescent reporters were used: mito-RP (Fig. 1E) and mtAlphi (Fig. 1F). Mito-RP reports changes in both pHm and [Ca2+]m with excitation wavelengths of 470 (or 490) and 420 nm, respectively (Nagai et al., 2001; Filippin et al., 2003; Jiang et al., 2009). MtAlphi only reports changes in pHm (Abad et al., 2004; Wiederkehr et al., 2009). In response to nerve stimulation, both reporters showed a transient spike in pHm followed by a long-lasting elevation in pHm (i.e., the matrix becomes alkaline) (Fig. 1E,F).
The electrical gradient across the IMM (Δψm) represents the Ca2+ sequestration driving force and the major component of Δp. Changes in Δψm were monitored as changes in the fluorescence of TMRE (Fig. 1G), a molecule that distributes across the IMM in Nernstian fashion (Scaduto and Grotyohann, 1999). When used in nonquench mode, as used here, an increase in TMRE fluorescence indicates an increase in Δψm. TMRE-loaded mitochondria responded to nerve stimulation with a rapid decrease in fluorescence (6.5 ± 1.2%), followed by a sustained elevation that peaked ∼15 s after the onset of stimulation (5.4 ± 2.0% above baseline; mean ± SEM; n = 6).
Another measure of mitochondrial metabolic function is NAD(P)H autofluorescence (Kann et al., 2003). NAD(P)H carries reducing equivalents to complex I of the electron transport chain (ETC), and an increase in NAD(P)H autofluorescence indicates an increase in tricarboxylic acid cycle activity (when ETC activity is not inhibited). Within seconds of the start of the nerve stimulus train, NAD(P)H autofluorescence from presynaptic mitochondria increased significantly (∼12% at 15 s; Fig. 1H,I), consistent with mitochondrial Ca2+ uptake stimulating tricarboxylic acid cycle activity. A comparison of the time courses of changes in [NAD(P)H]m, [Ca2+]m, pHm, and Δψm in Figure 1 shows that changes in [NAD(P)H]m follow changes in [Ca2+]m and parallel changes in pHm and Δψm.
An increase in pHm, Δψm, or [NAD(P)H]m alone may not indicate an increase in oxidative phosphorylation; however, a coordinated change in all three parameters is strong evidence of an increase in oxidative phosphorylation and an elevated capacity for mitochondrial ATP production.
Ca2+ stimulates presynaptic mitochondrial energy metabolism
Removal of Ca2+ from the saline abolishes nerve stimulus-evoked changes in [Ca2+]c, [Ca2+]m, pHm (Fig. 2A), and Δψm (Fig. 2B). To test the hypothesis that Ca2+ itself stimulates mitochondrial energy metabolism, we replaced Ca2+ with Sr2+, as mitochondria accumulate Sr2+ (Greenawalt and Carafoli, 1966) but Sr2+ is tenfold less effective than Ca2+ at stimulating dehydrogenases in isolated rat heart mitochondria (McCormack and Osbaldeston, 1990). CaCl2 was omitted from the saline, and SrCl2 was added to 4 mm along with EGTA to 2 mm (effective extracellular Sr2+ concentration ≥2 mm). Upon nerve stimulation, mito-RP fluorescence decreased under 420 nm excitation (Ca2+-sensitive wavelength), indicating that ratiometric pericam is sensitive to Sr2+ and that presynaptic mitochondria take up Sr2+ (Fig. 2C, first section, and D). However, the increase in pHm in ≥2 mm Sr2+ (4.2%±0.6%, n = 5) was significantly less than that seen in 2 mm Ca2+ (12.5%±1.9%, n = 4; mean ± SEM). Tetraphenylphosphonium (TPP+) and KB-R7943, which block mitochondrial Ca2+ uptake, were also used to test the dependence of matrix alkalinization on Ca2+ uptake (Fig. 2C, second and third section). TPP+ inhibits mitochondrial Ca2+ uptake and release (Wingrove and Gunter, 1986; Tang and Zucker, 1997), while KB-R7943 inhibits the mitochondrial Ca2+ uniporter (Santo-Domingo et al., 2007). These compounds completely blocked mitochondrial Ca2+ uptake. At the same time, they depressed basal pHm levels (became acidic) and blocked all nerve stimulation evoked elevations in pHm (Fig. 2D).

The increase in mitochondrial energy metabolism associated with nerve activity is Ca2+ dependent. A, Stimulation (bar: 80 Hz, 2 s) evoked changes in [Ca2+]c, [Ca2+]m, and pHm. All stimulus-evoked fluorescent transients are abolished when Ca2+ is omitted from HL6 and 2 mm EGTA is present. Responses recover when Ca2+ is readministered. B, Stimulation as in A produced changes in [Ca2+]c and Δψm, and changes in Δψm are Ca2+ dependent. Responses in A and B return when preparations are again superfused with 2 mm Ca2+ HL6. Fluorescent reporters are identified on each plot in A and B. In each panel (A and B) the data come from a single terminal. Changes in fluorescence were scaled as described in Figure 1 with no bleaching correction and no data averaging. C, Average mito-RP responses to an 80 Hz 2 s nerve stimulus during different treatments (brown and black traces); first section: 4 mm Sr2+, 2 mm EGTA, no added Ca2+; second section: 100 μm TPP+ and 2 mm Ca2+; third section: 100 μm KB-R7943 and 2 mm Ca2+; fourth section: 50 μm bongkrekic acid and 2 mm Ca2+. Control (cont.) data are also shown in each panel (2 mm Ca2+; red and blue traces). Data (frame) acquisition rate was 2 Hz per mito-RP excitation wavelength. Data are presented as mean ± SEM, and scaled to the mito-RP 420 nm excitation trace before stimulation; N ≥ 4 (larvae). TPP+, KB-R7943, and bongkrekic acid were applied for 10 min in ≤1% DMSO. D, A quantitative summary of the data in C, where Δ[Ca2+]m and ΔpHm represent the average change in [Ca2+]m and pHm (between time = −1 and 10 s) reported by mito-RP when using excitation wavelengths of 420 and 470 nm, respectively. Asterisks indicate significant differences from controls (p < 0.01) in one-way ANOVAs applied separately to [Ca2+]m data and pHm data (p < 0.05 overall, Holm-Sidak post hoc tests). Genotypes are as follows: A: mito-RP: w−; OK6-GAL4/UAS-mito-RP(#8); +/+; B: GCaMP3: w−; OK6-GAL4/UAS-GCaMP3.0; +/+; C and D: w−; OK6-GAL4/OK6-GAL4; UAS-mito-RP(#9)/+. All experiments were performed on MN13Ib termini in HL6 saline with 7 mm l-glutamic acid. Except where indicated otherwise, 2 mm Ca2+ was present.
The data above strengthen the hypothesis that Ca2+ is instrumental in stimulating mitochondrial energy metabolism. However, as it is commonly accepted that an increase in the ADP:ATP ratio can stimulate oxidative phosphorylation, the possibility remains that under the conditions of each manipulation above, the ATP consumption rate is depressed to a level where changes in the ADP:ATP ratio are insufficient to stimulate mitochondrial metabolism. We tested for a primary effect of the ADP:ATP ratio by applying bongkrekic acid to inhibit the adenine nucleotide transporter. Bongkrekic acid should reduce the availability of ADP to the F1F0-ATPase and thereby diminish the capacity of a rapid increase in the cytosolic ADP:ATP ratio to stimulate respiration (Henderson and Lardy, 1970; Klingenberg, 2008). Bongkrekic acid appeared to depress basal pHm levels but did not diminish nerve stimulus-evoked changes in pHm (Fig. 2C, fourth section, and D).Together, these data provide strong support for the hypothesis that mitochondrial Ca2+ uptake, rather than a change in the ADP:ATP ratio, plays a primary role in stimulating rapid increases in mitochondrial energy metabolism in these nerve termini.
Identified motor neurons have stereotypical firing rates in situ
Changes in the mitochondrial energy metabolism studied in the experiments above were evoked by impulse trains delivered at 80 Hz. To determine how this frequency fits within the range of frequencies that occur in situ, we placed intracellular micropipettes in adjacent body wall muscle fibers to record synaptic activity while the central pattern generator drove patterned activity in the MNs (Fig. 3A), an experimental condition referred to as fictive locomotion. The innervation of muscles 7, 6, 13, 12, and 4 is highly stereotypical (Hoang and Chiba, 2001), and MNs contributing EJPs were identified using a previously described method (Chouhan et al., 2010). EJPs arising from axons that form type Is boutons on many muscle fibers were identified and dismissed from further consideration based on their synchronicity and large amplitude in commonly innervated muscle fibers. The intervals between contiguous EJPs were used to calculate instantaneous firing frequencies for each MN that formed type Ib boutons. The average of these frequencies was calculated over a period of 2 s during the MN′s most intense activity (Fig. 3B,C). We refer to this value as the MN′s native firing frequency. Each MN displayed a characteristic native firing frequency that differed significantly from the firing frequency of other MNs (Fig. 3 B,C) (Fig. 3C; MN6/7Ib, 21.3 Hz; MN13Ib, 42.0 Hz; MN12Ib, 32.4 Hz; MN4Ib, 24.2 Hz). Clearly, these endogenous frequencies are below the 80 Hz stimulus frequency used to stimulate mitochondrial Ca2+ uptake and energy metabolism in Figures 1 and 2. Thus, the question arises, are the mitochondrial phenomena observed at 80 Hz also seen at lower frequencies?

Individually identified motor neurons have a characteristic firing rate in situ. A, Schematic of larval body wall muscles and dual intracellular recording micropipettes. B, Average (avg.) instantaneous firing frequencies for each MN, calculated as the reciprocal of the interval between EJPs averaged over a 2 s period of the MN′s most intense activity. The data represent paired recordings. MNs were identified according to the muscle they exclusively innervate. Asterisks indicate significant differences between MNs when the means are tested (p < 0.005, paired Student's t tests). Recordings were in 0.4 mm Ca2+ HL6. C, The average firing frequency for each MN calculated from pooled measurements with Ca2+ present at 0.4, 0.8 or 2.0 mm. Firing rates are not dependent on Ca2+ levels in the saline in the range between 0.4 and 2 mm (data not shown). n indicates the number of recordings. Larvae were w1118 wild type. Asterisks indicate significant differences between MNs (p < 0.05, Kruskall–Wallis one-way ANOVA on ranks with Dunn's correction).
Presynaptic mitochondria take up Ca2+ at stimulus frequencies close to the native firing frequency of their motor neuron
To determine whether mitochondria take up Ca2+ at firing frequencies close to endogenous rates, we measured changes in mito-RP fluorescence evoked by 2 s stimulus trains of different frequencies. The low-affinity Ca2+-reporter rhod-dextran shows that the concentration of cytosolic Ca2+ ([Ca2+]c) increases in proportion to stimulus frequency over a range of frequencies up to 80 Hz (Fig. 4A; Macleod et al., 2002; Chouhan et al., 2010; Hendel et al., 2008; He and Lnenicka, 2011). Changes in the level of mito-RP fluorescence were measured 10 s after the start of the stimulus train (Fig. 4A, far right sections). Average mito-RP responses [420 nm excitation ([Ca2+]m)] were normalized to a maximum response at 120 Hz stimulation (fluorescence responses did not increase beyond 120 Hz stimulation), and data were fit with four parameter logistic functions (Fig. 4B). These data were used to calculate an EC50 for each MN that represents the stimulus frequency producing a 50% maximal mito-RP response under 420 nm excitation (mito-RP50). A plot of mito-RP50 frequencies versus native firing frequencies showed a significant correlation (Fig. 4C), although the relationship diverges from a strict one-to-one mapping (dotted line). The mito-RP50 frequencies are significantly different between MN6/7Ib, MN12Ib, and MN13Ib, as shown. Because all points fall below the dotted line, this indicates that all MNs fire at a rate that will produce at least a 50% maximal mito-RP response within 2 s.
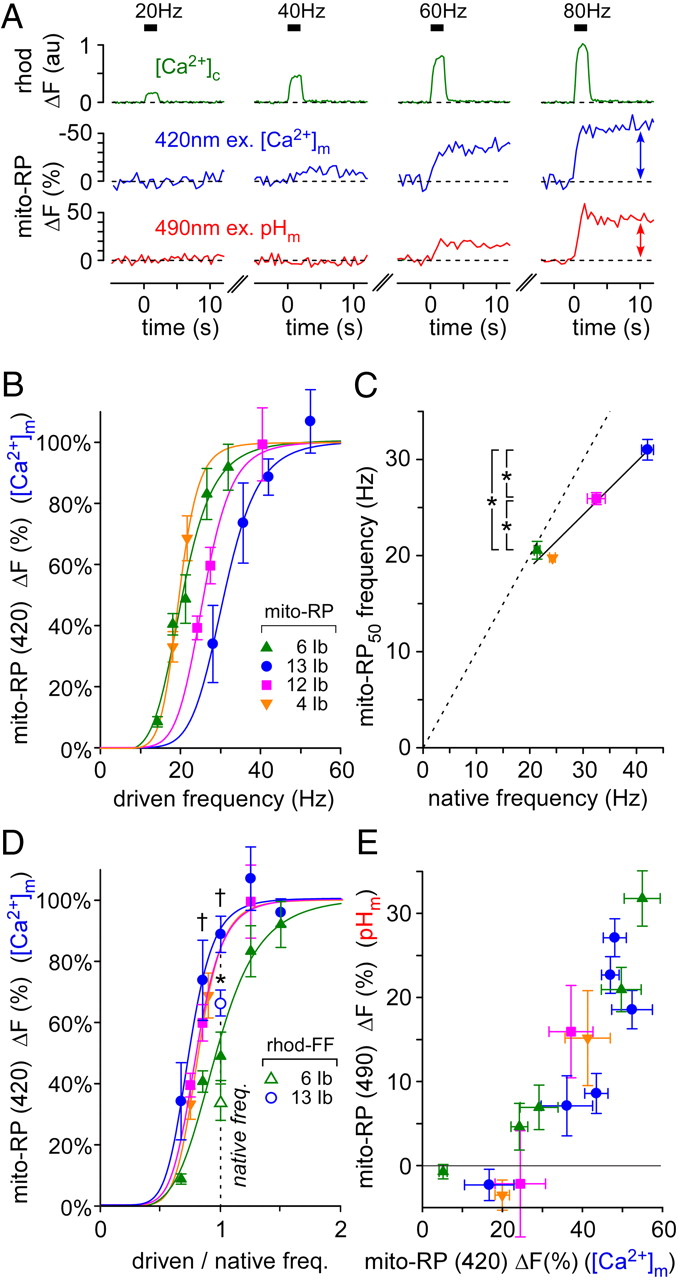
Presynaptic mitochondria take up Ca2+ close to the native firing frequency of their motor neuron. A, Changes in [Ca2+]c (rhod-dextran) in a MN13Ib terminal in response to individual nerve stimulus trains 2 s in duration (trains separated by 10 min). Changes in [Ca2+]m and pHm (mito-RP, 420 and 490 nm excitation, respectively) evoked by the same stimulus protocol. Rhod fluorescence and mito-RP fluorescence (420 and 490 nm excitation) were normalized to a resting level (prestimulus) value of 0. No data averaging or smoothing. B, Normalized average changes in mito-RP fluorescence (420 nm ex.) across MN termini for different nerve stimulus frequencies (driven frequency). An ANOVA was not applied as values on the abscissa were different between all MNs. C, Stimulus frequencies producing a 50% maximal mito-RP response (mito-RP50) in each MN were plotted against the native firing frequency of each MN. The values were correlated (p = 0.018, r = 0.982, Pearson's Product Moment), and mito-RP50 frequencies were significantly different (p < 0.001) between MN6/7Ib, MN12Ib, and MN13Ib, as indicated with asterisks (one-way ANOVA, p < 0.05 overall, Holm–Sidak post hoc tests). D, Normalized average changes in mito-RP fluorescence (420 nm excitation) plotted against the stimulus frequency relative to the MN′s native firing frequency (closed symbols). Significant differences (p < 0.01) were found between MN13Ib and MN6/7Ib, as indicated with daggers (two-way ANOVA, p < 0.05 overall, Tukey post hoc tests). The relative rhod-FF fluorescence responses were also plotted for MN6/7Ib and MNI3Ib presynaptic mitochondria (open symbols; native firing frequency/120 Hz). These values were significantly different (asterisk; p < 0.001, two-tailed Student's t test; MN13Ib: 67.1%; MN6/7Ib: 32.7%) E, Average changes in pHm plotted against average changes in [Ca2+]m in each MN (before normalization). The legend shown in B is used for B–E. Pooled data are presented as mean ± SEM; n ≥ 5. Larval genotypes: w−; OK6-GAL4/UAS-mito-RP(#8); UAS-DsRed/+, except for w1118 wild type used when loading rhod-FF. All experiments were in 2 mm Ca2+ HL6 saline with 7 mm l-glutamic acid.
To graphically represent mitochondrial Ca2+ uptake within a physiological context, the data in Figure 4B were replotted after dividing the frequency at which each MN was stimulated by its native firing frequency (Fig. 4D; closed symbols). The resulting curves demonstrate that presynaptic mitochondria rapidly accumulate Ca2+ once MN firing exceeds approximately half of its native firing frequency. As the curves of the faster firing MNs are higher in the transformed plot (Fig. 4D; MN13Ib versus MN6/7Ib), they may be more active at using the mechanism of Ca2+-stimulated oxidative phosphorylation to support their activity. To determine whether the relatively high Ca2+ affinity of mito-RP was somehow responsible for the trend observed in Figure 4D, mitochondria in the fastest (MN13Ib) and slowest (MN6/7Ib) firing MNs were loaded with the low-affinity Ca2+-indicator rhod-FF, and the MNs were stimulated at their native firing frequencies. The lower estimates derived from the rhod-FF data suggest that mito-RP saturates at higher stimulation frequencies in both MNs (Fig. 4D; open symbols). However, in agreement with the mito-RP data, the rhod-FF data show a significant difference between MNs, indicating that mitochondria in the fastest firing MN take up a greater relative load of Ca2+ than the slowest firing MN when MNs fire at their native frequencies.
pHm shows a similar dependence on [Ca2+]m in different MNs
To determine whether mitochondrial Ca2+ uptake has a similar influence on mitochondrial metabolism in different MNs, average mito-RP responses representing changes in pHm (490 nm excitation) were plotted against responses representing changes in [Ca2+]m (420 nm excitation) (Fig. 4E). Changes in [Ca2+]m did not give rise to any measureable change in pHm until [Ca2+]m changed significantly, i,e, until the 420 nm mito-RP response exceeded ∼20%. Beyond this threshold, pHm appears to be highly responsive to changes in [Ca2+]m in all MNs.
Native firing frequency [Ca2+]c values are similar in different motor neurons
Mitochondrial Ca2+ uptake varies across MNs for any given nerve stimulus frequency (Fig. 4B). One explanation for this may be that presynaptic [Ca2+]c achieves a different level in each MN. An alternative explanation would be that mitochondria in different MNs have different affinities for Ca2+. To determine [Ca2+]c during nerve activity and thereby investigate the first hypothesis, we loaded MN termini with the Ca2+ reporter fura-dextran and found that [Ca2+]c values at any given stimulus frequency were significantly different across MNs (Fig. 5A). The MN termini that achieved the highest [Ca2+]c levels contained mitochondria that were the most responsive to nerve stimulation, e.g., MN6/7Ib. Thus, the trend in [Ca2+]c levels (Fig. 5A) provides an explanation for the differences in mitochondrial uptake across MNs shown in Figure 4B.

Presynaptic Ca2+ levels ([Ca2+]c) are similar in different motor neurons when each is driven at its native firing frequency. A, Average [Ca2+]c in identified MN termini during 2 s nerve stimulus trains at the driven frequency shown. Asterisks indicate significant differences (p < 0.01) between MNs (two-way ANOVA, p < 0.05 overall, Tukey post hoc test). B, Average [Ca2+]c plotted against stimulus frequency relative to the MN′s native firing frequency. C, [Ca2+]c values for each MN at its native firing frequency, obtained by projecting the native firing frequency of each MN (Fig. 3C) onto the ordinate in A (closed symbols; left ordinate). Independent estimates of relative [Ca2+]c values were obtained by loading MN termini at a fixed ratio of rhod-dextran to AF647 dextran and stimulating each MN at its native firing frequency (open symbols; right ordinate). Linear regression analysis failed to find significant associations in either the fura or rhod-dextran datasets (r = 0.84, F = 4.7, p = 0.16, and r = 0.69, F = 1.9, p = 0.31, respectively). D, [Ca2+]c values for each MN at its mito-RP50 frequency [representing the apparent affinity of mitochondria for Ca2+ (Kapp)], obtained by projecting the mito-RP50 frequency of each MN (Fig. 4C) onto the ordinate in A. Pooled data are presented as mean ± SEM; n ≥ 6. Larvae were w1118 wild type. All experiments were performed in 2 mm Ca2+ HL6 saline with 7 mm l-glutamic acid.
The physiological implications of these data became evident when they were replotted after dividing the frequency at which each MN was stimulated by its native firing frequency (Fig. 5B). Then, for all MNs, [Ca2+]c values were similar across their relative firing frequency range. When native firing frequency [Ca2+]c was plotted for each MN (Fig. 5C), it was clear that MNs operated in a similar [Ca2+]c range during endogenous activity (filled symbols, 329 ± 11 nm). However, as [Ca2+]c values in this plot derive from native firing frequency values (Fig. 3C) extrapolated onto the ordinate in Figure 5A, they do not provide for a strong test for differences between [Ca2+]c values. This shortcoming was remedied by filling MNs with a mixture of rhod-dextran and AF647-dextran and stimulating each MN at its native firing frequency. Rhod-dextran has a larger dynamic range and a lower affinity than fura-dextran (3 μm vs 594 nm). Rhod-dextran was unable to resolve a significant difference in [Ca2+]c between MN termini at their native firing frequencies (open symbols; F = 0.62, one-way ANOVA). A trend indicating that [Ca2+]c was slightly higher in the faster firing neurons was observed in the [Ca2+]c estimates derived from rhod-dextran and from fura-dextran, but in neither case was the association significant. If [Ca2+]m has a second power dependence on [Ca2+]c (Nicholls and Ferguson, 2002), then a small but difficult to resolve trend in [Ca2+]c may be sufficient to explain the trend in [Ca2+]m. A comparison between Figure 4B and Figure 5A indicates that [Ca2+]m levels are indeed very sensitive to changes in [Ca2+]c near the native firing frequency.
Presynaptic mitochondria in different motor neurons show similar affinities for Ca2+ uptake
An explanation for the differences in mitochondrial Ca2+ uptake between MNs at any given stimulus frequency (Fig. 4B), can be found in the differences in [Ca2+]c values between MNs (Fig. 5A). However, it is more difficult to explain the differences in mitochondrial Ca2+ uptake between MNs at their native firing frequencies (Fig. 4D), as we were unable to resolve a difference in [Ca2+]c between MNs at their native firing frequencies (Fig. 5C). An explanation might be found if the apparent mitochondrial Ca2+ affinity (Kapp) is different in different MNs. To estimate Kapp for each MN, its mito-RP50 frequency (Fig. 4C) was projected from the abscissa to the ordinate of Figure 5A. Kapp values fell in a range between 253 and 307 nm (Fig. 5D; 281 ± 13 nm). There was no indication of higher Kapp values in faster firing MNs, in which case differences in Kapp values between MNs could not explain differences in mitochondrial uptake across MNs at their native firing frequencies. Therefore, we favor the explanation that the nonsignificant trend in [Ca2+]c observed in Figure 5C does in fact represent small differences between MNs.
Presynaptic mitochondria avidly acquire Ca2+ during endogenous nerve activity
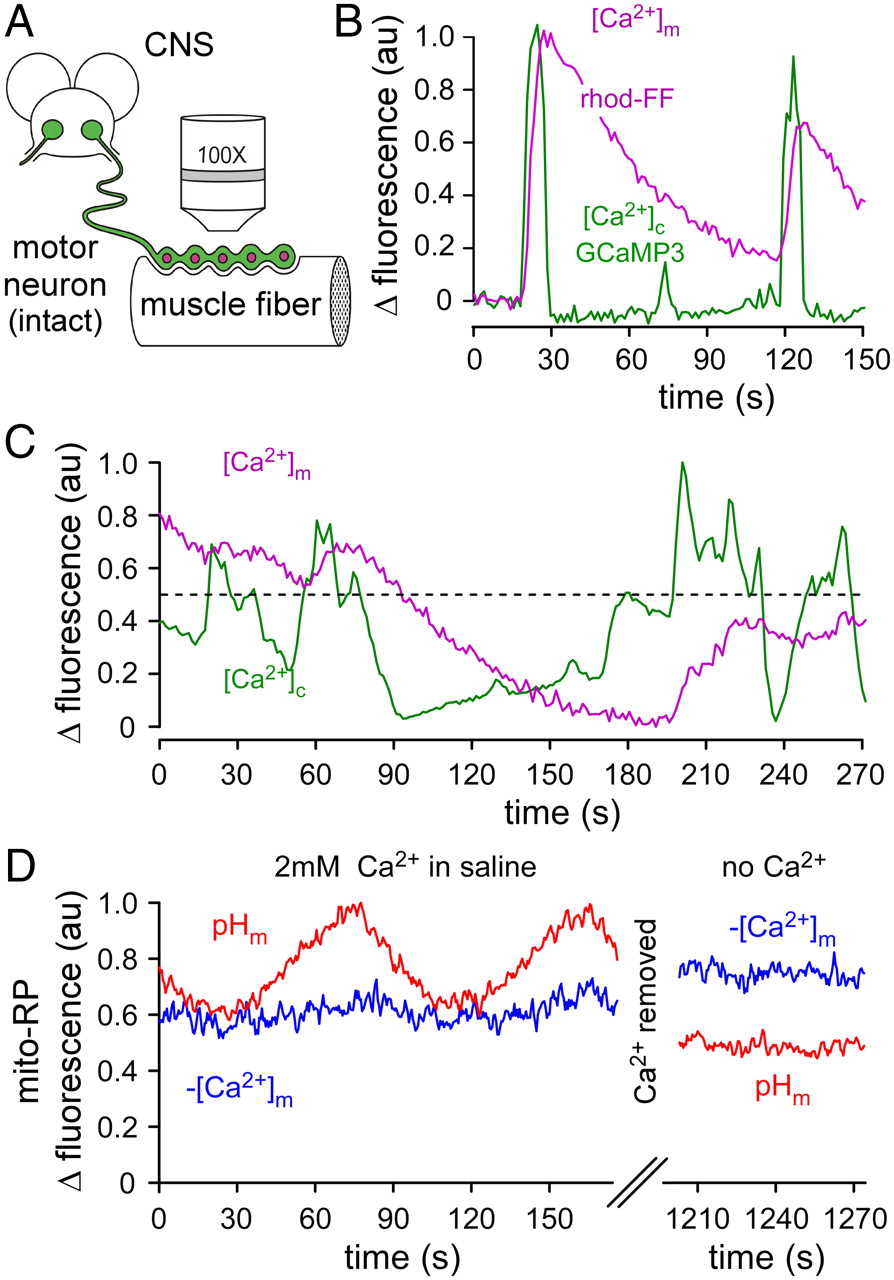
Presynaptic mitochondria acquire Ca2+ when axon firing is driven by externally applied stimuli, but stimulus trains are unlikely to adequately recapitulate complex endogenous activity. To test whether endogenous activity does lead to Ca2+ acquisition by presynaptic mitochondria, we left the motor nerves intact and examined changes in [Ca2+]c and [Ca2+]m in dissected restrained larvae during fictive locomotion (Fig. 6A). Endogenous activity led to robust changes in [Ca2+]c (revealed by cytosolic GCaMP3 fluorescence) that reflected the motor pattern (Fig. 6B,C). It also led to increases in [Ca2+]m (revealed by mitochondrial rhod-FF fluorescence) that matched the onset of [Ca2+]c transients. This demonstrates a robust mitochondrial capacity to acquire Ca2+ during endogenous activity.

Mitochondrial pH (pHm) is responsive to the changes in [Ca2+]m that occur during endogenous nerve activity. A, Schematic of a motor neuron terminal examined in situ, with an intact axon extending from the soma in the CNS. B, C, Changes in [Ca2+]c (GCaMP3) and [Ca2+]m (rhod-FF) during fictive locomotion. The dotted line in C indicates the approximate GCaMP3 fluorescence threshold for mitochondrial Ca2+ uptake. D, Changes in [Ca2+]m and pHm (mito-RP) during fictive locomotion, before (left) and after (right) the preparation is rinsed with HL6 containing 2 mm EGTA and no added Ca2+. Changes in fluorescence in D were scaled as described in Figure 1. Data were corrected for bleaching in B and C, but not in D. Genotypes are as follows. B: GCaMP3: w−; OK6-GAL4/UAS-GCaMP3.0; +/+; C, D: mito-RP: w−; OK6-GAL4/UAS-mito-RP(#8); +/+. Experiments in B–D were performed on MN13Ib termini in HL6 saline with 7 mm l-glutamic acid. Except where indicated otherwise, 2 mm Ca2+ was present.
[Ca2+]m and pHm are elevated during fictive locomotion
Studies of Drosophila larval locomotion indicate that the MN bursts may repeat as often as once every second during the rapid peristalsis of locomotion (Klose et al., 2005). Thus, since [Ca2+]c transients are closely spaced and mitochondrial Ca2+ release follows a slow time course, there will be occasions where [Ca2+]m summates substantially (Fig. 6C). Mito-RP fluorescence in intact MNs shows that pHm is high whenever [Ca2+]m is high (Fig. 6D, compare left and right sections). This presumably reflects ongoing motor patterns, but there are no genetically encoded Ca2+ reporters available, complementary to mito-RP, that would enable simultaneous monitoring of pHm and [Ca2+]c transients during motor activity. The cyclical changes in pHm seen in Figure 6D (left section) were common but unanticipated and occurred without obvious changes in [Ca2+]m. Unlike rhod-FF (Fig. 6B,C), the Ca2+-sensitive wavelength of mito-RP rarely showed discrete jumps that might indicate underlying motor activity, and this may reflect the high affinity of mito-RP (∼1.3 μm; Nagai et al., 2001) relative to rhod-FF (∼19 μm; Invitrogen). The data plotted in Figure 4E show that pHm is most responsive in the high end of the [Ca2+]m range reported by mito-RP. Therefore, during endogenous nerve activity, [Ca2+]m levels may persist in a range where mito-RP is close to saturation. To test whether extracellular Ca2+ was required for elevated [Ca2+]m and pHm levels during endogenous activity, Ca2+ was removed from the saline. As expected, [Ca2+]m fell (420 nm excitatory trace rose) and pHm fell (490 nm excitatory trace fell) (Fig. 6D, right section), suggesting that while Ca2+ had been in the bath the mitochondria had been in an elevated metabolic state associated with elevated [Ca2+]m.
Discussion
In most cells, the ADP:ATP ratio is conventionally accepted as the intrinsic metabolic integrator coordinating the demand of ATP consuming processes with oxidative phosphorylation (Erecińska and Wilson, 1982). In a number of cell types, including neurons, Ca2+ has been reported as an extrinsic regulator of oxidative phosphorylation (McCormack et al., 1990; Balaban, 2002; Kann and Kovacs, 2007), but this has not been demonstrated for individually identified nerve termini, nor has its relevance been established during endogenous nerve activity. On the basis of the data presented here, we suggest that [Ca2+]c coordinates ATP supply with demand in Drosophila motor nerve termini. We show that mitochondria rapidly acquire Ca2+ during nerve stimulation (Fig. 1) and endogenous nerve activity (Fig. 6) and that Ca2+ stimulates mitochondrial energy metabolism (Fig. 2), seen as elevations in pHm, Δψm, and [NAD(P)H]m. The ADP:ATP ratio is rejected as the primary stimulant of mitochondrial energy metabolism in response to nerve stimulation, because changes in pHm are profoundly diminished when Ca2+ is replaced with Sr2+ and abolished when either TPP+ or KB-R7943 is present to block mitochondrial Ca2+ uptake. Correspondingly, bongkrekic acid, which reduces the availability of ADP to the F1F0-ATPase, does not diminish the pHm elevations that accompany nerve activity.
The increases in pHm, Δψm, and [NAD (P)H]m indicate an increase in the capacity of presynaptic mitochondria to produce ATP and is thus analogous to an increase in oxidative phosphorylation. The elevation of these measures in response to nerve activity is not consistent with an invariant rate of oxidative phosphorylation, as all three measures rose despite the transient fall in Δψm and an increase in demand for ATP. Similarly, it is unlikely that an extramitochondrial source of ATP (glycolysis) has the capacity to reverse any presynaptic ATP deficit within seconds to inflate mitochondrial Δψm, pHm, d [NAD(P)H]m. However, until techniques become available to measure oxygen consumption, the utilization of mitochondrial metabolic substrates, or ATP production in presynaptic termini, we cannot directly substantiate the effect of Ca2+ on presynaptic oxidative phosphorylation or ATP production.
Studies in mice have shown that, in neurons and/or glia, electrical stimulation leads to a rapid decrease in NAD(P)H fluorescence followed by a sustained increase (Kasischke et al., 2004; Reinert et al., 2004). However, debate continues regarding which cell types and subcellular compartments are responsible for this increase and how many cell types or subcellular compartments produce the biphasic signals in NAD(P)H levels. The data presented here show that the increase in oxidative phosphorylation occurs in neurons, and the increase in NAD(P)H levels arises predominantly in mitochondria rather than the cytosol (Fig. 1H,I).
Mito-RP and mtAlpHi have provided the first pH data from presynaptic MN mitochondria in situ. They revealed an unexpectedly rapid pHm transient that matched the time of onset and cessation of both mitochondrial Ca2+ uptake and depolarization (Fig. 1E,F). Mitochondrial depolarization is consistent with Ca2+ entering the mitochondrion, but the TMRE data shown in this study indicate that Δψm starts regenerating the moment [Ca2+]m peaks. The time of onset of Δψm regeneration indicates that at the [Ca2+]m peak, Ca2+ (positive charge) entry to the mitochondrion either ceases or comes into balance with phosphate entry, which precipitates Ca2+ in the matrix. Mitochondrial alkalization is consistent with oxidative phosphorylation being stimulated by Ca2+, but its speed of onset, matching the onset of mitochondrial Ca2+ uptake, was not anticipated. Based on the stoichiometry of the calcium-phosphate complex formed in the matrix [Ca3(PO4)2], where uptake of one Ca2+ is accompanied by the generation and net extrusion of one proton (Chalmers and Nicholls, 2003), rapid acidification might well have been predicted. Rapid alkalization, however, suggests that Ca2+ entry to the mitochondrion may be in partial exchange for protons (H+). The latter mechanism is consistent with the two phases observed, where the initial pHm spike (Ca2+/H+ exchange) is coincident with Ca2+ uptake, which then collapses to give way to a smaller sustained elevation in pHm (Ca2+-stimulated ETC activity).
Unique to this study, we linked Ca2+-stimulated mitochondrial energy metabolism with endogenous nerve activity in individually identified MN termini by using electrophysiological techniques during fictive locomotion (Fig. 3) and subsequent fluorometric techniques across a range of frequencies (Figs. 4⇑–6). Not only does [Ca2+]c rise to levels at which mitochondria rapidly acquire Ca2+ during endogenous nerve activity (Fig. 6B,C), but surprisingly [Ca2+]c levels are very similar between MNs when they fire at their endogenous rates (Fig. 5C) despite large differences in these rates (Fig. 3B,C). As [Ca2+]c is a supralinear function of axon firing frequency for any given neuron (Tank et al., 1995), we had expected [Ca2+]c levels to be considerably higher in faster firing MNs when operating at their native firing frequencies. The apparent mitochondrial affinities for Ca2+ (Kapp) are also similar in different MNs (Fig. 5D). We speculate that evolutionary pressures may be responsible for the proximity of [Ca2+]c values (∼330 nm) to Kapp values (∼280 nm) due to advantages inherent in harnessing the Ca2+ dependence of mitochondrial energy metabolism in MN termini. Our data can reveal little about whether Kapp adjusted to accommodate [Ca2+]c levels or vice versa, but as [Ca2+]c has adjusted to a similar level in different MNs despite different firing rates, we favor the hypothesis that MN termini have adapted to accommodate the common Kapp of their mitochondria.
We propose that mitochondrial Ca2+ uptake from the cytosol is pivotal for stimulating oxidative phosphorylation and that the ADP:ATP ratio, or other feedback mechanisms, may only play a minor role in coordinating presynaptic ATP supply with demand. Our study has focused on the period during and immediately following short stimulus trains, encompassing tens of seconds, where changes in pHm, Δψm, and [NAD(P)H]m are most pronounced. Nevertheless, Ca2+-stimulated presynaptic mitochondrial energy metabolism over longer periods of time remains to be examined. For example, is this mechanism called upon to a greater degree in those MNs with a high work rate? The data in Figures 4D indicate that this may be the case because, at endogenous firing rates, mitochondria in fast-firing MN13Ib fill more rapidly with Ca2+ than those in slow-firing MN6/7Ib. As there was no indication of mitochondrial Kapp being higher in MN13Ib (Fig. 5D), it may be that [Ca2+]c rises to marginally higher levels in faster firing MNs. However, although trends consistent with this hypothesis were observed in two independent datasets (Fig. 5C), the trends were not significant. Reconciliation of these datasets might be found in the understanding that [Ca2+]m has a second power dependence on [Ca2+]c (Nicholls and Ferguson, 2002), and the acceptance that our estimates of [Ca2+]c may lack the resolution to resolve small differences between MN termini. Whatever the reason for [Ca2+]m being driven higher in MN13Ib during endogenous activity, higher levels of mitochondrial energy metabolism seem to be a risky long-term condition as they are associated with higher rates of production of reactive oxygen species (Nicholls, 2008), while outright mitochondrial failure has devastating consequences (Mattson et al., 2008). An alternative strategy to support high work rates would be to increase presynaptic mitochondrial density, but data on presynaptic density are not available for Drosophila larvae.
The proximity of the average Kapp value for mitochondrial Ca2+ uptake (∼280 nm; Fig. 5D) to [Ca2+]c at native firing frequencies (∼330 nm; Fig. 5C) might suggest that mitochondrial Ca2+ uptake limits [Ca2+]c in different MNs. In Drosophila larval MNs, however, this is not the case. Both genetic and pharmacological approaches have shown that during short stimulus trains like those used here, [Ca2+]c levels are not affected by the absence of functional mitochondria (Guo et al., 2005; Chouhan et al., 2010). If not mitochondrial Ca2+ uptake, then what mechanism establishes the ceiling for presynaptic [Ca2+]c during endogenous activity? While this study does not reveal the mechanism, we speculate that either the plasma membrane ATPase (PMCA) or the Slowpoke channel might play a role. PMCA may limit [Ca2+]c, as it has been shown to clear most of the Ca2+ from these termini (Lnenicka et al. 2006). In termini without mitochondria and thus without the high ATP production rates conferred by oxidative phosphorylation, there may be sufficient reserves of ATP to power the PMCA over the duration of short stimulus trains, but ATP levels are likely to deplete over longer durations, and [Ca2+]c would be expected to rise. Indeed, [Ca2+]c levels do rise during sustained stimulus trains in the absence of presynaptic mitochondria (Guo et al., 2005; Verstreken et al. 2005). On the other hand, the Slowpoke channel may also contribute to enforcing a ceiling for [Ca2+]c because this K+ channel will open as [Ca2+]c increases (Elkins et al., 1986), which in turn suppresses plasma membrane excitability.
In the lizard MN terminal, nerve stimulation drives down both presynaptic NAD(P)H levels and Δψm (Talbot et al., 2007; 2008), and although both recover once stimulation ceases, there is little indication of the overshoot seen in Drosophila MN termini. It would be interesting to know how 50 Hz stimulus trains of 10–50 s duration used in the studies on lizard MNs compare to the endogenous activity of lizard MNs and what happens in response to less prolonged trains. The differences between Drosophila and lizard MNs are especially intriguing, as some reports have indicated that intramitochondrial dehydrogenases of invertebrates lack sensitivity to Ca2+ (McCormack and Denton, 1981). Given the diversity in terminal types in both vertebrate and invertebrate nervous systems, it seems likely that mitochondrial Ca2+ uptake will prove to be important for stimulating mitochondrial energy metabolism in other nerve termini.
Footnotes
This study was supported by a grant from the National Institute of Neurological Disorders and Stroke to GTM [National Institutes of Health (NIH) R01 NS061914]. We thank Bloomington Drosophila Stock Center, Vienna Drosophila RNAi Center, Benjamin Eaton, and Loren Looger for providing fly strains, Tullio Pozzan for providing plasmids, Rosario Martinez for assistance preparing cDNA and maintaining fly stocks, William Morgan for advice on statistical analysis, and Balaji Iyengar, Monica Maldonado, Rene Renteria, and Adam Rossano for critical comments on this manuscript.
- Correspondence should be addressed to Gregory T. Macleod, Department of Physiology, University of Texas Health Science Center at San Antonio, 7703 Floyd Curl Drive, San Antonio TX 78229. macleod{at}uthscsa.edu


