

Abstract
Peripheral waves (PWs) in the channel catfish are odorant-induced neural oscillations of synchronized populations of olfactory receptor neurons (ORNs) that appear after the initial ∼500 msec of the response. The mean dominant frequency during the initial 2 sec of PW activity is ∼28 Hz, declining to ∼20 Hz in the last sec of a 5 sec stimulus. Recordings of PWs from different regions of a single olfactory lamella and simultaneously from widely separated lamellae within the olfactory organ suggest that PWs are initiated in the sensory epithelium within each olfactory lamella. Simultaneous recordings in vivo from the olfactory organ [electro-olfactogram (EOG) or integrated neural activity], local field potentials (LFPs) from the olfactory bulb (OB), and single and few-unit activity from OB neurons were performed. Cross-correlation analysis of simultaneously recorded odor-induced OB LFPs and either EOG or ORN neural activity showed that oscillations occurring within the OB were lower (<20 Hz) than those of PWs; however, during PW activity, OB LFPs increased both their magnitude and dominant frequencies and became correlated with the PWs. Also during odorant-induced PW activity, the responses of different OB neurons with similar odorant specificity became phase locked to each other and to both the PWs and OB LFPs. PWs are hypothesized to function to strengthen the synaptic transfer of olfactory information at specific glomeruli within the OB.
- olfactory receptor neuron
- local field potentials
- oscillations
- peripheral waves
- olfactory bulb
- channel catfish
The origin, nature, and functional roles of synchronous oscillatory activity in sensory systems are major unresolved issues. Oscillatory neural activity has been reported in olfactory pathways of the CNS in a wide variety of vertebrates (Ottoson, 1959; Takagi and Shibuya, 1960a,b; Freeman, 1975; Satou, 1990; Schoppa and Westbrook, 2001) and invertebrates (Gelperin and Tank, 1990; Delaney et al., 1994; Hasegawa et al., 1994; Kleinfeld et al., 1994; Laurent, 1996; Mellon and Wheeler, 1999; Teyke and Gelperin, 1999; Ito et al., 2001) and has been proposed to be involved in odorant quality coding (Laurent and Davidowitz, 1994; Wehr and Laurent, 1996). The neural synchrony observed in recordings from different CNS structures either could arise intrinsically within neural networks of interconnected neurons or could be transmitted there by input neurons. Although neural oscillations may be endemic to the olfactory bulb, input of synchronized olfactory receptor neuron (ORN) activity may modulate this bulbar activity.
In addition to synchronous neural activity within the CNS, synchronous oscillatory activity within the vertebrate olfactory organ itself [i.e., peripheral waves (PWs)] has frequently been reported (see Table 1) but has often been ignored when considering the neural processing of olfactory information. It was suggested almost 50 years ago, however, that waves recorded in the olfactory bulb (OB) had a more peripheral origin (Adrian, 1955). Regular voltage oscillations with a frequency of 15–25/sec evident in electro-olfactogram (EOG) records were suggested to represent intermittent synchronous activity in groups of ORNs (Ottoson, 1956). Because there are no established neural connections between ORNs [although a connexin subunit was recently reported to occur within ORNs (Zhang et al., 2000)], the mechanism of the peripheral synchronous activity remains unclear.
The majority of previous studies indicating PW activity examined odorants that were of questionable relevance to the animals tested. However, large amplitude PWs (30–40 Hz), which were two to three times the frequency of the oscillations observed in the olfactory bulb, were recorded in Atlantic salmon (Salmo salar) in response to biologically relevant amino acids (Sutterlin and Sutterlin, 1971). After this report, a paucity of quantitative information on PWs existed for nearly 30 years. Lately, however, there has been a renewed interest in odorant-induced oscillations within the olfactory system, and especially those occurring in the initial portions of the olfactory pathway, the olfactory epithelium and olfactory bulb. Odorant-induced synchronized responses of ORNs were recently reported in the tiger salamander (Dorries and Kauer, 2000), channel catfish (Parker et al., 2000), Japanese toad (Nakazawa et al., 2000) and box turtle (Lam et al., 2000). The present report investigates the basic properties of PWs in the channel catfish and their effects on local field potentials (LFPs) and single-cell activity recorded within the olfactory bulb.
MATERIALS AND METHODS
Experimental animals
The majority of channel catfish (Ictalurus punctatus; 25–50 gm) tested were raised at the Louisiana State University Aquaculture Center and maintained in floating cages held in ponds at the facility. Additional channel catfish were obtained from a local hatchery. The fish held in the ponds were fed weekly with floating commercial fish chow. Each week catfish were transferred to an aerated, 250 l polyethylene aquarium filled with charcoal-filtered city tap water at the Louisiana State University Animal Care Facility and maintained on a 12 hr light/dark cycle. The temperature was held above 27°C during the spring and summer and below 20°C during the fall and winter to help avoid bacterial (Edwardsiella ictaluri) infection (Morrison and Plumb, 1994). The fish were used experimentally within a 1 week holding time and were not fed during this period.
Animal immobilization and anesthesia
The preparation of the animals was the same as that described previously (Kang and Caprio, 1991). Each catfish was initially immobilized with an intramuscular injection of the neuromuscular blocking agent Flaxedil (gallamine triethiodide, 0.03 mg/100 gm). During the experiments, additional injections were applied as needed via a hypodermic needle embedded in the flank musculature. The immobilized fish was wrapped in a wet Kim-Wipe, placed in a Plexiglas container, and stabilized using a pair of orbital ridge clamps. The gills were irrigated using an orally inserted glass tube supplying a constant flow of aerated, charcoal-filtered city tap water. For recordings from the olfactory organ, the gill irrigation water contained the anesthetic, 50 mg/l (initial concentration) ethyl-m-aminobenzoate methane sulfonic acid (MS-222). For recordings within the CNS, once the surgery was complete, the gill irrigation water containing MS-222 was replaced with water not containing the anesthetic; however, a topical anesthetic, tetracaine (3%), was used to liberally coat the surface of the skin around the incision regions.
Surgical preparation
Access to the olfactory organ was achieved by removing skin and connective tissue between the incurrent and excurrent nares, superficial to the olfactory organ. In a subset of experiments, the pedunculated olfactory bulb was also exposed by removing a 1 cm section of skin and subcutaneous fat at the midline of the fish caudal to the nasal capsule. After the removal of the underlying bone and cartilage, suction was applied to remove adipose tissue from the cranial cavity.
Stimulus compounds and delivery
Representatives of four different classes of amino acids—l-glutamic acid (acidic), l-arginine (Arg) (basic), l-methionine (Met) [neutral with a long side chain (LCN)], and l-alanine (Ala) [neutral with a short side chain (SCN)]—were presented individually (10−6 to 10−2m) and in binary mixtures with citrate (trisodium) (0.5 m and 1.0 mm). All stimuli used in the study were prepared using charcoal-filtered city tap water, pH adjusted (8.5–9.0) to match both the control water bathing the olfactory organ and the natural pH of the local ponds from which the fish were maintained. Stock solutions at 10 mm were prepared weekly, except for citrate, which was prepared daily. During the experiments, a series of four to five consecutive odorants was preceded and followed by the presentation of the standard (1 mml-methionine). Stimulus delivery was via a “gravity-feed” system using a spring-loaded valve (Model 5301, Rheodyne Inc., Cotati, CA.) driven by a pneumatic actuator (Model 5300) at 40 psi. Stimulus solutions and charcoal-filtered artesian water used to bathe the olfactory mucosa between stimuli were delivered through separate Teflon tubes (0.8 mm diameter) at a rate of 6–8 ml/min. The olfactory cavity was perfused continuously with charcoal-filtered tap water to (1) facilitate stimulus delivery, (2) protect the mucosa from desiccation, (3) avoid the introduction of mechanical artifacts associated with stimulus presentation, and (4) thoroughly rinse the olfactory cavity between stimuli (2–3 min interstimulus intervals). A foot switch connected to an electronic timer (Model 645, GraLab Instruments Division, Dimco-Gray Corporation, Centerville, OH) triggered the valve to introduce the odorants for either a 3 or 5 sec stimulus duration. Adaptation experiments were performed by continuously bathing the olfactory mucosa with a ternary mixture consisting of a representative of three of the four classes (SCN, LCN, acidic, and basic) of amino acids (each at 3 mm) for 5–8 min. After the initial adaptation period, binary test mixtures (5 sec duration) of single amino acids (LCN and SCN at 1 mm; acidic and basic at 2 mm) and trisodium citrate (at 1 mm) were presented. Immediately after the 5 sec application of the binary test mixture, the continuous flow of the adapting amino acid ternary mixture resumed.
Recording techniques
Olfactory epithelium: electro-olfactogram recordings
The EOG, a slow negative potential measured in the water immediately above the olfactory mucosa when exposed to odor and thought to reflect summated olfactory receptor generator potentials (Ottoson, 1971; Caprio, 1995), was recorded in vivo using calomel electrodes via Ringer's-agar-filled capillary pipettes (Silver et al., 1976; Caprio, 1995). For the majority of experiments, the EOG was amplified by a DC amplifier (Grass P-18, Astro-Med Inc., West Warwick, RI); however, in a subset of experiments in which greater amplification was necessary, the EOG was amplified by an AC amplifier (Grass P511; 3–300 Hz bandpass). The amplified, AC-recorded EOG accentuated the onset of both the response and the odor-induced voltage oscillations to allow for more precise estimations of both. EOGs were observed on an oscilloscope, digitized, and stored on the video channel of a high-fidelity stereo video recorder. The recorded EOG signal served as an indicator of occurrence of peripheral waves, the viability of the preparation, and the onset and reproducibility of the response.
ORN surface neural recordings
In vivo recordings of multiunit ORN activity were made using metal-filled glass capillary electrodes plated with platinum (Pt) (ball diameter, ∼15 μm; impedance, 10–40 kΩ) placed against the sensory face of an olfactory lamella (Gesteland et al., 1959;Caprio, 1995). The electrode was coupled (220 pF capacitor, 20 MΩ resistor) to a high impedance probe at one input with the other input grounded via a hypodermic needle embedded in the flank musculature of the fish. The receptor neural activity was amplified (Grass P511; bandpass 30–300 Hz), observed on an oscilloscope, integrated (0.5 sec), and displayed on a pen recorder. These amplified signals were stored on a high-fidelity stereo video recorder as an analog or a digitized video signal.
Olfactory bulb
Local field potentials. In three initial experiments (see Fig. 7), OB LFPs consisting of summated dendritic current (Varela et al., 2001), were recorded at ∼200–300 μm depth with Parylene-coated microelectrodes (∼1 MΩ; A-M Systems, Inc., Carlsborg, WA) (bandpass 3–3000 Hz) within the mid-lateral, amino acid-responsive region of the olfactory bulb (Nikonov and Caprio, 2001). All the following OB LFPs were recorded with the same electrode that simultaneously recorded unit activity from the OB (see below) (bandpass 3–300 Hz) from more restricted regions within the mid-lateral amino acid-responsive region of the olfactory bulb. LFP activity was amplified (Grass Instruments P-511), observed with an oscilloscope, digitized, and stored on the video channel of a high-fidelity video recorder.
OB units. Unit/few-unit activity (generally 350–1000 μV peak-to-peak amplitude) was recorded extracellularly from OB neurons with low-impedance (2–5 MΩ) platinum and gold-plated, metal-filled, glass micropipettes (glass tip, 2 μm; ball diameter, 3–4 μm) [modified from (Gesteland et al., 1959; Caprio, 1995)]. Soda lime glass [inner diameter 1.1–1.2 mm, thin wall (0.2 mm)] was pulled on a vertical puller (Narishige PP-83) to provide a 1.5–2 μm tip. A small rod of Cerrelow metal was inserted into the glass pipette and melted on a hot plate while being pushed with a metal rod (which also acted as a heat sink) toward the pulled tip of the glass. The electrode was electroplated for ∼3 sec (1.5 V battery through a 10 MΩ resistor) with gold (code 3023, Sifco, Cleveland, OH) to form a 2–3 μm ball followed by a Pt (5% Pt chloride) coating electroplated (5 sec through a 50 MΩ resistor) over the gold. Final impedance of the electrode was 2–5 MΩ depending on the size of the electroplated ball. The electrode was mounted on a hydraulic microdrive and advanced vertically downward from the dorsal surface of the olfactory bulb. Recordings began once a spontaneously active unit was encountered and clearly isolated by fine-positioning the recording electrode via the remote fluid-filled microdrive. The neural activity was amplified (Grass Instruments P511; bandpass 30–10,000 Hz), observed with an oscilloscope, and stored as an analog signal on an audio channel of a high-fidelity VCR.
Data acquisition and analysis
All recorded data from both the olfactory lamellae and OB were digitized at 32 kHz and analyzed off-line by Discovery with Autocut software (Brainwave Systems Discovery package, Version 5.0, DataWave Technologies Corp., Longmont, CO) and printed. Spike events, EOG signals, OB LFPs, and experimental parameters (i.e., beginning of a recording period, onset of stimulation, and end of the recording period) were time stamped with a 32 bit 100 μsec resolution value and saved in a data file. The BrainWave data files were displayed on a computer screen and printed out for initial visual analysis. Neuroexplorer software (Nex Technologies, Lexington, MA) was used to analyze by time series analysis the power density spectrum that gives the distribution of the squared amplitude of different frequency components within the recorded activity. Cross-correlation analysis determined the degree of relationship between two signals, which is the time average of the product of the two signals as a function of the time delay between both (Lopes da Silva and Pijn, 1995).
RESULTS
PW basics: forms, stimuli, origins, and frequencies
Highly evident, odor-induced PWs were observed in EOG and neural recordings (Fig. 1, Table1) as various patterns of oscillatory activity. In 83% (38 of 46) of the channel catfish tested, PWs were clearly visible in response to binary mixtures of a single amino acid and trisodium citrate (“citrate”), naturally occurring odorants that catfish would likely encounter during feeding behavior. PWs were also generated by ORNs in response to a binary mixture of citrate and a representative from each class of amino acid (acidic, basic, neutral with a short side-chain, and neutral with a long side-chain) (Fig. 2; Table2). The cross-adaptation paradigm was used to indicate that PWs are generated by ORNs responsive primarily to the particular test stimulus and not by ORNs responsive primarily to other classes of amino acids (see Discussion).

Different PW patterns were observed in response to 3 sec applications of a binary mixture of an amino acid and citrate.1, Continuous oscillations with similar magnitude in response to 0.1 mml-Met + 1 mmNa3 citrate; 2, discontinuous oscillations with similar magnitude in response to 0.1 mml-Ala + 1 mm Na3 citrate;3, continuous oscillations with declining magnitude in response to 0.1 mml-Met + 0.5 mmNa3 citrate; 4, discontinuous oscillations with varying magnitude in response to 0.1 mml-Met + 1 mm Na3 citrate;5, abbreviated response to 0.1 mml-Ala + 0.5 mm Na3 citrate.
Peripheral wave phenomena and comparison with olfactory bulbar waves

PWs are generated by stimulus mixtures containing an amino acid not present in the adapting solution. The olfactory epithelium was adapted to the ternary mixture l-Arg,l-Ala, and l-Na+ glutamate (each at 3 mm) for 5 min before the presentation of the stimulus mixture containing 1 mml-Met + 1 mm Na3 citrate (A1) (Table 2), which was not present in the adaptation mixture. The stimulus mixture containing 1 mml-Ala + 1 mmNa3 citrate (A2) (Table 2), consisting of an amino acid present in the adaptation mixture, did not trigger PWs.
Peripheral waves occur in response to a binary mixture of citrate and an amino acid not present in the adapting odor mixture
PWs were recorded only within the sensory regions of individual olfactory lamellae (Fig. 3) and simultaneously within sensory regions across different olfactory lamellae located at opposite ends of the olfactory organ (n = 3) (Fig. 4). In the simultaneous recordings, cross-correlational analysis of the peak frequencies indicated that no apparent synchrony occurred between the activity recorded from the two electrodes during prestimulus (i.e., spontaneous activity) (Fig. 4A), during the initial 500 msec post stimulus (Fig. 4B), or after termination of the odor (Fig. 4D). However, PWs clearly became synchronized after >500 msec after stimulus onset (Fig.4C).

Peripheral waves are generated within the olfactory sensory epithelium. A, Dorsal view of the olfactory organ of the channel catfish. M, Medial;C, caudal; L, lateral; R, rostral. B, Expanded view of a single olfactory lamella comprising sensory (filled medial portion of lamella) and nonsensory (NS) epithelia. PWs are recorded in response to a binary mixture of 1 mml-Met and 1 mm Na3 citrate only within the sensory (1, 5) and not the NS (2–4) epithelia.Numbers represent the sequence of the recording electrode positions in a single preparation. All recordings shown were obtained in the same fish.

Cross-correlation analysis (0.5 sec) of olfactory receptor responses to 1 mml-Met + 1 mm Na3 citrate recorded simultaneously with microelectrodes positioned within the sensory region of lamellae located at opposite ends (rostral and caudal) of the olfactory organ. No correlation was detected between the electrodes 0.5 sec before (A) and 0.5 sec after (B) stimulus onset. Correlation (time lag, ∼5 msec) between the odor responses recorded at the two electrodes was observed during PW activity 1 sec after stimulus onset (C). No correlation occurred after termination of the stimulus (D). All recordings were obtained in the same fish.
During the first 2 sec of PW activity in response to a 5 sec stimulus of 1 mml-methionine + 1 mmcitrate, the mean frequency observed from printed records of the oscilloscope display of the neural activity was 28.0 ± 5.6 (SD) Hz (n = 25 fish, 283 trials) (Fig.5) and 28.5 ± 4.8 Hz (n = 8 fish, 92 trials) from a subset of the previous data measured by power spectral density (PSD) analysis (Fig.6). PWs of differing frequencies could be elicited by the same stimulus in the same fish as indicated by the distribution of PW frequencies across the 25 tested fish (Fig. 5). PW frequencies sampled in a subset of these fish during the fifth second of a 5 sec stimulus application decreased by 7.9 ± 5.0 Hz (n = 8 fish, 92 trials; PSD analysis). PSD analysis of periods of spontaneous activity revealed intrinsic olfactory epithelial oscillations only 0.12 ± 0.3% (n = 6 fish, 57 trials) in magnitude of those corresponding to PW peak frequencies.

Distribution of the dominant frequency components of PWs in response to a 5 sec application of 1 mml-Met + 1 mm Na3 citrate (n = 25 fish, 283 trials).

Olfactory receptor recordings and power spectral density analyses of neural oscillations in the olfactory epithelium. Actual recordings (A1–D1) from the same fish and their respective PSD analyses (percentage power of the frequencies between 0 and 50 Hz) (A2–D2). A, Prestimulus, 0.5 sec; B, 1.0–1.5 sec after stimulus onset;C, 1.5–2.0 sec after stimulus onset; D, the first 0.5 sec after termination of the 5 sec odor.
PWs modulate OB activity
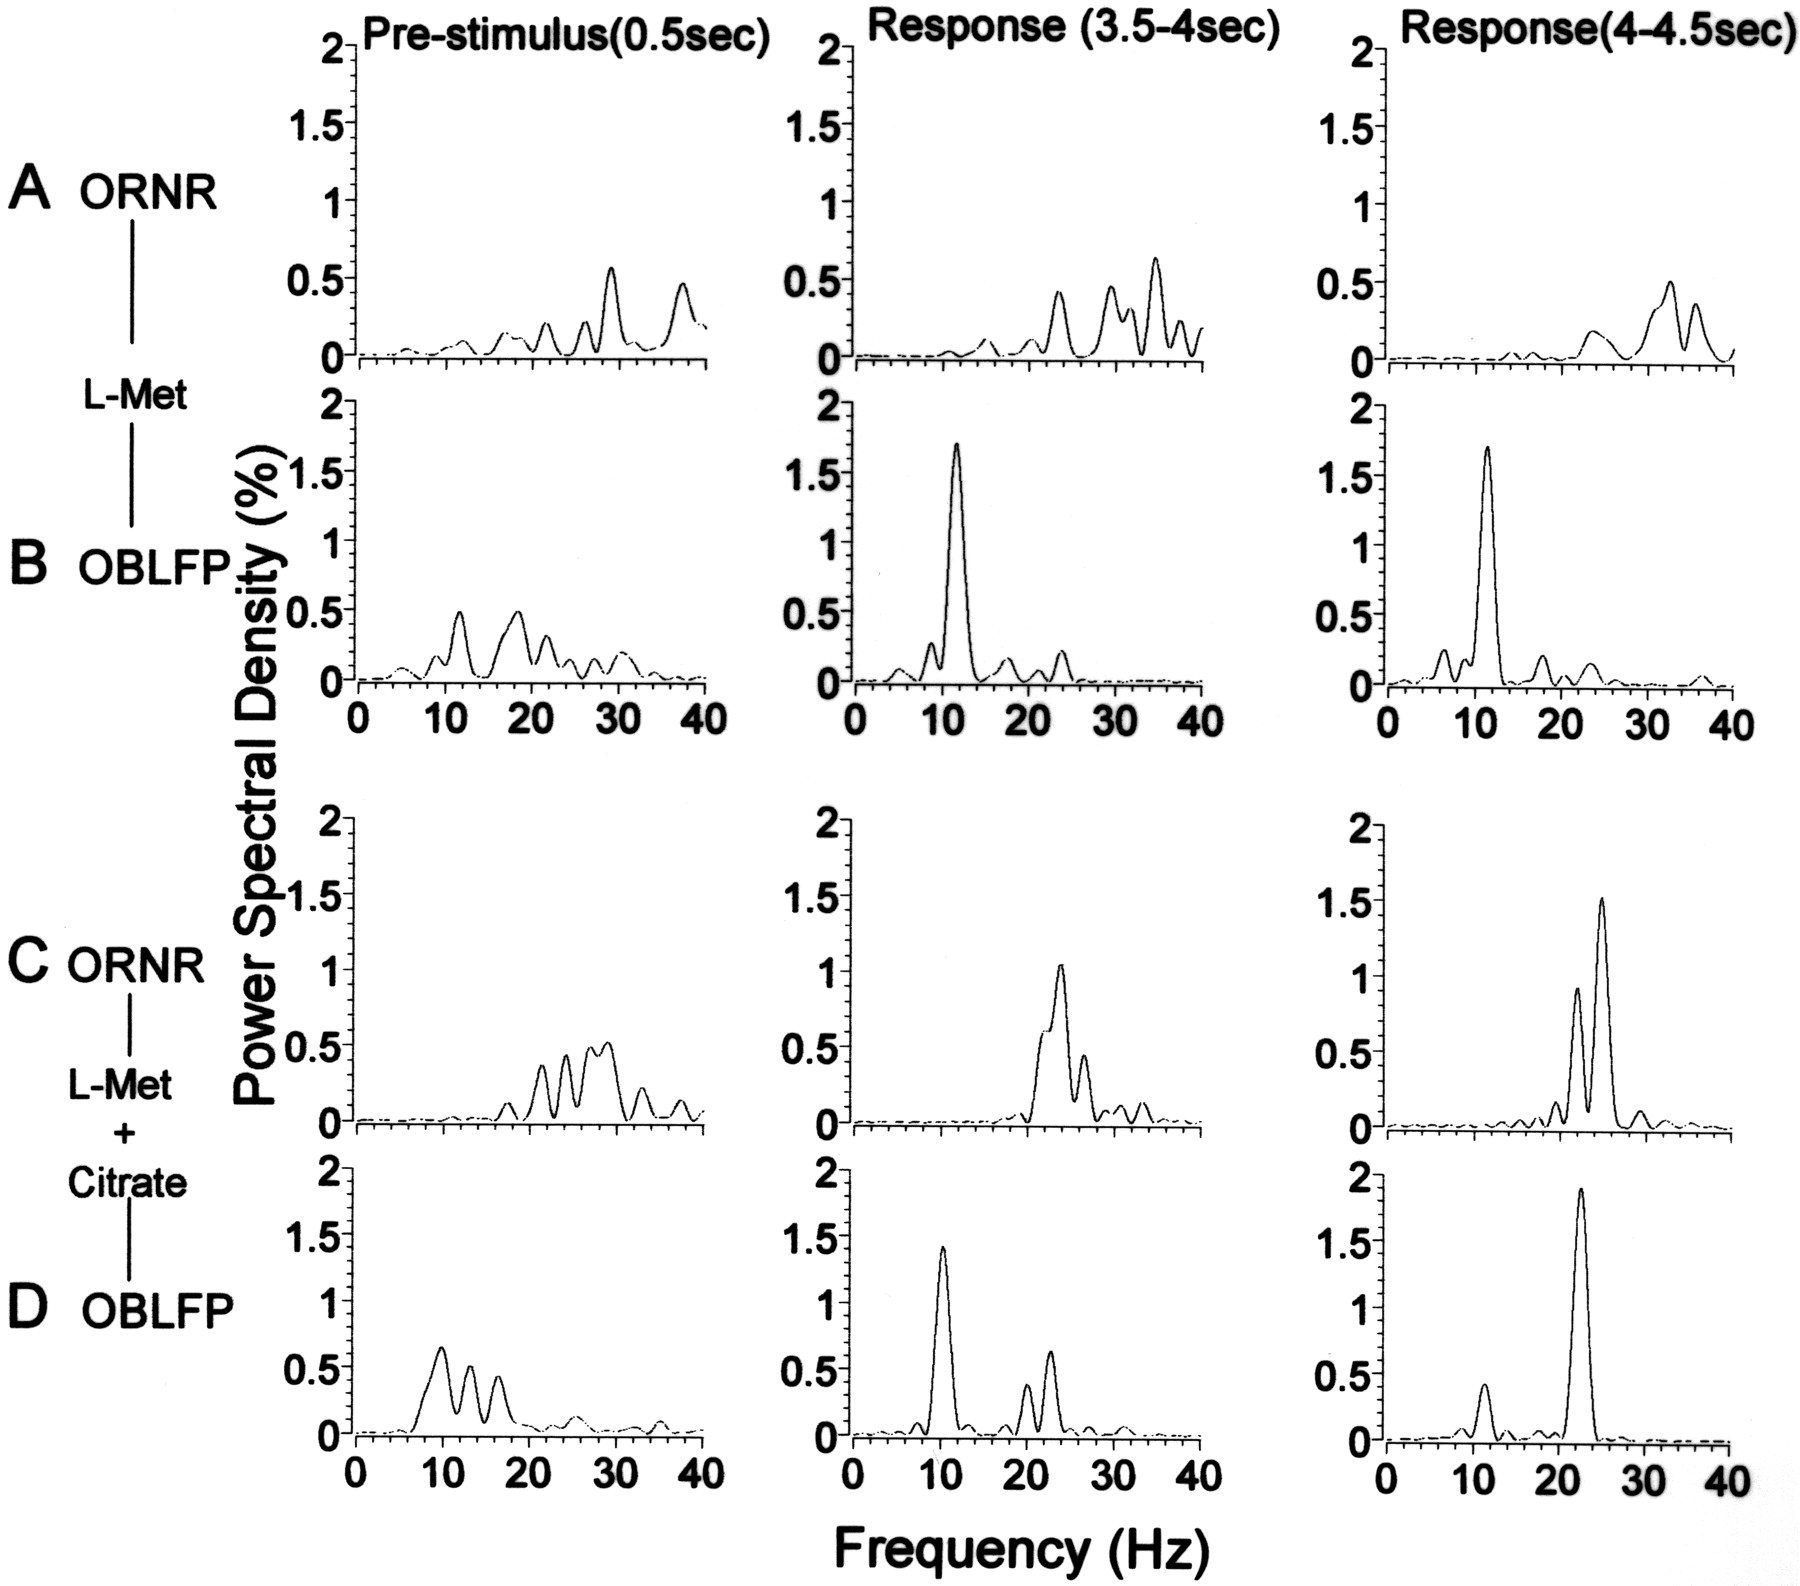
Simultaneous recordings (EOG) from the olfactory organ, LFPs from the OB, and single and few-unit activity from OB neurons were performed. The application of an odorant to the olfactory organ resulted in the initiation of a negative EOG response that was followed within 266 ± 27 msec (SD) (n = 52 trials, 16 fish) by the start of evident OB LFP activity. Instead of recording EOG responses in a few initial studies, integrated neural activity from populations of ORNs was recorded simultaneously with LFPs (Fig. 7). In the absence of PWs (Fig. 7A), the major frequency of odor-induced OB LFPs was <20 Hz (Fig. 7B, Table 1). However, if an odorant initiated PW activity, the PWs were observed in the EOG record 565 ± 86 msec (n = 45 trials, 16 fish) after the start of odorant-driven OB LFP activity and resulted in a delayed (253 ± 67 msec; n = 43 trials, 16 fish) modulation of OB LFP activity. PWs caused an increase in both the dominant frequencies (corresponding to the dominant PW frequencies) (Fig. 7C,D) and magnitude (Figs.7C,D,8A2,3) of OB LFPs. The PW-induced upward shift in OB LFP frequency resulted within the first 1.5 sec of PW activity in the synchronization (Fig.8B2,3) between these two waves with a time lag of 21.4 ± 6.9 msec (n = 45 trials, 16 fish) (Fig. 9); however, within the next 1.5 sec, PWs and OB LFPs became phase locked with a time lag of only 6.1 ± 2.9 msec (n = 45 trials, 16 fish) (Fig. 9). During latter portions of an effective odorant presentation, PW activity often waxed and waned in amplitude over time (Fig.8A,b3). When PW activity diminished (Fig. 8A,b3, mid-region delimited by arrows), power of the specific PW and OB LFP response frequencies also declined, and PWs and OB LFPs became uncorrelated (Fig. 8B,3b).

PSD analysis (0.5 sec; percentage power of frequencies between 0 and 50 Hz) of olfactory receptor neural recording (ORNR) (A, C) and olfactory bulbar local field potentials (OBLFP) (B, D) activity in the absence of (A, B) and during (C,D) PW activity. Left column, Analysis of spontaneous activity 0.5 sec before stimulus onset;middle column, analysis of the response 3.5 sec after stimulus onset; right column, analysis of the response 4 sec after stimulus onset. The stimulus in A andB is 1 mml-Met. The stimulus inC and D is 1 mml-Met and 1 mm Na3 citrate. All recordings were obtained in the same fish.

Simultaneous recordings of OB LFP (Aa) and DC-recorded EOG (Ab) before (A1) and during (A2,3) PW response to 0.1 mml-Met + 0.5 mmNa3 citrate. Delay between the start of PWs and the enhancement of OB LFP activity is shown (A2,3, arrows withdashed lines); PWs increase and decrease (portion of record between arrows with solid lines) in magnitude during response (A,b3). B, Cross-correlation analysis (0.5 sec) indicates correlation between EOG recorded PWs and OB LFPs before (B1) and during (B2, 3a,c) response to 0.1 mml-Met + 0.5 mm Na3citrate; correlation declines during the decrease in PW magnitude (B,3b). There is no correlation between EOG and OB LFP activity 0.5 sec before stimulus presentation (B1).

Cross-correlation analysis between PWs and OB LFP. Simultaneously AC-recorded EOG (A) and OB LFP (B). Decrease in time lag during PW/OB LFP synchrony between initial (Aa, C) and later (Ab, D) portions of the PW response.
During evident PW activity, the percentage occurrence of phase locking of OB unit activity with OB LFPs also increased. In response to 10−4ml-Met or l-Arg without the addition of citrate (where PWs were not evident in the EOG record), 46.2% (for l-Met) and 29.4% (for l-Arg) of bulbar recordings indicated synchrony between OB LFP and OB unit activity with a time lag of ∼20 msec (Table3); however, during PW activity in response to Met + citrate and Arg + citrate, the number of times that synchrony was observed between OB LFP and OB unit activity increased to 84.5 and 76.5%, respectively (Table 3). Corresponding to the time of PW activity and the increased synchrony between OB LFPs and single OB unit activity, unit responses from different individually and simultaneously recorded OB units within a specified bulbar region (most likely within a single glomerular module) became phase locked to each other and to the PWs (Fig. 10).
Time lag (milliseconds) between synchronized OB LFP and unit activity

Simultaneous recordings of action potentials from three different OB neurons (A1–3) and the EOG (AC recorded) (A4) to 0.1 mml-Met + 0.5 mm Na3 citrate in the same preparation as in Figure 9. Cross-correlation (1.5 sec) between EOG and the three OB units (B,C1–3) during initial (A,4a, B) and later (A,4b,C) portions of PW activity. Dashed linesin C indicate phase locking between PWs and three OB units.
DISCUSSION
PWs are naturally occurring phenomena
PWs are odorant-induced oscillatory activity evident in healthy experimental animals representing each class of vertebrate (Table 1). Binary mixtures of an amino acid and trisodium citrate were used in the present study to increase the likelihood of observing PWs and reduce the odorant concentration from that necessary to elicit PWs by an amino acid alone (Parker et al., 2000). Both amino acids and citrate would most likely emanate from food in the aquatic environment. Amino acids are present in high concentration (up to a few hundred millimoles per liter) in all living tissue (Carr et al., 1996) and are naturally released into the water. Citrate occurs in all cells that undergo aerobic respiration via the citric acid (i.e., Krebs') cycle, and tissues of common foods for channel catfish, such as insects, contain >30 mm citrate (Wyatt, 1961). Citrate at the concentrations used in this report was generally nonstimulatory but acts as a calcium chelator that lowers the surface potential of the ORNs, making those ORNs responsive to the tested amino acid odorants more excitable (Parker et al., 2000).
PWs originate from the neural activity of ORNs within the olfactory organ and are not caused by centrifugal influence or electrotonic spread from the OB, because transection of the olfactory nerve does not eliminate the synchronous activity (Sutterlin and Sutterlin, 1971;Dorries and Kauer, 2000; Nakazawa et al., 2000). Unfortunately, the short olfactory nerve and pedunculated OB of the channel catfish did not allow for a similar experiment to be performed without damage in this species to both the olfactory organ and bulb. Although PWs originate within the sensory epithelium, the evidence suggests that they are initiated independently in separate portions of the olfactory epithelium. PWs were simultaneously recorded in surgically separated and insulated rostral and caudal portions of the olfactory epithelium in the Japanese toad (Nakazawa et al., 2000), and in the present study, PWs of similar, but not identical, peak frequencies were recorded simultaneously to the same stimulus from the sensory epithelium in widely separated olfactory lamellae. The ≥500 msec delay from response onset to the observance of the start of PW activity is possibly caused by the time required for the responses from large numbers of ORNs located across the olfactory sensory epithelium to become sufficiently phase locked.
PW origin and olfactory quality code implications
Although numerous examples of PW activity have been reported previously (Table 1), only a few investigators offered possible mechanisms for their origin. Because the EOG response to a potent odorant could be of sufficient voltage (i.e., ≥4 mV) to electrically stimulate ORNs (Lettvin and Gesteland, 1965), PWs were suggested to be initiated by the EOG voltage wave electrically stimulating those ORNs not primarily involved in generating the EOG (Tucker, 1975a,b). The cross-adaptation experiments in the present study suggested, however, that only the ORNs that were responsive to (and therefore expressed molecular receptors for) the amino acid odor tested were sufficient to generate PWs. Continuous presentation to the olfactory organ of a representative member of a particular class (acidic, basic, or neutral) of amino acid completely adapts the response to itself and simultaneously reduces significantly the responsiveness of ORNs to other members of that class while retaining high responsiveness to amino acids of other classes (Caprio and Byrd, 1984). In the present cross-adaptation paradigm in which the adapting solution contained representatives of three of the four main classes of odorant amino acids (Caprio and Byrd, 1984; Friedrich and Korsching, 1997), PWs were generated by ORNs responsive primarily to only the specific amino acid not represented in the adapting solution. It was therefore unnecessary for PW generation to involve the electrical stimulation of ORNs not directly responsive to the odor.
Sources of PW activity other than that previously discussed above include gaseous second messengers, gap junctions, ephaptic interactions, and electric field effects (Dorries and Kauer, 2000). Most of these suggestions run counter to the preservation of the olfactory code for quality as presently understood for animals from honeybees to mammals; i.e., axons of ORNs expressing the same molecular receptor(s) converge onto a few specific glomeruli (quality coding units) within the olfactory bulb (Ressler et al., 1994; Vassar et al., 1994; Mombaerts et al., 1996). ORNs expressing “like” molecular receptors are broadly distributed across sensory regions of the olfactory organ (Ngai et al., 1993; Baier et al., 1994; Chang and Caprio, 1996; Vogt et al., 1997), and ORNs expressing the same molecular olfactory receptors show a “near neighbor” exclusion across the sensory epithelium (Baier et al., 1994). Thus, electrical activation of neighboring ORNs via gap junctions (Zhang et al., 2000) or ephaptic activation among the ORN axons located within fascicles of the olfactory nerve (Bokil et al., 2001) could possibly activate ORNs expressing different odorant receptors, resulting in a confused quality code at olfactory bulbar and higher neural olfactory centers.
Although there is no reported evidence that individual ORNs in catfish or other vertebrates can oscillate at the frequencies (20–30 Hz) observed in PWs, oscillations of much lower frequencies were reported previously in other vertebrates (Frings and Lindemann, 1988; Reisert and Matthews, 2001). PWs could be partly intrinsic and partly caused by current flow from other activated ORNs within the intact sensory epithelium. Consistent with this suggestion, PWs in toads were eliminated by covering with cellophane all but 2 mm2 of the toad's olfactory mucosa (Takagi and Shibuya, 1961).
Functional significance of peripheral waves
The present results indicate that PWs enhance the magnitude of OB LFPs and synchronization among PWs, OB LFPs, and OB action potentials. These results are consistent with the recent finding of phase locking of odor-evoked action potentials of mitral/tufted neurons and OB LFPs in rabbits (Kashiwadani et al., 1999) indicating the odor-induced synchronous firing of OB neurons. Although dendrodendritic reciprocal synaptic interactions between mitral/tufted cells and granule cells have been assumed to be entirely responsible for the synchronized oscillatory effects (Rall and Shepherd, 1968), the present results are highly suggestive that PWs are also involved.
Synchronized neural activity arriving at a synapse is more effective in triggering postsynaptic action potentials and in facilitating long-term potentiation (LTP) than temporally dispersed inputs because simultaneous EPSPs summate more effectively (Dan et al., 1998;Stevens and Zador, 1998;Singer, 1999; Salinas and Sejnowski, 2001). With intrinsic activity present in the olfactory bulb (Kang and Caprio, 1995a), which is likely attributable to the spontaneous activity of ORNs (Kang and Caprio, 1995b, 1997; Vogler and Schild, 1999), enhancing synchronous activity at specific glomeruli would highlight these glomeruli above an already noisy background. The synchronization of multiple ORNs combined with mitral cells acting as coincidence detectors (König et al., 1996) could generate highly effective postsynaptic voltage changes (Mellon and Wheeler, 1999). Synchronization of input along with the local inhibitory neural circuit within the OB would promote synchronized oscillatory discharges of mitral cells and LTP at the ORN–mitral cell synapses and at higher neural centers (Heinbockel et al., 1998; Diesmann et al., 1999;Kashiwadani et al., 1999; Azouz and Gray, 2000). In this context, it is rather interesting that odorant-induced increases in β band frequency (15–35 Hz) electro-encephalographic activity, often associated with learning and memory, is often observed in the mammalian olfactory bulb, piriform cortex, entorhinal cortex, and dentate gyrus (Chapman et al., 1998; Chabaud et al., 2000). Although oscillation frequency was significantly different in response to three of the odorants tested in the salamander (Dorries and Kauer, 2000), odor quality did not appear to be coded by the frequency of PWs elicited in both channel catfish (Parker et al., 2000) and toad (Takagi and Shibuya, 1961). We hypothesize that PWs are important for quality discrimination not through odorant frequency coding but by strengthening the synaptic transfer of ORN information to specific OB glomeruli that are arranged in a chemotopic organization (Xu et al., 2000; Nikonov and Caprio, 2001).
Footnotes
This work was supported by Grant DC-03792 from The National Institutes of Health, National Institute on Deafness and Other Communication Disorders. This work is dedicated to the memory of Dr. Don Tucker (1924–1979).
Correspondence should be addressed to Dr. John Caprio, Department of Biological Sciences, Life Sciences Building, Room 202, Louisiana State University, Baton Rouge, LA 70803. E-mail:jcap{at}lsu.edu.


