

Abstract
Whereas many laboratory-studied decisions involve a highly trained animal identifying an ambiguous stimulus, many naturalistic decisions do not. Consumption decisions, for instance, involve determining whether to eject or consume an already identified stimulus in the mouth and are decisions that can be made without training. By standard analyses, rodent cortical single-neuron taste responses come to predict such consumption decisions across the 500 ms preceding the consumption or rejection itself; decision-related firing emerges well after stimulus identification. Analyzing single-trial ensemble activity using hidden Markov models, we show these decision-related cortical responses to be part of a reliable sequence of states (each defined by the firing rates within the ensemble) separated by brief state-to-state transitions, the latencies of which vary widely between trials. When we aligned data to the onset of the (late-appearing) state that dominates during the time period in which single-neuron firing is correlated to taste palatability, the apparent ramp in stimulus-aligned choice-related firing was shown to be a much more precipitous coherent jump. This jump in choice-related firing resembled a step function more than it did the output of a standard (ramping) decision-making model, and provided a robust prediction of decision latency in single trials. Together, these results demonstrate that activity related to naturalistic consumption decisions emerges nearly instantaneously in cortical ensembles.
SIGNIFICANCE STATEMENT This paper provides a description of how the brain makes evaluative decisions. The majority of work on the neurobiology of decision making deals with “what is it?” decisions; out of this work has emerged a model whereby neurons accumulate information about the stimulus in the form of slowly increasing firing rates and reach a decision when those firing rates reach a threshold. Here, we study a different kind of more naturalistic decision—a decision to evaluate “what shall I do with it?” after the identity of a taste in the mouth has been identified—and show that this decision is not made through the gradual increasing of stimulus-related firing, but rather that this decision appears to be made in a sudden moment of “insight.”
Introduction
Most neuroscientific studies of decision making involve training animals to recognize some physical property of a stimulus, such that they saccade or poke their nose discriminatively once the identity of a stimulus has been determined. Such studies have revealed important neural correlates of decisions: firing rates in relevant neurons begin to reflect the decision within 200 ms, appearing to “ramp” to a decision threshold with a slope commensurate to task difficulty (Shadlen and Newsome, 2001; Huk and Shadlen, 2005; Kiani et al., 2008; but see Latimer et al., 2015).
Taste-related decisions, in contrast, require no training: when a taste is presented, even via intraoral cannulation, a rat necessarily makes a decision: it rates the palatability of the taste, deciding whether the taste object is worthy of consumption; this psychological property is exquisitely sensitive to a large range of experiential variables (Berridge et al., 1984; Galef, 1986; Spector et al., 1988; Breslin et al., 1993; Fortis-Santiago et al., 2010), and as such can only be made subsequent to identification of stimulus identity. Thus, even easy taste-palatability decisions often have 5–10 times the latency (∼1 s) of similarly easy stimulus-identification decisions (Hanes and Schall, 1996; Ratcliff et al., 2003; Uchida and Mainen, 2003).
Our studies of this paradigm have focused on gustatory cortex (GC) and other forebrain structures situated between basic sensory regions and the motor centers controlling the production of discriminative oral behaviors that signal that a decision has been made. Taste-related firing in GC jibes well with the above description of the decision process, as identity-related firing emerges within 200 ms of stimulus presentation, and 800 ms before the production of decision-specific orofacial behaviors (Katz et al., 2001; Sadacca et al., 2012). Between these two time points, GC firing reorganizes, coming to reflect the palatability decision in a manner that, according to standard analyses, begins ∼500 ms following taste delivery, becomes significant at ∼800 ms, and asymptotes before the emission of choice-specific behavior (Piette et al., 2012; Sadacca et al., 2012); that is, GC decision-related activity emerges in an apparent ramp preceding behavior, much as activity in lateral intraparietal cortex ramps preceding visual motion perception decisions.
In the case of GC taste responses, however, this ramp may be an artifact of across-trial averaging. Ensemble recordings in awake rats have suggested that taste responses are actually better described as sequences of quasi-stable firing-rate “states,” with interstate transitions that occur suddenly, but at highly variable trial-to-trial latencies (Jones et al., 2007; Escola et al., 2011; Moran and Katz, 2014). Because firing-rate ramps appear artifactually in across-trial averages under such circumstances (Miller and Katz, 2010), it becomes reasonable to ask whether GC responses will predict consumption decision making with analogous suddenness, rather than following a substantial ramp, if analyzed in just such a way.
Testing this hypothesis requires analysis of simultaneously recorded ensembles of neurons, because sudden firing rate shifts are notoriously difficult to discern when single neurons are recorded individually (Okamoto et al., 2007). Here we performed precisely this analysis, applying a tool [hidden Markov (HM) modeling (HMM)] that identifies discrete states underlying ensembles of spike trains (Abeles et al., 1995; Jones et al., 2007; Kemere et al., 2008; Bollimunta et al., 2012; Ponce-Alvarez et al., 2012; Moran and Katz, 2014) to GC taste responses. By this analysis, decision-related firing is indeed revealed to emerge in sudden firing-rate transitions, which, while varying widely in latency from trial to trial (Jones et al., 2007), are more similar to transitions predicted by a step-function model than by the dominant ramping model of decision making [the drift diffusion model (DDM); Hanes and Schall, 1996; Thompson et al., 1996; Shadlen and Newsome, 2001; Huk and Shadlen, 2005]. Furthermore, the latency of this state in single trials provides an excellent prediction of the onset of choice-related behavior. Thus, these data suggest that the evidence of a decision to consume or expel a taste stimulus appears in cortex with a suddenness approaching instantaneity.
Materials and Methods
Experimental design
Subjects
Female Long–Evans rats (n = 11, 2 in initial modeling, 9 with electromyography; 280–320 g at time of surgery) served as subjects in this study. Rats were maintained on a 12 h light/dark schedule and were given ad libitum access to food (and restricted access to water where specified). All methods complied with the Brandeis University Institutional Animal Care and Use Committee guidelines.
Surgery
Rats were anesthetized using an intraperitoneal injection of a ketamine/xylazine/acepromazine mixture (100, 5.2, and 1 mg/kg, respectively), with supplemental intraperitoneal injections administered as needed. The anesthetized rat was placed in a standard stereotaxic device, where its scalp was excised, and holes were bored into its skull for the insertion of 0–80 ground screws and electrodes. Multielectrode bundles (16 nichrome microwires attached to a Microdrive; Katz et al., 2001) were inserted 0.5 mm above GC. Once in place, the assemblies were cemented to the skull, along with two intraoral cannulas (IOCs; Katz et al., 2001) using dental acrylic.
Passive taste administration paradigm
Three days following surgery, each animal began 2 d of adaptation to handling. Afterward, each animal was placed on a water-restriction regimen (2 h of water/d) for 2 d, acclimatized to the experimental environment for 2 d, and adapted to 40 μl water deliveries through the IOCs for another 2 d. Once so acclimated, animals were, once per day, exposed to the experimental taste array [distilled water, four concentrations of NaCl (0.01, 0.1, 0.3, 1.0 m), 0.3 m sucrose, and 0.001 m quinine] through a manifold of fine polyimide tubes inserted to 0.5 mm past the end of one IOC (eliminating any chance of mixing) and locked onto the dental acrylic cap. All fluids (including the water rinse, which was delivered to the contralateral IOC) were delivered under slight nitrogen pressure; while delivering each taste from one side may have meant not entirely immediate exposure of all taste buds, the pressure ensured that a brief release of fluid (∼40 ms, the ejection of taste onto the tongue was complete long before any taste-related dynamics appeared in GC responses) resulted in extensive tongue coverage at reliably short latency (Katz et al., 2001), and the use of a single manifold ensured essentially identical presentation of all taste stimuli.
Rats received a minimum of 10 blocks of taste deliveries (six deliveries per block). Computer-controlled solenoid valves ejected a pseudorandomly selected taste directly into the mouth of the rat under nitrogen pressure once every 30 s. An H20 rinse was delivered through the contralateral cannula 15 s after each taste delivery. Total fluid delivered was 4.8 ml per 30 min of recording session, after which animals had ad libitum access to water for 90 min.
Assessing preferences/palatability for the full array of taste stimuli
A set of rats (n = 4) was adapted to handling and placed on a 22 h water restriction protocol, with water provided in the home cage after handling, adaptation, or testing. Testing took place in the Davis MS-160 “brief access” Lickometer rig (DiLog Instruments). During the first 2 d of habituation, rats were placed in the Davis rig and allowed to drink water from a single tube continuously for 30 min. On the last 2 d, rats received periodic brief access (15 s) to one of seven stainless-steel drinking tubes on a moveable carousel, each filled with water, for 35 min.
Finally, each rat received three 35 min testing sessions, on consecutive days, during which taste solutions (0.00, 0.01, 0.10, 0.30, and 1.0 m NaCl, 0.3 m sucrose, and 0.001 m quinine HCl) were presented in a (blocked) randomized order. Presentations began with the automated raising of a shutter, such that the lick spout was exposed. If no lick was recorded within 60 s of spout presentation, the shutter closed, and the tube holder moved on to the next tastant; these empty trials were dropped from the subsequent analysis. Once a lick was noted (via a low-current circuit), the solution was presented for 15 s (this guaranteed that lick counts were not confounded with latency to first lick), after which the shutter came back down, and a 10 s interval separating each presentation began.
The average number of licks across the 15 s of availability, compared to that for water, provided us with a measure of preference and palatability of the tastes (Breslin et al., 1993) without a disproportionate amount of lick-rate adaptation (Smith et al., 1992); solutions preferred compared to water are here characterized as “palatable,” whereas solutions that rats drank less of than water are characterized as “aversive.” There was no decrement in lick rate across the 35 min sessions, suggesting little influence of postingestive effects during taste preference assessment (data not shown).
Electrophysiology
Neural signals were differentially recorded from GC during taste sampling and fed into a parallel processor capable of digitizing up to 32 signals at 40 kHz simultaneously (Plexon). Discriminable action potentials (>3:1 signal-to-noise ratio) were isolated on-line from each signal using an amplitude criterion in cooperation with a template algorithm, and time-stamped records of stimulus onset, spike times, and all sampled spike waveforms were saved to disk, as was a file of discrimination parameters. All signals were then subjected to off-line reanalysis incorporating three-dimensional cluster-cutting techniques, which confirmed or corrected on-line discriminations. A great deal of previous work has confirmed that this set of procedures results in the isolation of single-neuron records (Katz et al., 2001; Fontanini and Katz, 2006).
Analysis and response modeling
We obtained data from seven separate multineuronal recording sessions, as described above. Identified spiking events were partitioned into 10 ms bins (250 bins per 2.5 s of poststimulus activity) for analysis. To maintain equal samples across recording sessions, the first 10 trials of each taste delivery were included in subsequent analysis.
Palatability correlation and taste identification
To determine the relationship between neural activity and behavior through time, we calculated the linear correlation across stimuli between each neuron's trial-averaged activity and the palatability of the tastant as measured in the brief access task. A large number of studies have established the general palatability function for these stimuli—a function that is remarkably reliable across different measures, contexts, and physiological conditions—but we used previously collected data from our lab (Sadacca et al., 2012), which showed, as expected, the following order of palatability, from most pleasing to most aversive: sucrose, 0.1 m NaCl, 0.3 m NaCl, 0.01 m NaCl, 1.0 m NaCl, quinine HCl (the last two of these stimuli were less palatable than distilled H2O). The inverted U for palatability as a function of NaCl concentration demonstrates that palatability is a measure of an animal's response to a stimulus (which takes time to be determined), rather than a straightforward ingredient of the stimulus; that is, palatability is a measure of how much or how often an animal chooses to consume a tastant. Albeit measured in a separate battery of tests, palatability is equivalent to an average of the animal's choices across trials, which we will correlate with an average of each neuron's activity across trials.
Results based on this measure are thus intrinsically conservative. We neither trained our rats to produce stereotyped categorical responses nor selected trials in which those behaviors were easily recognized as correct; our inability to remove so-called “error trials,” if it has any effect at all, serves only to reduce the strength of the correlations between neural activity and choice. The main finding from this work arises from comparisons between, on the one hand, the results of trial averaging when each trial was aligned to stimulus delivery [producing the peristimulus time histogram (PSTH)], and, on the other hand, analogous results observed when each trial was aligned to a state transition [producing the analogous peritransition time histogram (PTTH)]. Regardless of alignment, the neural firing rates for each neuron, for each 250 ms window of activity, were transformed into a neural response vector of length equal to the number of tastes times the number of trials. A palatability vector of equal length was then created, with each value of the palatability vector determined by that taste stimulus' value on Figure 1A. Stepping this window in increments of 10 ms, we produced a time series of correlation coefficients between each neuron's trial-averaged activity and the palatability (Fig. 1C). The palatability or choice index, I(t), reported is simply the mean of the square of the correlation coefficient across neurons, through time, t (Fig. 2).
To assess the availability of any taste-related information in the neural ensemble (compared to the presence of palatability-specific information), we used a standard linear-discriminant analysis classifier to test the reliability with which evoked responses to a taste could be identified among responses to other tastes. Here, we binned neural responses into 20 ms bins and used a linear classifier with a leave-one-out approach, training the classifier on all but one trial of two pairs of evoked population taste responses (e.g., Trials 1–9 of sucrose and quinine for all neurons) and tested with the “left-out” trial (here, Trial 10 of sucrose and quinine). This analysis was then iterated for each time bin using the mean of 10 bins of evoked response per step (200 ms) and for each combination of exemplar tastes (sucrose, quinine, 0.1 m NaCl, and 1.0 m NaCl).
Characterizing the rise of the palatability index
Differences between palatability time series (e.g., PSTH vs PTTH) for population and single-neuron data were quantified by fitting a four-parameter sigmoid function to the following palatability index:
 where α is equal to four times the maximum slope (making α/4 our y-axis measure of slope), β is the “suddenness” of the increase (equal to the inverse of the period during which the slope was >78% of maximum), t0 is the time when maximal slope is reached, and δ is the offset in minimum palatability correlation from zero (a baseline value). Note that the combination in the numerator, (α/β), denotes the overall change in palatability across the transition. To obtain consistent fits for both population and single-neuron, parameters α and β were completely unconstrained, whereas parameter t0 was restricted to 200 ms around the time of transition, and δ was held to a maximum value of 0.05. In addition to this fitting, we performed a secondary measure of transition suddenness: the time taken to transition across 40% of the total jump from minimum to maximum palatability. Values of this secondary measure broadly agreed with the fitted 1/β. To make control data aligned to a different, earlier transition (either an early dominant state or the transition immediately preceding the identified late state) comparable, the mean (early) transition time was subtracted, and the data were shifted by the mean (late) transition time.
Hidden Markov modeling and model selection
We performed HMM, limiting each analysis to simultaneously recorded ensemble data, on the basis of its proven ability to characterize neural activity (Seidemann et al., 1996; Jones et al., 2007; Kemere et al., 2008), and specifically on the basis of our previous demonstration that taste responses are well characterized as sequences of ensemble firing rate states with brief interstate intervals (Jones et al., 2007; Piette et al., 2012). We prepared our data for HMM by first indexing each neuron in the ensemble with a scalar (N = 1, 2, 3, …, M). If only one neuron spiked in a time bin, we assigned the number N to that event, with N = 0 corresponding to no spikes from any neuron. If more than one neuron spiked in a time bin, we randomly selected one of the spiking neurons for assignment to that bin—a highly uncommon occurrence, given the relatively low firing rates, small (10 ms) bins, and small (6–14) ensembles of neurons.
We used standard MATLAB packages for HMM and used 25 different sets of random starting parameter values as seeds for a standard model optimization procedure (the Baum–Welch algorithm; Baum et al., 1970). The model with maximum log likelihood, or LL (calculated as the log probability of producing the measured spike trains given the particular model), was provisionally treated as the optimal characterization of ensemble activity, contingent to the application of a model selection technique [the Akaike information criterion (AIC)], that penalizes the LL value according to the number of parameters in the model (the size of the emission matrix minus one column plus the size of the transition matrix minus one column). While the original LL-based models always produced better fits to the data than the AIC-based models, the penalty term provided by the evaluation of the number of free parameters militated against overfitting the data. Typically, the AIC method selected four or five states as the maximally informative number, numbers that accord well with our previous empirical findings—three states maximum in the first 1.5 s, matching the number of epochs, and then one to two postconsumption states (Jones et al., 2007; Piette et al., 2012). We produced a single hidden Markov model for each ensemble and each tastant. Given this model, we calculated, for each trial, the probability as a function of time of the ensemble being in any particular HM state.
Post-HM realignment
For each hidden Markov model, we determined the putative underlying state with the highest probability of occurring across all trials within a time window identified, on the basis of Figure 1 and previous work (Katz et al., 2001; Grossman et al., 2008; Sadacca et al., 2012), as being the time at which rising ramps of palatability, observed using analyses keyed to stimulus delivery, reach asymptote (between 0.8–2 s after stimulus). These states were deemed the most likely candidate “palatability” states. We next realigned the ensemble data such that the onset times of these states (calculated as the time bin at which the identified state exceeded 0.5 probability on each trial) was set to be the “zero” time point of each trial. The few trials in which the onset of this state occurred before 0.1 s following stimulus onset were excluded from this (and all) analysis, as were paired trials from stimulus-aligned data (to maintain equal trial numbers between PSTH and PTTH data sets). For two control realignments, data were zeroed on an earlier state onset: either the state with the highest probability between 0.25 and 0.8 s after taste delivery (labeled “early”) or the state immediately before the calculated “late” palatability state for each model (labeled “prelate”). Once the data had been realigned, we repeated the above-described palatability analyses that had already been brought to bear on stimulus-aligned data.
Monte Carlo analyses
We conducted Monte Carlo analyses to deal with a complementary pair of issues having to do with the above procedures: (1) the fact that rapid transitions from low-to-high neural correlations with palatability could conceivably be produced as an artifact of HMM itself, which will identify the sharpest transition time even in data for which all identified “transitions” are purely stochastic and noise based, and (2) the fact that the correlation and HMM procedures will artificially smooth even instantaneous transitions to some degree, with the former because of the necessity of data windowing, and the latter because of the imprecision inherent in estimating the times of hidden state changes on the basis of relatively sparse point-process data putatively emitted as a function of underlying state. We therefore generated two sets of 200 control simulations of each trial in the real data to evaluate these two possibilities and two sets of 100 additional simulations to test an alternative theory, the drift diffusion model; all four sets of simulated data resulted from probabilistically chosen spike trains that approximated the interspike interval statistics of the real data, and by design contained essentially the same firing rates (and therefore produced similar PSTHs) observed in the real data.
PSTH- and shuffle-based control data.
The first of these simulations was produced by assuming a neuron's spike times in each trial to emerge purely from the temporally inhomogeneous Poisson processes observed in the across-trial averaged single neuron responses to each taste (i.e., the PSTHs); these data matched the trial-averaged real data, but contained neither between-neuron coherence nor purposefully sudden rate changes. Thus, in these data sets, the PSTHs were truly (and by definition) a valid characterization of each trial and therefore tested the possibility that any sharpening of the onset of palatability-related firing was an artifact of the analysis. The second of these simulations was a trial reshuffling of the original data for each neuron (e.g., pairing Trial 1 of Neuron 1 with Trial 9 of Neuron 2), to again disrupt between-neuron coherence while preserving the PSTH. Specifically, for each real data set, we created 500 permutations of potential trial–neuron pairings for the ensemble and selected the 200 that minimized the number of coherent neurons for each reshuffled trial. We subjected these control data sets to the same analysis as performed with the original data set, statistically comparing the transition speed of control data sets with the original.
Coherent step-function control data.
The third simulation allowed us to assess the degree to which the speed of transitions in the realigned real data differed from the theoretical maximum speed produced by instantaneous, correlated changes in firing rates, given the firing rates observed in our cortical neuron sample. For these 100 data sets, firing rates were obtained from the mean PTTH during five different response periods relative to average stimulus onset: (1) a prestimulus period between −1 s before stimulus and stimulus onset; (2) an early epoch period from t = 0 ms to t = 200 ms; (3) a middle epoch period from t = 300 ms to t = 800 ms; (4) a final period from t = 1200 ms to t = 1400 ms; and (5) a poststimulus period from t = 2000 ms to t = 2800 ms. We assumed coherent, instantaneous jumps in firing rates between these values, with simulated states lasting 1, 0.2, 0.6, 1.2, and 2.0 s on average; however, the onset of the second-to-last transition was jittered, with the jitter pulled from a normal distribution with an SD equal to the SD of the late transition (413 ms). We again subjected this control data set to analyses identical to those brought to bear on the real data and compared the suddenness of the palatability index with those produced by the equivalent analyses of the original data.
Drift diffusion model control data.
The fourth simulation was designed to assess how well a standard model of decision making, the DDM, fits our observed data. The DDM relies upon neural integrators, which can be implemented in numerous ways, some of which require fine-tuning (Wang, 2002; Wong and Wang, 2006) and others of which produce instantaneous jumps (that are not coherent across the circuit) in neural firing rates (Koulakov et al., 2002).
The DDM is identical to the step-function control in that it incorporates the mean firing rates, trial-to-trial variability, and firing-rate correlations across all cells, but differs in that the rates in each trial can ramp in the manner of a biased random walk. For the DDM to match our data, it was essential that we included a delay of 500 ms before any ramping of the decision process could commence. Such an initial delay is much longer than that used in standard decision-making models (Ratcliff et al., 2003), and its inclusion already shifts the DDM toward a model more akin to the step-function control.
The DDM itself was defined by two parameters, mean time to threshold (T = 0.6 s) and fraction of correct trials (pcorrect = 0.975), which together constrain the stimulus strength, S, and the noise level, σ2, of the decision variable for a given choice threshold (whose arbitrary value, a = 1, simply scales the decision variable, so scales the mapping to firing rates; Bogacz et al., 2006):

 The model was mapped into the firing rates of cells by assuming each cell's firing rate was a sigmoidal function of the decision variable (the sigmoid was essential so that rates remained positive) with the sigmoid set independently for each cell to produce the cell's pre-palatability-response firing rate when the decision variable is zero and to produce the cell's post-palatability-response firing rate when the decision variable is at the “correct” threshold, +a. To completely define the parameters of the sigmoid for each cell, we further assumed the cell's firing rate to be bounded between 0 and 110% of the greater of pre- and post-palatability-response rates.
Thus, in any trial, all cells' firing rates would coherently follow the single decision variable for that trial according to the biased random walk, but the single decision variable was mapped into a sigmoidal firing rate unique to each cell so as to best match that cell's observed rate changes. While the sigmoid functions were typically broad, they do add nonlinearity, and so make the DDM more step-function-like than if we assumed firing rates were a linear function of the decision variable. Such a nonlinear mapping was essential to produce the observed firing rates in the stimulus-aligned data. This fact, combined with our incorporation of a large (500 ms) delay before ramping commenced (to match the timing of the onset in ramping without disrupting other transitions) means that our test of whether the data were more step-like or more like a ramping DDM required us to first add two step-like features to the ramping DDM (the delay and the nonlinearity). Such modifications were essential to provide a framework in which the DDM was at all capable of fitting the observed data, but potentially they cause us to underestimate the difference between DDM-derived and “instantaneously transitioning” simulations.
Control data comparison.
The above pair of analyses is particularly felicitous because it simplifies the difficult task of assessing statistical significance of the phenomena reported here. In each case, the proportion of dummy data sets was a direct indicator of that significance—if, for instance, the slope of the real data was higher than that of >190 of 200 simulations (each of which is identical in size to the real data), then in a one-tailed test (which we use here because our hypotheses are explicitly directional), the p value for the difference between the conditions is <0.05.
Finally, to directly compare how well the control data sets fit the real data, we determined the likelihood that either of the control data sets was a distribution centered on the real data (z test) and then computed the likelihood ratio (Λ) between the optimal and PSTH-derived simulations, where Λ = 2 * ln(pOPTI) − 2 * ln(pDDM), with significance of the likelihood ratio assumed to follow a χ2 distribution.
Comparison of electromyographic and neural population data
We identified palatability-related oral behaviors (taste reactivity; Grill and Norgren, 1978; Travers and Norgren, 1986) in jaw-movement electromyographic (EMG) signals. These behaviors are commonly understood to represent the execution of a consumption decision via the action of a single central pattern generator in the brainstem: gapes (focused on here because they are the largest, easiest to isolate motor acts) represent the movement of fluid toward the front of the tongue for ejection, whereas lateral tongue protrusions represent the gathering of fluid in the back of the mouth for eventual swallowing (this is true regardless of whether delivery is via IOCs or licking, although the processes are nonidentical, and decisions are almost certainly made faster in a self-administration context; Samuelsen et al., 2012). While swallowing technically represents the end of the decision process, it provides a poor measure of when that decision is actually made (particularly for egestion/rejection decisions) for the simple reason that fluid must be gathered in the back or front of the mouth before swallowing or expelling.
Voltage neuromuscular signals from a bipolar electrode embedded in the anterior digastric were recorded during sampling of IOC-delivered tastes. These signals were passed through a differential amplifier (P55; Grass Technologies), sampled at 1000 kHz, filtered off-line using a two-pole Butterworth bandpass filter (300 to 500 Hz; Travers and Norgren, 1986), and rectified.
The EMG signatures of gapes were extracted from this signal using a two-step process: (1) We first identified all mouth movements produced in the first 2.5 s following taste delivery, extracting the envelope of the filtered, rectified EMG signal using a 15 Hz low-pass filter; local peaks in the envelope were identified as mouth movements. The onset and offset of each movement were defined as the time points at which the magnitude of the envelope fell below the mean value of the envelope from the baseline period (from −1.5 to 0 s relative to taste delivery). (2) We then trained a quadratic classifier to identify each movement as either a gape or nongape; movement duration (Δt between movement onset and offset) and movement frequency (the reciprocal of the longest Δt between the peak of a given movement and the peak of each adjacent movement) differentiated gapes from other mouth movements, as described by Travers and Norgren (1986). These parameters were plugged into the quadratic expression, and if the resulting value was less than zero, the movement was labeled as a gape. The parameters of this automated sorting method were validated by comparison to blind coding of simultaneously acquired video (a corpus of 1169 movements, 437 of which were determined on the video to be gapes) and found to be highly reliable. Once the gapes were identified, the time of the first gape in a bout was deemed to represent the onset of gaping and the latency to the decision, as reflected in behavior emission.
This single-trial measure of decision latency could then be directly compared to the same-trial latency to the onset of the palatability-related state, determined in an entirely independent analysis. This state was identified as described above (although the hidden Markov model was in this case calculated using 1 ms bins to maximize the temporal precision with which transitions could be identified), and the latency of that state was calculated to be the time at which it became the most likely state.
There were two sessions (of 10 in which more than neurons were simultaneously recorded) for which an interpretable hidden Markov model solution (one with clean sequences of states) could not be reached; these sessions were disregarded for purposes of this analysis. Even in the other sessions, there was a small subset of trials in which the palatability-related state became dominant twice; for this reason, we restricted our analysis such that each trial contributed only one ensemble state latency, by disregarding very early (<250 ms) and very late (>2000 ms) state onsets. There were also rare trials in which the most likely palatability-related state simply did not appear; these trials were disregarded, since they did not supply a transition time point.
The results of this brain/behavior comparison were evaluated in multiple ways. First, a simple Pearson correlation between transition and decision latencies allowed us to determine whether there was a statistically significant linear relationship between those latencies; the sign of the lag revealed whether neural transitions preceded decisions or vice versa. We also directly compared the two distributions of decision latency, one in relation to stimulus presentation and one in relation to the neural state transition, using a Χ2 test. Since multirat distributions were neither normal nor similar in shape, we analyzed medians and interquartile ranges (the range of the middle 50% of scores) to ascertain whether neural state transitions predict decisions better than trial averaging: improvements in predictability should be reflected in larger concentrations of scores around a single value, a more sharply peaked distribution of latency.
Results
Consumption-choice-related cortical activity appears only after stimulus-discriminative activity, emerging across 500 ms in single-neuron analyses aligned to stimulus delivery
We initially recorded the responses of seven primary cortical ensembles (10 ± 2 single neurons per ensemble) to deliveries of taste stimuli that varied widely in the readiness with which they are consumed (a directly choice-related property known as “palatability,” Fig. 1A). In our (and prior) tests, sucrose and 0.1 m NaCl are consumed avidly (they evoke prolonged licking), whereas quinine and 1.0 m NaCl are more likely to be avoided (they elicit little licking). Low NaCl concentrations were moderately pleasing and largely similar to water (data not shown). The decision to consume more or less avidly (Fig. 1A) dovetails reliably with other indicators of this naturalistic choice; sucrose on the tongue, for instance, causes swallowing-related reflex behaviors, whereas quinine on the tongue causes rejection-related behaviors (Grill and Norgren, 1978). Figure 1B presents taste PSTHs (that is, single-neuron responses aligned to stimulus delivery and averaged across trials) for two cortical neurons. These responses were in good accord with previous reports (Katz et al., 2001; Piette et al., 2012; Sadacca et al., 2012): following initial periods of nonspecific firing, firing rates became (at ∼150–200 ms after delivery) distinct for different tastes; consistent with previous studies, these (and many other) neurons responded to multiple tastes (Yamamoto et al., 1984; Yaxley et al., 1990; Smith-Swintosky et al., 1991; Katz et al., 2001; Stapleton et al., 2006; but see Chen et al., 2011) in a manner that has been shown to reflect physical properties (their distinct chemical identities, concentrations, and degrees of mixture) of the stimuli (Katz et al., 2001; Yoshida and Katz, 2011; Sadacca et al., 2012; Maier and Katz, 2013).

Late-onset cortical activity reflects behavioral responses to the stimuli. A, The amount that rats choose to consume (in terms of mean number of licks assessed in a brief access task; Breslin et al., 1993) of each stimulus varies as a function of both the chemical identity and concentration of that stimulus. This schematic distribution serves as the basis for assessing the correlation with behavioral (consumption-related) choice. B, The trial-averaged, stimulus-aligned responses of three cortical neurons. Typical of such responses, initial activity was not stimulus specific, selectivity emerging only after ∼200 ms (Katz et al., 2001; Piette et al., 2012; Sadacca et al., 2012). Still later, for each neuron, the response became obviously choice related, with the strongest responses for this neuron to the most aversive stimuli and the weakest to the most palatable stimuli. C, The apparent emergence of choice-related responses in B is confirmed using a moving-window analysis of the linear correlation between the numbers of spikes in B and the behavior pattern in A.
Well after these representative responses became stimulus specific, they could be observed to shift again (500–1100 ms following stimulus delivery), at which point they came to reflect stimulus palatability, as measured by the behavioral function in Figure 1A. (In the case of the first neuron shown in Figure 1B, the most vigorous response in this later period was to aversive stimuli; the opposite pattern was observed in the second neuron shown in Figure 1B.) To quantify this finding among the recorded population, we calculated moving-window correlations between the palatability of each stimulus and spike-rate responses to these same stimuli (Sadacca et al., 2012). Figure 1C shows that for both sets of responses displayed in Figure 1B, the correlation between palatability and firing rate was stably low and flat until ∼0.5 s following stimulus delivery, occurring well after the neurons had begun to fire distinctively to different tastes, at which time it appeared to ramp linearly upward and to peak at or after 1.0 s.
This result was representative of the full data set (Fig. 2), despite the inclusion of unresponsive neurons in the analysis (which necessarily lowered the net magnitude of the palatability effect; Fig. 2, black line). Palatability-related firing ramped upward between ∼0.5 and 1.1 s after stimulus delivery, achieving significance at 0.83 s (p < 0.05, Tukey–Kramer test), just before the average behavioral latency (Travers and Norgren, 1986): at peak, palatability accounted for 86% of the GC response variability; the firing rates of 41% of the recorded single neurons (N = 28) were significantly linearly correlated with palatability during this response epoch (for 67% of these correlations with palatability, the correlation was negative; for more details, see Sadacca et al., 2012).

Taste identification precedes taste evaluation. The ramp of choice-related activity evident in single neurons (Fig. 1C) is consistent across the entire neural sample (black line; ±2 SEM; n = 68), though lower than for individual exemplars because of the inclusion of nonresponsive neurons in the analysis. This palatability-related firing ramped upward, achieving significance above baseline at 0.83 s after stimulus (p < 0.05, Tukey–Kramer test). The onset of evaluative coding occurred only long after tastes could be identified by ensemble activity, as individual taste pairs (gray dashed lines) were reliably discriminated above chance by 0.4 s following taste delivery, and 100% classification was achieved across all taste pairs (solid gray line) by 0.6 s after stimulus. The duration of each curve, as determined by the time period spanning between 30 and 70% of the total ramp height, for taste identification and palatability coding are displayed (horizontal lines) above the individual curves.
Furthermore, palatability/consumption-related firing appears well after activity that is stimulus specific (Fig. 2, black vs gray traces). The emergence of palatability lags behind the emergence of pairwise discriminability by several hundred milliseconds, regardless of whether examination is keyed to the 30 or 70% points in the curves (30 or 70% of the total increase in palatability or discriminability; Fig. 2, horizontal lines), when the curves achieve significance, or the points of maximum slope. In fact, the discriminability curve reaches asymptote (at 100% correct, according to a standard classification analysis) >500 ms before the average time of choice behavior (whereas the palatability curve arrives at asymptote very close to the average time of behavior emission; see later section, The sudden onset of palatability-related firing robustly predicts the latency of choice-related behavior in single trials).
Single-trial emergence of consumption-related activity is more abrupt than that visible in PSTHs according to ensemble analysis
When we used HMM to reanalyze these neural data in terms of the responses of simultaneously recorded ensembles of neurons, the >500 ms ramp of choice-related activity apparent in Figures 1 and 2 was revealed to poorly reflect single-trial responses. The activity of cortical ensembles was instead well characterized as reliable sequences of states in which each state was defined as a particular set of firing rates across the ensemble (Fig. 3A). Examples of this sequence are shown for one ensemble and one taste in Figure 3B (solid lines in Fig. 3B are state probabilities, which typically transitioned from low to high with great suddenness).

Ensemble cortical responses form reliable sequences of states with coherent, trial-specific state-to-state transition times. A, Each neuron's spiking probability (per 10 ms) is plotted for each of five states (color coded to B) that occurred in the hidden Markov model solution derived for sucrose. B, HMM-determined probability that a set of simultaneously recorded cortical neurons achieves each firing-rate state (colored curves), plotted together with ensemble spiking activity (each vertical notch represents a spike), for four consecutive trials of one stimulus (sucrose). The same sequence was identified in most trials (here, the first 3 of 4 trials), but the times of state-to-state transitions varied from trial to trial [periods of high state likelihood (>80%) are highlighted in color]. C, The time courses of the HMM-derived late state (i.e., the state dominant after 1 s) probability for all sucrose trials in one session, revealing both the reliability and suddenness of this state's emergence (it progresses from 0 probability to 1.0 probability across a <100 ms period in almost every trial) and the considerable variability in the state's onset latency from trial to trial. The solid black line shows the time-average probability across trials, which forms a gradual ramp with a time course reminiscent of Figure 2. D, The distribution of identified late state onsets across all modeled ensembles (42 models total).
The same sequence of states was observed in an average of 73% of the trials of any one stimulus (Fig. 3B, examples 1–3), and in 88% of the trials, the sequence was identical for at least three of the first four state transitions. In addition, there was typically one particular state that characterized most single-trial responses in the >1 s period (this single state was dominant in 78% of trials), the time at which palatability-related firing reached asymptote (Fig. 2). Whereas the order of states was reliable, the timing of state-to-state transition latencies varied widely from trial to trial, such that the state that dominated the 1–2 s period appeared at different latencies on different trials (late-state onset for all trials of the model of Fig. 3B is shown in C). When calculated for all trials of taste delivery across all ensembles, the median latency of state appearance was 0.8 s (±20 ms, SEM; Fig. 3D), a good match for the time point at which the correlation with behavioral choice became significant in across-trial and across-neuron averages (Figs. 1, 2). We therefore refer to the state dominant after this transition (i.e., the state that is most probable for the period between 0.8 and 2.0 s in each model) as the putative “choice-related state.” The state that dominates responses before this time point appeared, on average, 0.1 s after stimulus presentation, too early to be reasonably associated with choice behavior (see later section, The sudden onset of palatability-related firing robustly predicts the latency of choice-related behavior in single trials).
The trial-averaged probability of this late state (Fig. 3C, solid line) rose slowly and linearly across the period between 0.5 and 1.0 s, mirroring the emergence of choice-related firing in Figures 1 and 2, despite the fact that in single trials the state appeared suddenly. It is therefore reasonable to ask whether the slow emergence of choice-related firing itself poorly reflects single-trial ensemble activity. We tested this possibility by realigning trials to the onset of the transition into the late, choice-related state, hypothesizing that this relatively subtle realignment of the data would sharpen the transition into choice-related firing observed in PSTHs, significantly steepening the slope of the brain/behavior correlation. We calculated moving-window correlations between neural firing rates and palatability for each neuron in the realigned ensemble (just as had been done for data aligned to stimulus delivery; Fig. 2) and integrated these correlations across ensembles as a population measure of the choice relatedness of neural activity.
After realignment, the correlation with choice did emerge more suddenly than the same data aligned to stimulus onset (Fig. 4A). We quantified this finding by fitting sigmoidal curves to both stimulus-aligned and transition-aligned data and found that the maximum transition duration (defined as 1/β, a parameter that provides an unbiased estimate of the speed of transition) of the transition from low to high correlation was significantly shorter for transition-aligned data than stimulus-aligned data (ZPSTH = 10.6, pPSTH > 0.001; Fig. 4B). The increase in suddenness of the transition was more than threefold (Fig. 4B, compare black, red bars); most of the apparent slow accumulation of palatability-related activity observed in Figure 2 vanished without across-trial averaging.

Realignment of cortical ensemble data to the appropriate HM state onsets sharpens the emergence of choice-related firing. A, The emergence of choice-related firing in ensemble activity is sharper following realignment of each trial's spiking activity to the onset of the state identified as dominant at 1 s after stimulus delivery (PTTH; red dashed line) than when that activity is aligned to stimulus delivery (PSTH; black dashed line). Sigmoidal fits to each time series are overlain (solid lines) and provide estimates for the speed with which activity transitions to choice relatedness. B, The values and 95% confidence intervals for the duration of the transition from low levels of choice-related firing to asymptotic choice-related firing (the time across which the slope of the fit sigmoid curve is highest, parameter 1/β) for PSTH and PTTH data, in addition to two control realignments: data realigned to either the state prior to the identified late state (prelate aligned) or the state dominant during taste identification (early aligned). In all cases, real data transitioned more quickly than the PSTH data (ZPSTH = 10.6, pPSTH > 0.001) or either of the control alignments (ZEARLY = 6.4, pEARLY > 0.001, ZPRELATE = 3.5, pPRELATE > 0.001).
We performed the same realignment using two estimations of an earlier state transition, the state dominant just before the identified late state (termed “prelate”) and the state dominant during the period of identity coding (termed “early”), and repeated the analysis; data aligned to the late state transitioned more quickly than both controls (ZEARLY = 6.4, pEARLY > 0.001, ZPRELATE = 3.5, pPRELATE > 0.001; Fig. 4B), neither of which sharpened the transition significantly (i.e., compared to nonrealigned).
Of course, just as across-trial averaging may smooth data into gradual ramps, so may HMM identify spuriously sharp jumps in noisy data that in reality contain no coherent transitions. To evaluate the impact that this possible confound might have had on our conclusions, we produced and analyzed two control data sets: the first of these was a neuron-by-neuron reshuffling of the real data trials (which thus preserved any irregularities in spiking that might have contributed to the performance of the hidden Markov model, but disrupted trial-to-trial coherence among neuron pairs; Jones et al., 2007; Fig. 5A, red traces); the second was a direct simulation of the cortical data set derived from the neurons' empirically observed PSTHs (with randomly chosen spike times); two such simulated neurons are shown in Figure 5A (gray traces). For each of these simulations, single-neuron spike rates closely resembled those observed in the experimental data, lacking (by design) only trial-specific dynamics.
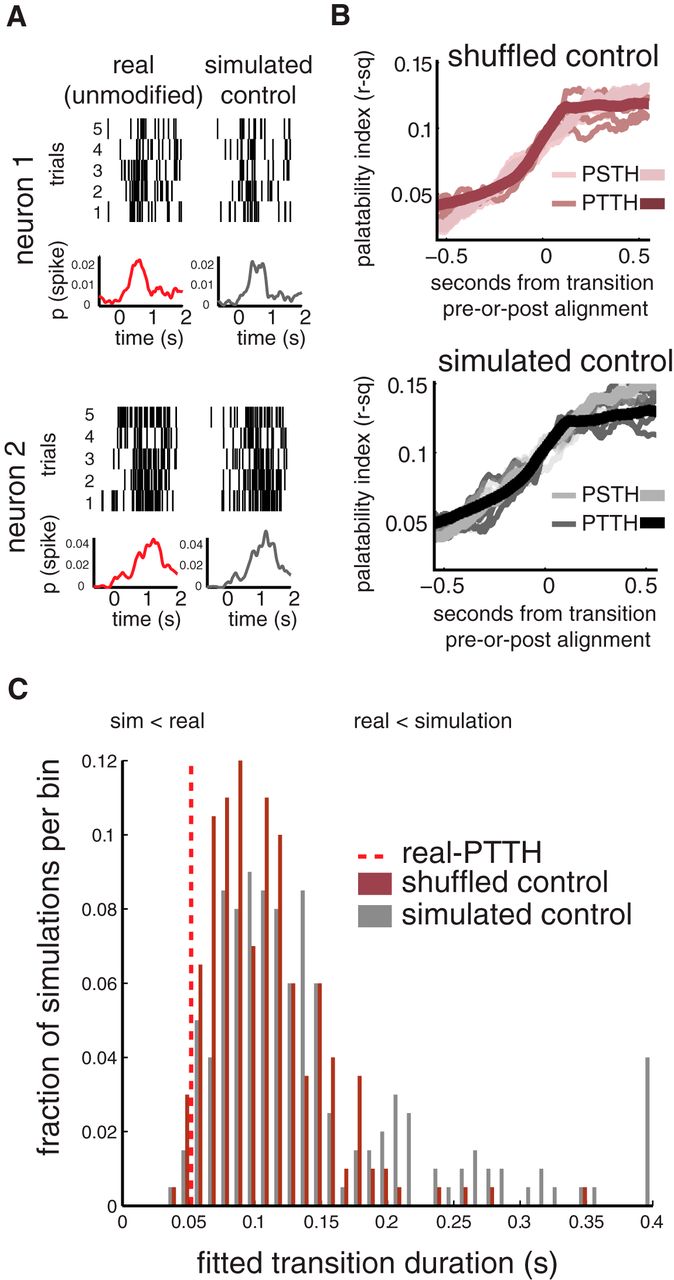
The sharpening of choice-related firing by alignment to HM states is significantly greater than expected by chance. A, Single-trial raster plots (top) and peristimulus spiking probabilities (bottom) for two example cortical single-neuron taste responses (in this case, to quinine; red trace) compared with a simulation of spiking generated from the mean response of that neuron (gray trace). B, To estimate whether the sharpening shown in Figure 4 was merely an effect of HMM realignment, regardless of genuine rapid transitions in the neural data, trials from the experimental data were reshuffled (PSTH shuffled; lighter traces) and were modeled using HMM (PTTH shuffled; darker maroon traces). Realignment produced a modest sharpening in this control data. For a second control data set (as plotted in A), spike trains were simulated from the PSTHs of real neurons, maintaining the average activity of the ensemble, minus moment-to-moment correlations among neurons (PSTH simulation; light gray traces). These simulated data were also modeled using HMM (PTTH simulation; dark gray traces). Again, realignment caused a modest sharpening of choice-related activity. C, The results of sharpening 100 simulated data sets and 100 shuffled data sets are compared to the effect of sharpening the experimental data. Only 4 of the 200 simulations and 7 of the 200 shuffled data sets transitioned into choice-related firing as suddenly as the real data, confirming that the effect shown in A and B was not merely an effect of HMM-cued realignment (psimulated < 0.05; pshuffled < 0.05; one-tailed binomial test).
We produced 200 versions of each control data set and subjected them to the same analyses brought to bear on the real data (i.e., those related to Fig. 4). The results of these analyses are shown in Figure 5, B and C: for both the shuffled (Fig. 5B, top) and simulated (bottom) data, the emergence of significant correlations with palatability was only slightly increased by realignment to hidden Markov model late-state onset. When fit with sigmoid functions using the same procedure brought to bear on the data in Figure 4A, the onset of palatability-related firing in data aligned to state transition is sharper for the real cortical ensembles than for either the PSTH-based simulation or trial-shuffled controls, an appearance confirmed by statistical analysis of the transition duration of control simulations to that of the real data (Fig. 5C; psimulation < 0.05, pshuffled < 0.05, one-tailed test; 7 of 200 and 4 of 200 data sets, respectively); control data sets almost never transitioned as suddenly as the real transition-aligned data.
As a secondary check on the reasonableness of our fitting of suddenness, we also calculated the time required to pass from 30 to 70% of the total change in palatability. This analysis yielded quantitatively similar results (pshuffled < 0.05, psimulated < 0.05, one-tailed test; 0 of 200 and 1 of 200 data sets, respectively), further supporting our hypothesis that cortical neural ensembles transition suddenly into a coherent “palatability-rich” state. The true speed of this transition is obscured (i.e., slowed by a factor of 2.5) by (1) across-trial averaging of the data and (2) the concomitant treatment of single neurons as independent units of analysis.
The onset of palatability-related cortical firing coding is more like a step function than a ramp of firing rates.
The above results suggest that PSTH-based analyses mischaracterize the time scale of the dynamics of ingestive decisions, and that the entirety of the transition into choice-related firing is contained within, at most, a 150–200 ms period, a short enough time scale to suggest that it does not represent an integrative ramp (Miller and Katz, 2010; Shadlen and Newsome, 2001). It is also possible, however, that the brief period of transition reflects a genuine, albeit swift, ramping of firing rates, such as has been suggested to occur when an animal is making very easy perceptual decisions (Hanes and Schall, 1996; Ratcliff et al., 2003; Uchida and Mainen, 2003), and that might be expected during similar “identification judgments” of tastes (Weiss and Di Lorenzo, 2012; Perez et al., 2013). In what follows, we contrast these possibilities.
Although consumption decisions made in this context surely qualify as “easy,” there are several aspects of the data already described that differ radically from that observed during the typical observed ramps underlying other so-called “easy decisions.” They are far too long in latency, for instance, inappropriately variable in onset latency, and preceded by far too lengthy epochs of taste-specific but decision-independent neural activity (see Discussion). It is therefore reasonable to hypothesize that the underpinnings of consumption decisions observed in GC may be more “step-like” than “ramp-like.” To more rigorously test this hypothesis, however, it is necessary to simulate data using stepping and ramping models, and then to directly, statistically compare the distribution of differences between the responses of real cortical ensembles and each simulation.
We therefore produced 100 sets of simulated ensemble data reflecting the output of the standard ramping model used to describe perceptual decision making (the DDM model; Fig. 6A,B, green traces), in which the transition into palatability-related spiking was determined relative to a decision variable that performed a biased random walk toward a threshold. We took care to choose parameters that matched the ramping of palatability and changes in firing rate in the real data, such that our analysis was, if anything, biased to maximize the performance of the DDM (for details, see Materials and Methods). In parallel, we produced another 100 sets of simulated ensemble data in which the determinant of that transition was an instantaneous step function, the time of which was chosen to be identical to those observed in the real data (the optimally steep, or OPTI, model; Fig. 6A,B, blue traces). We then ran precisely the same analyses on both of these sets of model-based simulations that had already been performed on the real data and asked whether the increase in the suddenness with which palatability-related activity emerged in our real data better reflected a ramp or a step function.

The emergence of choice-related firing in cortical ensembles resembles instantaneous state transitions. A, Single-trial raster plots (top) and peristimulus spiking probabilities (bottom) for two example cortical single-neuron taste responses (to quinine). Shown are the corresponding simulated neural spike trains and mean responses generated from a ramping DDM (green traces) and from an instantaneous rate-state transition model (OPTI; blue traces) for these two neurons. B, The simulated data were modeled in the same manner as the real ensembles and PSTH-derived simulations (Fig. 3), and choice related activity was calculated before and after HMM state alignment. Emergence of choice-related firing in both DDM- and OPTI-derived simulations (light shading, stimulus aligned; dark shading, state aligned) substantially benefited from realignment. C, When directly compared to the suddenness of choice-related activity onset in real cortical ensembles, the instantaneously transitioning OPTI data (blue bars) both transition significantly more rapidly than this DDM (green bars) simulation (p < 0.01, Kolmogorov–Smirnov test) and are a better match to the real data (ΛOPTI-DDM = 41.8, p < 0.001).
The results of these analyses are clear from examination of Figure 6, B and C. First, HMM and subsequent realignment increased the suddenness of palatability-related firing for data synthesized from each model, as expected (Fig. 6B, green traces). Second, and again as expected, the estimation and binning procedures that are an intrinsic part of HMM and correlation analysis necessarily introduced an apparent brief ramp of correlation even in OPTI simulations (Fig. 6B, blue traces), despite the fact that firing rates actually changed instantaneously. Third, transitions into palatability-related firing for realigned OPTI simulations were, on average, no steeper than those of real cortical ensembles; the distribution of differences between the real data and OPTI simulations was centered on zero (Fig. 6C, blue bars), whereas the distribution of differences between the real date and DDM simulations was shifted to the right on the x-axis of Figure 6C (reflecting the fact that most DDM simulations transitioned less suddenly). We again calculated the time required to pass from 30 to 70% of the total change in palatability as a validity check of this suddenness result, and again found quantitatively similar results.
Our hypothesis is that the two models should differ in their fit to the real data; therefore, we performed several tests directly comparing the distributions in Figure 6C. First, we calculated the likelihood ratio (Λ) of the probabilities of either simulation having a median transition duration equivalent to that of the real data (two-tailed Wilcoxon sign-rank test). The difference between these likelihoods was significant (ΛOPTI-DDM = 41.8, p < 0.001). Similarly, the two distributions of differences between the model data and the cortical ensembles were statistically different according to a two-sample Kolmogorov–Smirnov test (D = 0.33, p > 0.001). Despite the impossibility of instantaneous change in a real system (dynamical or otherwise; see Discussion), the step function model produces data more like our experimental data than does the integrator model; that is, data collected as rats prepared to consume or expel fluid appear closer to an instantaneous step function than a ramp.
The sudden onset of palatability-related firing robustly predicts the latency of choice-related behavior in single trials.
The above data and analyses suggest that coherent neural ensemble activity in GC related to the making of naturalistic consumption decisions appears suddenly in single trials, with different latencies on different trials, not as an integrative ramp. Lacking from the above analysis, however, are the actual decisions that were made in the individual trials themselves, as the palatability measurement used so far is an average of decisions made across trials, compiled from a session separate from neural recordings, and thus offers no information about the actual timing of an actual real-time choice. To further test our hypothesis that decision making in GC is well described as occurring in a sudden transition (a “moment of insight”) with trial-specific timing, we asked whether the latency of that transition predicts the making of the decision itself in that trial.
To answer this question, we collected an additional data set (11 sessions from nine rats) in which we simultaneously recorded the neural activity of GC ensembles and EMG activity of a jaw-movement muscle (the anterior digastric). This muscle is activated to produce consumption/rejection behaviors, and thus allows us to directly correlate the occurrence of the transition into palatability-related firing and the occurrence of the behavioral decision itself. For this report, we focus on the choice to reject (because it is easiest to reliably identify the occurrence of rhythmic rejection behavior, termed gapes; Travers and Norgren, 1986).
If the hypothesis that neural state transitions into choice-related activity drive consumption decisions is to be supported, then the large trial-to-trial variability of these neural ensemble transitions should reliably predict the (similarly large) trial-to-trial variability of choice behavior latency. Figure 7A shows four consecutive quinine trials (i.e., separated only by trials of different tastes) from one session. The left edge represents the time at which the stimulus was presented, the dashed red line represents the likelihood of the palatability-related state described above, and the short vertical hash marks show individual gapes within a rhythmic bout.

The onset of the palatability-related state predicts consumption decisions. A, Four consecutive quinine trials (time after stimulus delivery on the x-axis), showing the HMM solution (state probability on the y-axis). The state represented by a dashed red line is the palatability-related state. Overlain on this presentation are the times at which the rat gaped (vertical hash marks). The time of the first gape is the behavioral readout of the decision to reject the quinine stimulus. B, For every trial in the session from which the panels in A were culled, the latencies of the palatability-related state (x-axis) are plotted against the latencies of gaping onset (y-axis). The thick diagonal dashed line is unity: above this line, the ensemble transition preceded the making of the decision; below, the opposite is true. In the vast majority of trials, the ensemble transition preceded the behavioral choice with a latency of <500 ms (thinner diagonal dashed line). C, Across eight sessions (see Materials and Methods), the middle 50% of times to first gape were closer to the median (p < 0.03) when timing was aligned to the HM transition (red) than when timing was aligned to the stimulus onset (dark gray) or to trial-shuffled transitions (light gray). The panel shows times normalized to entire distribution width. The inset shows the absolute time.
Note that the onset time of the choice-related state appears well linked to the time at which the decision is expressed in behavior (i.e., the appearance of the first gape), with earlier transitions to the palatability-related state occurring in the same trials that showed faster reaction times. For these four trials, the latency to decision could be as little as 0.5 s after stimulus presentation, or as long as 1.2 s (a 0.7 s spread); the transition into the putative choice-related state tracked this variability and predicted the behavior. Figure 7B summarizes all data for the session from which these trials were culled, plotting the latency of neural state transition (x-axis) and latency of behavior (y-axis) for all 30 quinine presentations. The heavy diagonal dashed line bisecting the graph shows where trials would fall if those latencies were simultaneous. The decision was in most cases (88% of the trials) expressed only after the neural state transition occurred; in 79% (n = 22) of those trials, the decision was expressed in behavior in a narrow band of time following the state transition (note the off-unity diagonal line). This means that, for this session, knowing the time of the transition made it possible to predict the time of response onset in individual trials, despite the fact that on some trials the decision was made in <500 ms and in other trials in >1500 ms; 59% of the trial-to-trial variability in decision time could be accounted for simply by predicting that behavior would occur 293 ms after the transition was detected.
This session, while of particularly high quality, represented the entire data set (eight sessions, after one session was removed for only having two single neurons, and after two were removed because HMM failed to converge on interpretable solutions) well. Across all trials in which the operative state change occurred between 250 and 1600 ms of taste presentation, the brain–behavior correlation was 0.58 (p < 0.001), with a mean lag from ensemble transition to decision of 298 ms. Moreover, the latency-from-transition data were more sharply peaked than the stimulus-aligned data (X2 = 108.8, p < 0.0001), reflecting the fact that decision-related behavior is better predicted from ensemble transition than from stimulus presentation time (i.e., the average latency poorly characterizes taste decision making).
Although these analyses are compelling, the distributions of decision latencies, transition latencies, and transition-to-decision latencies combined across rats were neither normal nor similar, and thus means and correlations might not provide an ideal characterization of the data. We therefore directly compared the distributions, quantifying the variability of predictions in terms of the medians and interquartile ranges (Fig. 7C; the main panel shows the data normalized for the fact that the lag distribution necessarily has a larger range than the distribution of latencies related to stimulus presentation, and the inset shows the raw data). This analysis specifically revealed that behavior was much better predicted by state transitions than stimulus onset: 50% of the distribution (i.e., the interquartile range) of the lag between state transition times and behavioral latency was contained in an interval around the median that was less than half the size of the interquartile range of the same distribution calculated using shuffled transition times (p < 0.03).
Finally, additional investigation confirmed the significant relationship between the onset of decision-related behavior and the attainment of the specific cortical state under investigation. In over 80% of individual trials across the entire 11-session data set (without any dropping of sessions), decisions were made (i.e., the first gape was produced) following the transition into a single state—a result that retained significance (p < 10−10, binomial test, N = 153) when differences in state dwell times were controlled for. Furthermore, while gapes occurred in bouts that could last a full second, across the entire data set some 75% of these gapes occurred in the same state (p < 10−16, binomial test, N = 570).
Together, these results suggest that our single-trial ensemble coding measure of transitions into palatability-related firing does indeed reflect the making of consumption decisions, and so the suddenness of such changes in neural activity is likely a reasonable measure of the suddenness with which such choices are made.
Discussion
In naturalistic situations, animals make many simple decisions in seeming moments of “insight” (Sternberg and Davidson, 1995; Kounios et al., 2006, 2008) that lag far behind stimulus identification; such slow decision processes tend to be less about what the stimulus is than they are about how the animal currently plans to respond about the stimulus; such responses are easily modified by context and experience, and often follow external stimulus presentation only with highly variable latencies. It is entirely possible that the latency of these decisions represent the time point at which a ramping neural function reaches some threshold, but, at least with regard to the consumption decisions studied here, they are reflected by coherent changes in the firing rates of ensembles of sensory cortical neurons that occur suddenly and at different latencies in different trials.
These cortical transitions are not well described as “fast ramps.” They occur far later (three times the average latency, in fact) than similarly “easy” perceptual decisions described in the primate literature (Heekeren et al., 2004; de Lafuente and Romo, 2006; Philiastides and Sajda, 2006). Long before these transitions into (linearly) decision-predictive firing occur, neural responses already indicate the identity of the stimulus; that is, the accumulation of stimulus-related firing reaches asymptote before decision-related firing appears (Fig. 2; Katz et al., 2001; Sadacca et al., 2012). In contrast, ramps seen during certain primate perceptual decision-making tasks represent precisely these accumulations of stimulus-related firing, and are ubiquitously preceded only by information-poor transients. In the responses observed here, such transients precede even the earlier taste-specific states, and only the third “epoch” linearly predicts upcoming behavior (Katz et al., 2001; Sadacca et al., 2012; Moran and Katz, 2014).
More to the point, cortical ensembles respond to gustatory stimuli in a manner that is more similar to simulations in which decision-related firing appears in an instantaneous transition than they are to ramping data simulated from either PSTHs or an integrator model; in fact, the emergence of choice-related firing is indistinguishable from a step function, and the timing of that transition predicts when the decision is reflected in behavior. The gradual ramps that are apparent in across-trial averages of GC responses are in fact poor reflections of single-trial ensemble activity, which “hops” into a decision-related state at different latencies on different trials. A previous publication reached similar conclusions regarding decision-related activity in the classic primate motion-detection task (Latimer et al., 2015).
Nonetheless, it must be noted that our results are perfectly compatible with the possibility that genuine ramps occur elsewhere in the taste neuroaxis. Indeed, it is possible that integration occurs in a downstream region, and that the result of that integration, the motor plan to consume or reject, reaches sensory cortex (in which firing then reflects the crossing of the decision threshold) via feedback. Although our work on other taste-responsive regions (central amygdala, basolateral amygdala, and lateral hypothalamus) has thus far failed to turn up any obvious evidence for such a site of integration (Fontanini et al., 2009; Sadacca et al., 2012; Li et al., 2013), it is likely that a decision requiring 500–1000 ms of processing time brings into play a relatively distributed circuit. This assertion is consistent with the extant literature, which makes it clear that the most basic ingestive/egestive responses can be supported by the rodent brainstem alone (Grill and Norgren, 1978), but that in the intact rat, the forebrain, including GC, is a part of palatability-related decision-making circuitry (Sasamoto et al., 1990; Zhang and Sasamoto, 1990; Berridge and Valenstein, 1991; Kiefer and Orr, 1992; Shammah-Lagnado et al., 1992; Travers et al., 1997; Schafe and Bernstein, 1998; Stehberg et al., 2011; Moraga-Amaro et al., 2014).
In fact, it is clear that feedback from basolateral amygdala (BLA) is vital for the cortical process described here: BLA responses become palatability-related early, whereas these responses are far too early (800 ms before behavior; Fontanini et al., 2009) to be reasonably thought of as reflecting the completion of a decision-making process, though they are nonetheless necessary for this process, in that inactivation of BLA eliminates most decision-related activity in GC (Piette et al., 2012). Thus, although we have no evidence that the GC responses described here represent “efference copy” per se, they undoubtedly make vital use of “top-down” feedback. In that regard, our results are analogous to those reported by Romo et al. (2002), who observed responses in secondary somatosensory cortex that, across 0.5 s of poststimulus time, transitioned from being sensory- to response-related; these responses, too, appear not to reflect obvious efference from motor planning regions, but were conjectured to require feedback from areas involved in executive processing.
It is also worth considering the possibility that consumption decisions are better thought of under the aegis of purely nonintegrating models, sometimes called “hopping” or “jumping” models. Such models have been used to explain the neural underpinnings of many other “postperceptual” choice phenomena (Kemere et al., 2008; Insabato et al., 2010; Rolls et al., 2010; Deco et al., 2013), as well as bistable perception (Deco et al., 2007; Moreno-Bote et al., 2007), “changes of mind” (Bollimunta et al., 2012), and Bayesian inference through sampling (Moreno-Bote et al., 2007, 2011), and have been shown to outperform perfect integrator models under certain conditions (Miller and Katz, 2013). Evidence suggesting that we might be recording from a network of this sort is found in the fact that the latency of firing rate transitions is much more variable than the transition width itself; this aspect of the data runs counter to models employing integration of evidence, but is a reliable feature of attractor-hopping models (Miller and Katz, 2010).
However, even if we entertain the possibility that the consumption decisions examined here work according to an attractor-hopping model, we would not want to argue that integration does not occur in most studied contexts. Perceptual decision making, for instance, naturally lends itself to integration, as novel stimulus information is acquired with each passing moment (Halpern and Tapper, 1971; Shadlen and Newsome, 2001; Uchida and Mainen, 2003; Kepecs et al., 2006; Stapleton et al., 2006; Kiani et al., 2008; Bowman et al., 2012). Furthermore, the weeks to months of training required for perceptual decision-making tasks (training that is not necessary for consumption decisions) allows for the extensive fine-tuning of connection strengths that characterize (Seung, 1996; Wang, 2002) and optimize integrator circuits (Bogacz et al., 2006; Miller and Katz, 2010, 2013).
Finally, even if an attractor-like “hopping” model best explains decision making in the consumption context, it is simplistic to think that real neuronal networks actually transition with perfect instantaneity from one state to another. Conduction delays and other physical properties will slow transitions; furthermore, dynamics arise on a slower time scale than that of single-neuron responses when an attractor-based circuit transitions between two states (Gillespie, 1992). Thus, although we observed no significant differences between the real data and step-function simulations, the real transitions probably take a certain finite amount of time, reflecting intrinsic circuit dynamics.
Trial-specific multiple-neuron analyses (Kass et al., 2005; Lawhern et al., 2010), such as HMM (Abeles et al., 1995; Jones et al., 2007; Kemere et al., 2008; Escola et al., 2011; Ponce-Alvarez et al., 2012), even with its simplifications of uncorrelated firing within states and precise simultaneity of firing rate changes across whole ensembles, and models inspired by them to reproduce substantial across-trial variability in network activity (Deco and Romo, 2008; Deco et al., 2009), constitute a large advance in the direction of understanding naturalistic decisions as they are made in the moment. Our data contribute to a growing literature indicating that temporally distinct, discrete states of neural activity play an important role in cortical sensory coding and production of behavioral responses.
Footnotes
This work was supported by National Institutes of Health/National Institute on Deafness and Other Communication Disorders Grants R01DC00945 (under the National Science Foundation/National Institutes of Health Collaborative Research in Computational Neuroscience mechanism), R01DC007708, R01DC006666, and F31DC009955; a Howard Hughes Medical Institute International Student Fellowship; the Brandeis High-Performance Computing Cluster; and the Swartz Foundation.
The authors declare no competing financial interests.
- Correspondence should be addressed to either Donald B. Katz or Paul Miller, MS013, Volen National Center for Complex Systems, Brandeis University, 415 South Street, Waltham, MA 02453-9110, dbkatz{at}brandeis.edu or pmiller{at}brandeis.edu


