

Abstract
The hippocampus is thought to compare predicted events with current perceptual input, generating a mismatch signal when predictions are violated. However, most prior studies have only inferred when predictions occur without measuring them directly. Moreover, an important but unresolved question is whether hippocampal mismatch signals are modulated by the degree to which predictions differ from outcomes. Here, we conducted a human fMRI study in which subjects repeatedly studied various word–picture pairs, learning to predict particular pictures (outcomes) from the words (cues). After initial learning, a subset of cues was paired with a novel, unexpected outcome, whereas other cues continued to predict the same outcome. Critically, when outcomes changed, the new outcome was either “near” to the predicted outcome (same visual category as the predicted picture) or “far” from the predicted outcome (different visual category). Using multivoxel pattern analysis, we indexed cue-evoked reactivation (prediction) within neocortical areas and related these trial-by-trial measures of prediction strength to univariate hippocampal responses to the outcomes. We found that prediction strength positively modulated hippocampal responses to unexpected outcomes, particularly when unexpected outcomes were close, but not identical, to the prediction. Hippocampal responses to unexpected outcomes were also associated with a tradeoff in performance during a subsequent memory test: relatively faster retrieval of new (updated) associations, but relatively slower retrieval of the original (older) associations. Together, these results indicate that hippocampal mismatch signals reflect a comparison between active predictions and current outcomes and that these signals are most robust when predictions are similar, but not identical, to outcomes.
SIGNIFICANCE STATEMENT Although the hippocampus is widely thought to signal “mismatches” between memory-based predictions and outcomes, previous research has not linked hippocampal mismatch signals directly to neural measures of prediction strength. Here, we show that hippocampal mismatch signals increase as a function of the strength of predictions in neocortical regions. This increase in hippocampal mismatch signals was particularly robust when outcomes were similar, but not identical, to predictions. These results indicate that hippocampal mismatch signals are driven by both the active generation of predictions and the similarity between predictions and outcomes.
Introduction
Memories for past experience allow for outcomes to be predicted based on current perceptual experience. Many theoretical perspectives (Gluck and Myers, 1993; Eichenbaum, 2004; Lisman and Grace, 2005; Buckner, 2010; Rolls, 2013; Davachi and DuBrow, 2015) and empirical findings (Kumaran and Maguire, 2006a; Duncan et al., 2009; Chen et al., 2011) suggest that the hippocampus plays a critical role in comparing memory-based predictions with perception-based outcomes. When predictions do not match outcomes, the hippocampus is thought to generate mismatch signals that reflect these expectancy violations (Kumaran and Maguire, 2006b; Duncan et al., 2012; Chen et al., 2015). Although mismatch signals should depend critically on the active generation of predictions (Kumaran and Maguire, 2007), existing evidence for hippocampal mismatch signals comes from paradigms in which prediction strength is inferred but not measured directly (Kumaran and Maguire, 2006b; Chen et al., 2015). Moreover, an important but unresolved question is whether hippocampal mismatch signals are sensitive to the degree of similarity between predictions and outcomes. When predictions are close, but not identical, to outcomes, are mismatch signals relatively weaker or stronger? From a prediction error perspective, mismatch signals may be greater when predictions are relatively farther from outcomes (Fiorillo et al., 2003). However, given the proposed role of the hippocampus in creating distinct representations of similar stimuli (Düzel et al., 2003; Norman et al., 2006; Leutgeb et al., 2007; Bakker et al., 2008; Yassa and Stark, 2011; Hulbert and Norman, 2015; Favila et al., 2016), hippocampal mismatch signals may increase when predictions are relatively closer to outcomes.
Whereas memory-based predictions are thought to be generated by the hippocampus (Eichenbaum and Fortin, 2009; Buckner, 2010; Davachi and DuBrow, 2015; Hindy et al., 2016), these predictions are reflected by reactivation in neocortical areas (Kok et al., 2012; Hindy et al., 2016). Memory reactivation has been most extensively documented in visual cortical areas (e.g., Polyn et al., 2005; Kuhl et al., 2011), but has also been observed in frontoparietal regions. For example, reactivation within posterior parietal cortex (PPC) reflects detailed information about retrieved content (Kuhl and Chun, 2014; Lee et al., 2016). Reactivation within medial prefrontal cortex (mPFC) is thought to be of particular importance when past experience is compared with present experience (Kroes and Fernandez, 2012; Schlichting and Preston, 2015; Demblon et al., 2016; Richter et al., 2016) and connections between mPFC and hippocampus may provide the ideal scaffolding for a prediction generation and comparison system (Preston and Eichenbaum, 2013; Rajasethupathy et al., 2015; Anderson et al., 2016). Collectively, PPC and mPFC are part of the brain's so-called default mode network (DMN) and it has been argued that the DMN plays a central role in memory-based predictions (Bar, 2007, 2009). Indeed, activity patterns distributed across the DMN contain rich information about the contents of memory (Chen et al., 2016).
In the present study, we tested whether and how hippocampal mismatch signals are modulated by the strength and similarity of memory-based predictions. We used an associative memory task in which human subjects learned cue–outcome pairings. Outcomes were either expected or unexpected and unexpected outcomes were further subdivided into “near” and “far” outcomes based on their similarity to predictions. Motivated by the aforementioned studies, we measured prediction strength by using multivoxel pattern analysis of the DMN and two subregions within the DMN: mPFC and PPC. We first tested whether prediction strength was related to the magnitude of hippocampal outcome responses. We hypothesized that hippocampal outcome responses would increase when predictions were strong but ultimately violated, consistent with a mismatch signal. Second, given the role of the hippocampus in discriminating similar events (Bakker et al., 2008; Yassa and Stark, 2011), we tested whether mismatch signals were stronger when predictions are near to outcomes compared to far from outcomes. Finally, we assessed whether hippocampal outcome responses were associated with subsequent behavioral expressions of successful memory updating.
Materials and Methods
Subjects
Twenty-three (8 female; mean age = 22.4 years) and 26 (15 female; mean age = 21.2 years) right-handed, native English speakers from the Yale University community participated in two separate experiments. Three subjects were excluded from the second experiment, one due to technical error, one due to user error during scanning, and the third due to failure to follow task instructions, resulting in a final set of 23 subjects included in each of the two experiments. The experiments were identical with the exception of a small difference in the post-scan memory test (see below). We therefore collapsed data across both experiments. All subjects had normal or corrected-to-normal vision. Informed consent was obtained in accordance with the Yale Institutional Review Board.
Materials
Stimuli consisted of 144 words and 252 pictures. Words were verbs with a length between 4 and 11 letters (M = 6.3). Pictures consisted of grayscale photographs (225 × 225 pixels) of famous people (e.g., Steve Martin; “faces”), famous locations (e.g., Sydney Opera House; “scenes”), and common objects (e.g., toothbrush; “objects”). All word–picture pairings and the assignment of words and pictures to conditions were randomized for each subject.
Procedure and design
Acquisition phase.
Subjects completed three acquisition rounds during which they encoded word–picture (cue–outcome) pairs (Fig. 1). Words were presented directly above each picture. Subjects were instructed to learn these associations in anticipation of a later memory test. No behavioral responses were made during the acquisition rounds. Each acquisition round contained the same 144 associations, with the order and trial structure varying across rounds. During the first two acquisition rounds, which were completed before subjects entered the fMRI scanner, each word–picture association was presented for 2750 ms, followed by a 500 ms fixation cross. The order of presentation of the associations was randomized. The third acquisition round was conducted during a single functional imaging scan. Again, all 144 associations were presented, but during this round, associations were presented in “mini-blocks” grouped by the visual categories of pictures. For example, four associations containing face pictures might be presented consecutively, followed by four associations containing scene pictures, etc. Within each mini-block, a word–picture association was presented for 2500 ms, followed by a fixation cross for 500 ms. Therefore, each mini-block lasted 12000 ms. Each mini-block was followed by a 6000 ms interblock interval. This interval began with a fixation cross displayed for 700 ms and was then followed by a series of four randomly oriented (left- vs right-oriented) arrows. Each arrow was presented for 800 ms and was followed by a fixation cross for 400 ms. A final fixation cross was then presented for 500 ms before the next block began. The motivation for the mini-block structure of the third acquisition round was to optimize the use of the functional data for training a pattern classifier to discriminate the three visual categories of the pictures (faces vs objects vs scenes).

Experimental paradigm. Subjects first completed three acquisition rounds during which they learned word–picture (cue–outcome) associations. The trial structure for the first two acquisition rounds is shown above; the third acquisition round had a different trial structure and timing parameters (see Materials and Methods). Acquisition rounds 1 and 2 were collected before fMRI scanning; acquisition round 3 was conducted during fMRI scanning. After the acquisition rounds, subjects began the scanned updating phase. Subjects again studied words paired with pictures; however, presentation of the words (cues) and pictures (outcomes) was now separated by 4 s. There were three trial types during the updating phase: expected (an outcome from the acquisition phase was repeated during the updating phase), near (an outcome from the updating phase was replaced with a new picture from the same visual category as the original outcome), and far (an outcome from the acquisition phase was replaced with a new picture from a different visual category as the original outcome). Pattern classifiers were trained to discriminate visual categories using data from the third acquisition round and were tested separately on cue and outcome components from the updating phase. All images in this figure are licensed under a Creative Commons license.
Updating phase.
After the third acquisition round, subjects began the critical updating phase, which was also conducted while fMRI data were collected. During the updating phase, all of the 144 original cues were presented again. Of the 144 cues, 108 were presented with novel outcomes/pictures (“unexpected” trials) and the remaining 36 were presented with the same outcomes/pictures as during acquisition (“expected” trials). Subjects were instructed that, when associations changed (unexpected trials), they should “update” their memory to reflect the new word–picture association. Importantly, unexpected trials could be further subdivided according to whether the outcome was from the same visual category as the original outcome (“near” trials) or from a distinct visual category (“far” trials). For example, a near trial would occur if a cue that was originally paired with a scene picture (e.g., Sydney Opera House) was updated with a new scene picture (e.g., ruins of Pompeii; Fig. 1). Likewise, a far trial would occur if a cue that was originally paired with a face picture (e.g., Steve Martin) was updated with an object picture (e.g., pacifier; Fig. 1).
In contrast to the acquisition phase, the presentation of cues and outcomes was temporally offset in the updating phase. Specifically, each cue (word) was presented alone for 4000 ms and then the outcome (picture) appeared beneath the word for an additional 4000 ms (Fig. 1). This temporal offset between cues and outcomes allowed for predictions to be generated and measured before outcomes were displayed. Because our goal was to decode/measure trial-level cue and outcome responses, we did not jitter the presentation of stimuli, which would have potentially confounded measurements with jitter length. Trials were separated by an 8000 ms intertrial interval. This interval began with a fixation cross displayed for 700 ms and was then followed by a series of six randomly oriented (left- vs right-oriented) arrows. Each arrow was presented for 700 ms and was followed by a fixation cross for 400 ms. A final fixation cross was then presented for 700 ms before the next trial began. The updating phase was divided into six rounds. Each round included 24 trials (18 unexpected, six expected). The 18 unexpected trials were balanced in terms of the visual categories corresponding to the original and new associations. Specifically, there were nine different combinations of visual categories for the original versus new associations (face vs object, face vs scene, etc.) and each of these nine combinations appeared twice per updating round. Likewise, for the six expected trials within each round, there was an even number of trials corresponding to each of the three visual categories (i.e., two face trials, two object trials, and two scene trials).
During the updating phase, subjects were instructed to respond, via button box, whether each outcome (picture) was new (i.e., had not been encountered during acquisition) or old (i.e., had been encountered during acquisition). Therefore, for all unexpected trials, the correct response was “new,” and for all expected trials the correct response was “old.” Due to technical error, responses were only recorded from the sixth updating round for the majority of subjects. However, this task was only included to ensure subject vigilance and accuracy from the available data was near ceiling (mean = 93%).
Post-test phase.
After scanning, subjects completed a behavioral post-test that probed memory for each of the 144 associations. On each trial in the post-test subjects were presented with a cue word and were given a two- or three-alternative forced-choice task of selecting the picture that had been presented with the cue word during the updating phase (i.e., the most recent association). The cue words were presented directly above the set of pictures. For cue words that had been paired with the same picture in both the acquisition and updating phases (expected condition), only two choices were included on the test trial: the picture that had been paired with the cue during the acquisition and updating rounds (the target) and a picture from a different association (a lure). For cues that were paired with a new picture during the updating phase (unexpected condition), three alternatives were included on the test trial: the picture that had been paired with the cue during the updating phase (the target), the picture that had been paired with the cue during the acquisition phase (the original association), and a picture from a different association (a lure). Note: lure pictures were randomly drawn from the three visual categories. After the forced-choice decision, subjects rated their confidence (high/low). The only difference between Experiments 1 and 2 is that, in Experiment 2, after subjects selected the “most recent” association for each cue, they were also asked to select the original picture (for the unexpected condition only). The post-test was self-paced.
fMRI data acquisition
Imaging data were collected on a 3 T Siemens Trio scanner at the Anlyan Center at Yale University using a 12-channel head coil. Before the functional imaging, two T1-weighted anatomical scans were collected (in-plane and high-resolution 3D). Functional data were collected using a T2*-weighted gradient EPI sequence; TR = 2000 ms, TE = 25 ms, flip angle = 90°, 34 axial-oblique slices, 224 mm FOV (3.5 × 3.5 × 4 mm). A total of seven functional scans (one acquisition phase scan and six updating phase scans) were collected. The acquisition phase scan consisted of 329 volumes. Each updating phase scan consisted of 197 volumes. The first five volumes from each scan were discarded to allow for T1 equilibration.
fMRI data preprocessing
fMRI data preprocessing was conducted using SPM8 (Wellcome Department of Cognitive Neurology, London). Images were first corrected for head motion. High-resolution anatomical images were coregistered to the functional images and segmented into gray matter, white matter, and CSF. Segmented gray matter images were “skull-stripped” and normalized to a gray matter Montreal Neurological Institute template. Resulting parameters were used for normalization of functional images. Functional images were resampled to 3 mm isotropic voxels and smoothed with a Gaussian kernel (5 mm FWHM). Functional data were then detrended, high-pass filtered (0.01 Hz), and z-scored within scan (mean response of each voxel within each scan = 0). Next, data were temporally compressed by averaging over volumes. For the acquisition phase data (i.e., the third acquisition round), each of the 36 mini-blocks was treated as a single “trial” by averaging the third through eighth volumes collected after the start of the mini-block. This resulted in a total of 36 spatial volumes, with 12 volumes per visual category. For the updating phase, each trial was separated into two components: prediction and outcome. For the prediction component, the third and fourth volumes (4–8 s) after cue onset were averaged together. For the outcome component, the third and fourth volumes (4–8 s) after outcome onset (or fifth and sixth volumes after cue onset) were averaged together. Therefore, each updating phase trial corresponded to a single spatial volume for the prediction component and a single spatial volume for the outcome component.
Pattern classification analyses
Pattern classification analyses were performed using penalized (L2) logistic regression (penalty parameter = 1), implemented via the Liblinear toolbox (Fan, Chang, Hsieh, Wang, and Lin, 2008) and custom MATLAB (RRID:SCR 001622) code. Before pattern classification analyses were performed, an additional round of z-scoring was performed across voxels so that the mean activation within each spatial volume was equal to 0. This additional z-scoring step eliminated trial-level differences in mean univariate activity (Kuhl et al., 2013; Kuhl and Chun, 2014).
Subject-specific classifiers were first trained to discriminate face, scene, and object trials using data from the acquisition phase. The trained classifiers were then tested on the updating-phase trials separately for the prediction and outcome components. Classifier performance was assessed in two ways. “Classification accuracy” represented a binary coding of whether the classifier successfully “guessed” the visual category of the original outcome (prediction component) or the visual category of the actual, perceived outcome (outcome component). We used classification accuracy for general assessment of classifier performance (i.e., whether predicted and actual outcomes could be decoded). “Classifier evidence” was a continuous value reflecting the logit-transformed probability that the classifier assigned to the relevant category for each trial. Classifier evidence was used as a trial-specific measure of prediction strength, which was related to univariate activity from the outcome component (see below).
Relationship between decoded prediction strength and univariate responses to outcomes
As described above, each updating-phase trial was decomposed into a prediction component and an outcome component. To test whether univariate responses to outcomes were modulated by prediction strength, linear regression analyses were applied in which univariate responses to outcomes were regressed on trial-by-trial measures of prediction strength (from the pattern classifiers). For each subject and each combination of prediction/outcome regions of interest (ROIs), a total of 12 linear regression analyses were run, reflecting different combinations of trial type (expected, near, far) and visual categories for the original/new images (faces, objects, scenes). For the expected trials, there were three regressions: one for each visual category. For the near trials, there were also three regressions: one for each visual category. For the unexpected trials, there were six regressions to reflect each possible combination of original and new visual categories: face–scene, face–object, scene–face, scene–object, object–face, and object–scene. We performed separate regression analyses for each visual category condition to ensure that any relationships between prediction strength and outcome responses could not be an artifact of differences between visual categories. Resulting t-statistics were averaged across visual category conditions within each trial type, yielding three mean t-statistics per subject: one for the expected trial type, one for the near trial type, and one for the far trial type. Mean t-statistics were then used for group-level analyses.
Regions of interest
Pattern classification analyses were performed on two networks of a priori interest: the DMN and the visual network (VisN), as identified from a prior large-scale analysis of fMRI resting-state connectivity (Yeo et al., 2011; Fig. 2A). Pattern classification analyses were additionally performed on two subregions within the DMN, mPFC and PPC. We defined these regions using the conjunction of the DMN mask and either medial prefrontal regions or posterior parietal regions as defined in the Anatomical Automatic Labeling (AAL) atlas (Tzourio-Mazoyer et al., 2002). We also defined three a priori anatomical ROIs (Fig. 3A): hippocampus, the pars triangularis region of left inferior frontal gyrus (LIFGt) and caudate. LIFGt and caudate were included as comparison regions given that these regions have previously been implicated in signaling when expectations are violated (Schultz et al., 1997; Kawagoe et al., 2004; Daw and Doya, 2006; Daw and Shohamy, 2008) or when mnemonic associations change (Dolan and Fletcher, 1997; Kuhl et al., 2012). The anatomical masks were created from the AAL atlas. The DMN mask was modified to remove voxels that overlapped with the hippocampal ROI (fewer than 10 voxels were removed).
Results
Decoding prediction signals
The primary goal of our study was to measure whether and how neural predictions modulate hippocampal responses to outcomes. To measure neural predictions, we applied pattern classification analyses to the DMN. We targeted the DMN because it has been proposed specifically to play a role in memory-based predictions (Bar, 2007, 2009) and because prior applications of pattern classification analyses have revealed robust evidence of memory reactivation within subregions of the DMN, particularly within the PPC and mPFC (Euston et al., 2012; Zeithamova et al., 2012; Kuhl and Chun, 2014; Schlichting and Preston, 2015; Richter et al., 2016). For comparison, we also applied pattern classification analyses to voxels within VisN, which included areas dedicated to both early visual processing (occipital cortex) and higher-level perception (ventral temporal cortex). We predicted that, compared with the VisN, the DMN would show greater representation of predicted outcomes; in contrast, we predicted that, relative to the DMN, the VisN would show greater representation of perceived outcomes. To first test for evidence of predictions, we trained an L2 logistic regression classifier on acquisition-phase data and tested the classifier on updating-phase data during the cue presentation interval. Decoding of the predicted outcome (the original associate) was well above chance in both the DMN (t(45) = 7.0, p < 0.001) and the VisN (t(45) = 6.5, p < 0.001; Fig. 2B), with significantly greater decoding performance in the DMN than in the VisN (t(45) = 2.3, p = 0.02). To assess decoding of the perceived outcome, we again used a classifier that was trained on acquisition-phase data, but now tested the classifier on updating-phase data during the stimulus presentation interval (the outcome). We found reliable decoding of the presented outcome in both the DMN (t(45) = 15.8, p < 0.001) and the VisN (t(45) = 44.7, p < 0.001), but decoding performance was now significantly greater in the VisN than in the DMN (t(45) = 22.3, p < 0.001). A 2 × 2 ANOVA with region (DMN vs VisN) and decoding target (predicted vs perceived outcome) yielded a significant interaction (F(1,45) = 617.5, p < 0.001), reflecting the relatively greater contribution of the DMN to representing memory-based predictions and of the VisN to representing perceived outcomes. Within the DMN, decoding of the predicted outcome was well above chance both in mPFC and PPC (mPFC, t(45) = 5.0, p < 0.001; PPC, t(45) = 9.5, p < 0.001).

Decoding predicted and perceived outcomes. A, Pattern classification analyses were applied to two networks: the DMN (blue) and the VisN (orange). B, Classification accuracy for predicted outcomes was greater in the DMN than the VisN (left), whereas classification accuracy for perceived outcomes was greater in the VisN than the DMN (right). Error bars represent SEM. *p < 0.05.
Prediction strength modulates hippocampal responses to unexpected event outcomes
Having established that memory-based predictions are reflected robustly in DMN activity patterns, we next sought to relate DMN prediction strength (memory reactivation for the original associate) to hippocampal outcome responses. To the extent that hippocampal mismatch signals reflect a comparison between predictions and outcomes, then hippocampal outcome responses should increase when predictions are relatively strong but differ from outcomes. Therefore, we expected a positive relationship between prediction strength and hippocampal outcome responses for unexpected trials (near and far), but not for expected trials. Notably, there was no overall difference in hippocampal activation across expected vs unexpected trials (t(45) = 0.07, p = 0.95), indicating that associative novelty alone (without accounting for prediction strength) did not modulate hippocampal activity. To index prediction strength, we used classifier evidence for memory reactivation, which yielded a continuous, trial-by-trial value where higher values index stronger predictions (Gershman et al., 2013; Kuhl et al., 2013; see Materials and Methods). Importantly, whereas predictions were decoded using brain volumes acquired 3–4 TRs after the onset of the cue (word), outcome responses were based on brain volumes acquired 3–4 TRs after the onset of the outcome (picture), which was 5–6 TRs after cue onset. This allowed for separation of cue- and outcome-evoked activity.
Subject-specific linear regression analyses were applied, in which classifier evidence for the predicted outcome (prediction strength) was the independent variable and hippocampal univariate activity in response to the actual outcome was the dependent measure. Using classifier evidence from the DMN to index predictions, there was a significant positive relationship between prediction strength and hippocampal responses to unexpected outcomes (t(45) = 2.6, p = 0.01; Fig. 3B, first panel), but not to expected outcomes (t(45) = 0.35, p = 0.73). Therefore, hippocampal responses to unexpected outcomes increased as a function of DMN prediction strength, consistent with the idea that hippocampal mismatch signals depend on the active generation of predictions. Prediction strength within VisN did not modulate hippocampal responses to unexpected (t(45) = 0.86, p = 0.39) or expected (t(45) = 1.9, p = 0.06) outcomes (Fig. 3B, fourth panel). A region (DMN, VisN) × trial type (expected, unexpected) repeated-measures ANOVA revealed a significant interaction (F(1,45) = 4.2, p = 0.046). We also tested whether prediction strength within the hippocampus was correlated with hippocampal outcome responses, but did not find a significant relationship for expected (t(45) = −0.32, p = 0.75) or unexpected (t(45) = −1.3, p = 0.18) trials.
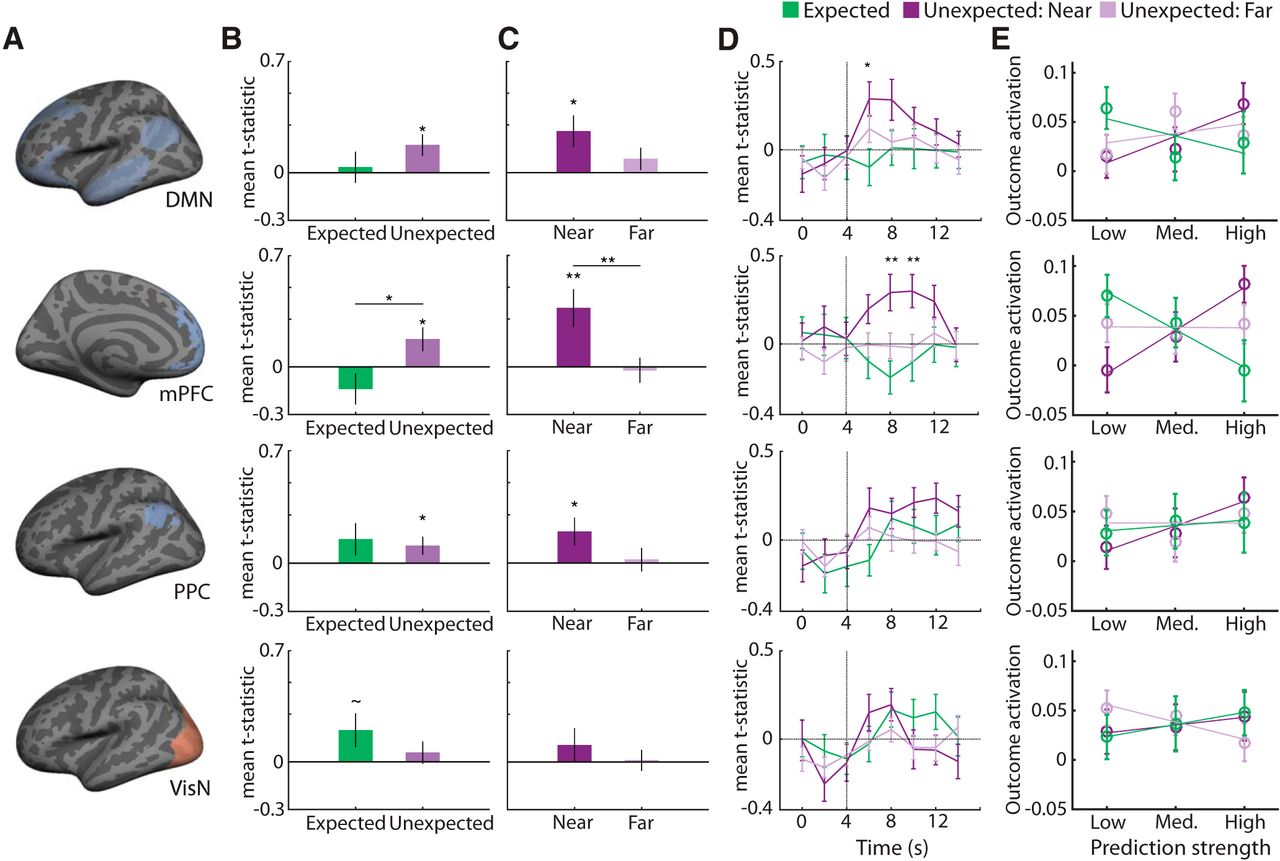
Relationship between prediction strength and hippocampal outcome responses. A, We assessed prediction strength (reactivation of the original associate) in the DMN, two subregions of the DMN (mPFC and PPC, which included lateral and medial portions, but only lateral PPC is shown here) and the VisN. B, C, Both figures show results from linear regressions relating classifier evidence for the predicted outcome to univariate hippocampal response amplitude to the actual outcome. Each row corresponds to a different “prediction region,” as shown in A. B, Relationship between prediction strength and hippocampal outcome responses for expected and unexpected trials. C, Relationship between prediction strength and hippocampal outcome responses for the two subtypes of unexpected trials: near and far trials. D, Prediction strength measured during TRs 3–4 was used to predict the hippocampal outcome response for each trial type (expected, unexpected near, and unexpected far) at each TR. The vertical gray line indicates the time point at which outcomes were shown. Asterisks denote significant one-way ANOVAs across trial type (expected, near, far) at each TR. Note: significant effects of trial type only occurred after outcomes were shown. E, Hippocampal outcome activation (y-axis) binned according to prediction strength (x-axis) separately for each of the outcome conditions. Significant interactions between condition (expected, unexpected near, unexpected far) and prediction strength (low, medium, high) were observed for DMN and mPFC (p ≤ 0.05). Error bars indicate SEM. ∼p < 0.10, *p < 0.05, **p < 0.01.
We next considered two subregions of the DMN: mPFC and PPC. For mPFC, prediction strength was positively related to hippocampal responses to unexpected outcomes (t(45) = 2.4, p = 0.02), but not expected outcomes (t(45) = −1.5, p = 0.15), with a significant difference in the relationship for unexpected versus expected trials (t(45) = 2.6, p = 0.01; Fig. 3B, second panel). For PPC, prediction strength was positively related to hippocampal responses to unexpected outcomes (t(45) = 2.0, p = 0.049), but not expected outcomes (t(45) = 1.5, p = 0.13); however, there was no significant difference in the relationship for unexpected versus expected trials (t(45) = 0.33, p = 0.75; Fig. 3B, third panel). The relatively greater effect of trial type for mPFC was confirmed by a significant region (mPFC, PPC) × trial type (expected, unexpected) interaction (repeated-measures ANOVA, F(1,45) = 6.1, p = 0.017).
Similarity between predictions and outcomes modulates hippocampal responses
The preceding analyses confirm our first hypothesis: that hippocampal responses to unexpected outcomes are modulated by the strength of neural predictions. Our second question was whether this relationship varies as a function of the similarity between predictions and outcomes. Specifically, does the relationship between prediction strength and hippocampal outcome response vary for near versus far unexpected trials? Using the DMN to index predictions, we found that the difference between the relationships (near vs far) trended toward significance (t(45) = 1.7, p = 0.10; Fig. 3C, first panel). There was a significant, positive relationship between prediction strength and hippocampal outcome responses for near trials (t(45) = 2.7, p = 0.01), but not far trials (t(45) = 1.3, p = 0.21). For VisN, prediction strength was not significantly related to hippocampal outcome responses for near (t(45) = 1.0, p = 0.32) or far trials (t(45) = 0.16, p = 0.87), nor was there a significant difference between near versus far trials (t(45) = 0.88, p = 0.38). However, a region (DMN, VisN) × trial type (near, far) repeated-measures ANOVA did not reveal a significant interaction (F(1,45) = 0.60, p = 0.44).
For mPFC, the relationship between prediction strength and hippocampal outcome response was significantly more positive for near than far trials (t(45) = 3.0, p = 0.005; Fig. 3C, second panel) and was positive and highly significant for near trials (t(45) = 3.2, p = 0.003), but not far trials (t(45) = 0.28, p = 0.78). Qualitatively, the results for PPC were similar, but attenuated (Fig. 3C, third panel): the relationship between PPC prediction strength and hippocampal outcome response was not significantly more positive for near compared with far trials (t(45) = 1.5, p = 0.13), but there was a significant positive relationship for near (t(45) = 2.3, p = 0.03), but not far trials (t(45) = 0.30, p = 0.77). A region (mPFC, PPC) × trial type (near, far) repeated-measures ANOVA revealed a significant main effect of trial type (F(1,45) = 8.1, p = 0.007), reflecting the stronger relationship for near than far trials, with no interaction (F(1,45) = 2.3, p = 0.14).
To supplement our findings above, we also ran several control analyses. First, we confirmed that prediction strength only modulated outcome responses after outcomes actually appeared—in other words, that the relationship between prediction strength and outcome response was offset temporally. To confirm this, we re-ran the regression analyses in which prediction signals were again time locked to the cue period (TRs 3–4 post-cue onset), but we now systematically varied the time point of the “outcome,” starting with time points before the outcome appeared through time points after the outcome appeared. Specifically, for each TR (1–8), we ran a separate regression analysis in which a single TR was used to index the outcome response. Because TRs 1–4 correspond to volumes before an outcome-related fMRI response should peak, there should not be any outcome-related effects during these TRs. Indeed, relationships between prediction strength and unexpected outcomes only emerged in TRs after the onset appeared (Fig. 3D). As an additional test of the temporal relationship between prediction and outcome responses, we also ran a control analysis in which we measured “prediction strength” during the putative outcome window (TRs 5 and 6 post-cue onset) and measured the hippocampal “outcome response” during the putative prediction window (TRs 3 and 4). With this “switching” of the windows, there was no relationship between prediction strength and hippocampal outcome response for any of the prediction ROIs (DMN, mPFC, PPC, or VisN) for either expected (p ≥ 0.4) or unexpected (p ≥ 0.45) trials.
Finally, we ran a new analysis in which, instead of assessing the relationship between prediction strength and outcome response via linear regression, we divided outcome responses according to three equally sized bins of prediction strength: high, medium, and low. This allowed us to address the relationship between prediction strength and outcome response via repeated-measures ANOVA. Qualitatively and statistically, this analysis approach yielded virtually identical results (Fig. 3E). In particular, hippocampal outcome responses varied as a function of prediction strength (high, medium, low) and trial type (expected, near, far trials) in both DMN and mPFC (DMN, F(4,180) = 2.7, p = 0.03; mPFC, F(4,180) = 4.4, p = 0.002), but not PPC or VisN (PPC, F(4,180) = 0.75, p = 0.56; VisN; F(4,180) = 0.97, p = 0.43). Specifically, for DMN and mPFC, hippocampal outcome responses tended to decrease as a function of prediction strength when outcomes were expected and to increase when outcomes were near but unexpected.
Outcome responses in frontostriatal regions
We have shown that hippocampal mismatch signals are modulated by DMN prediction strength and that this relationship is particularly strong when considering prediction strength within mPFC. Although we had an a priori interest in outcome responses within the hippocampus, for comparison purposes, we also considered outcome responses in two additional regions that have been implicated previously in memory updating: the LIFGt and caudate. Caudate has been shown to respond to expectancy violations (Schultz et al., 1997; Daw et al., 2006) and LIFGt has been shown to respond when episodic memory associations change (Dolan and Fletcher, 1997; Kuhl et al., 2012). Based on these prior findings, we expected that both LIFGt and caudate would exhibit outcome responses that were related to prediction strength. Of critical interest, however, was whether LIFGt and/or caudate would be sensitive to the similarity between predictions and outcomes (near vs far trials).
For both LIFGt and caudate, there tended to be a positive relationship between mPFC prediction strength and outcome response for unexpected trials and a negative relationship for expected trials (Fig. 4). For both regions, this difference in relationship for expected versus unexpected trials was significant (LIFGt: t(45) = 2.4, p = 0.02; caudate t(45) = 2.2, p = 0.03). Therefore, as with hippocampus, LIFGt and caudate responses were differentially modulated by mPFC prediction strength as a function of whether outcomes were expected versus unexpected. However, whereas the relationship between mPFC prediction strength and hippocampal outcome response was significantly stronger for near trials than far trials, there was no significant difference between near versus far trials for either LIFGt or caudate (LIFGt, t(45) = 0.32, p = 0.75; caudate, t(45) = 1.0, p = 0.31). In fact, for caudate, the relationship between mPFC prediction strength and outcome response was significant for far trials (t(45) = 2.1, p = 0.04), but not near trials (t(45) = 0.48, p = 0.64). The relatively greater sensitivity of hippocampus to the type of unexpected outcome was confirmed by region × trial type (near vs far) interactions: hippocampus versus LIFGt (F(1,45) = 6.2, p = 0.02) and hippocampus versus caudate (F(1,45) = 26.8, p < 0.0001). Therefore, although all three regions (hippocampus, LIFGt, and caudate) were sensitive to the difference between unexpected and expected outcomes, the hippocampus was uniquely sensitive to differences in similarity among unexpected outcomes.

Relationship between mPFC prediction strength and outcome responses in LIFGt and caudate. Linear regression analyses were applied in which mPFC prediction strength was used to predict univariate outcome responses in LIFGt and caudate. Relationships are separately shown for expected and unexpected trials (left column), and for the unexpected trial subtypes: near and far trials (right column). LIFGt and caudate were each sensitive to the difference between expected versus unexpected trials, but not to the difference between near versus far unexpected trials. Error bars represent SEM. ∼p < 0.10, *p < 0.05.
Post hoc, voxelwise whole-brain analyses (uncorrected threshold of p = 0.001, 5 voxel extent threshold) confirmed the above findings. A contrast of unexpected versus expected trials revealed significant clusters in hippocampus, caudate, and IFG (right lateralized). However, for the comparison of near versus far trials, a cluster was observed in hippocampus, but not IFG or caudate. Likewise, the comparison of near versus far trials did not reveal clusters in the ventral striatum, midbrain, or insula, regions that have been associated previously with prediction error, mismatch, and/or expectancy violation signals (Berns et al., 2001; Lisman and Grace, 2005; D'Ardenne et al., 2008; Preuschoff et al., 2008; Axmacher et al., 2010).
Mismatch signals and subsequent memory performance
As a final question, we investigated whether mismatch signals in the hippocampus reflect an adaptive learning mechanism. Specifically, we tested whether greater hippocampal responses to unexpected outcomes were associated with better performance on a subsequent memory test. The subsequent memory test, which was conducted after fMRI scanning, probed subjects' memories for the most recent cue–outcome associations. For expected trials, associations never changed and, therefore, the “most recent” association was also the original association. For unexpected trials, responses on the post-test were divided into “successful updating” trials (when subjects selected the most recent association) and “failed updating” trials (when subjects selected the original association; Kuhl et al., 2012).
Subjects selected the most recent associate (successful updating) on the majority of trials (collapsed across high and low confidence, expected trials: M = 92.6%, SD = 7.9%; near trials: M = 72.7%, SD = 19.2%; far trials: M = 69.5%, SD = 18.1%). For near and far trials, failed updating occurred when subjects selected the original association (near: M = 16.3%, SD = 15.5%; far: M = 17.9%, SD = 15.8%). Subsequent memory analyses (i.e., comparing hippocampal activation for subsequent successful updating vs failed updating) were complicated by the relatively low rate of failed updating trials, particularly when also controlling for visual category condition. That said, we ran two subsequent memory analyses to test for relationships between hippocampal outcome responses and subsequent memory accuracy. In one version, we included all subjects in the analysis and removed conditions, for each subject, that contained an empty cell (either an empty successful updating or “failure to update” cell). However, there was no reliable subsequent memory for either near trials (t(34) = −0.1, p = 0.92) or far trials (t(39) = 0.71, p = 0.48). In a second version, we only included subjects that had at least one trial in each cell of the design. This resulted in the inclusion of only 16 of 46 subjects. Again, subsequent memory effects were not observed for near trials (t(15) = −0.54, p = 0.59) or far trials (t(15) = 0.64, p = 0.53).
Given the generally high performance and relatively low number of failed updating trials, we focused instead on potential relationships between hippocampal outcome responses and RTs on the subsequent memory test. We predicted that greater hippocampal outcome responses would be associated with faster RTs (“better” memory). Mean RTs across successful updating trials (high and low confidence combined) were as follows: expected = 2379 ms (SD = 619 ms), near = 3716 ms (SD = 1196 ms), and far = 3679 ms (SD = 941 ms). To test for trial-level relationships between hippocampal outcome responses and memory performance, we ran linear regression analyses in which the predictor variable was univariate hippocampal activity measured in response to the outcome (during the updating phase) and the dependent measure was RT during the post-scan memory test. For each subject, separate linear regression analyses were run for each trial type (expected, near, and far) and visual category conditions, resulting in 12 separate regressions. Resulting t-statistics were then averaged across visual category conditions. Two subjects who did not complete the posttest were excluded from the analysis.
Consistent with the idea that hippocampal mismatch signals reflect an adaptive mechanism, there was a significant negative relationship between hippocampal outcome responses on unexpected (near and far) trials and post-test RTs (t(43) = 2.7, p < 0.01; Fig. 5A). There was no significant relationship between hippocampal outcome responses and RTs for expected trials (t(43) = 1.5, p = 0.14), nor was there a difference in the relationship for near versus far trials (t(43) = 0.24, p = 0.81). To complement this regression analysis, we also ran separate linear mixed-effects models for unexpected and expected trials to assess the relationship between hippocampal outcome response and post-test RTs. The full model included hippocampal activity and visual category as fixed effects. An intercept for subjects and by-subject random slopes for all fixed effects were included as random effects. Again, we observed a significant main effect of hippocampal outcome activity on posttest RTs for unexpected trials (χ2 = 24.3, p < 0.001), but now also observed a significant effect for expected trials (χ2 = 12.7, p = 0.01). We also tested whether post-test RTs were related to prediction strength (as opposed to outcome response) during the updating phase by rerunning the regression analyses with DMN prediction strength replacing outcome response. To be clear, for this analysis, we were relating reactivation of the original association to subsequent retrieval of the most recent association. However, DMN prediction strength did not predict post-test RTs (t ≤ 1, p ≥ 0.4). Likewise, there was no relationship between prediction strength and post-test RTs when predictions were indexed by mPFC, PPC, or VisN (p ≥ 0.4). Therefore, although neocortical prediction strength was related to hippocampal outcome responses and hippocampal outcome responses predicted subsequent memory performance, neocortical prediction strength did not, on its own, predict subsequent memory performance.

Relationships between hippocampal outcome responses and RTs during postscan memory test. Linear regressions were used to test for relationships between hippocampal outcome responses and RTs on a subsequent memory test (correct trials only). A, For unexpected trials, there was a negative relationship between hippocampal outcome responses and subsequent RTs for retrieval of new (updated) associations indicating that greater hippocampal outcome responses corresponded to faster subsequent retrieval of the new associations. B, Using data from Experiment 2 only, linear regression analyses tested for relationships between hippocampal outcome responses and subsequent RTs for retrieval of the new association (left) and the original association (right). Greater hippocampal outcome responses were associated with relatively faster RTs for subsequent retrieval of new associations, but relatively slower RTs for retrieval of original associations (main effect of association: F(1,20) = 6.4, p = 0.02). This difference was stronger for near than far trials, as reflected by a significant interaction between association (new, original) and trial type (near, far; F(1,20) = 4.8, p = 0.04). Error bars represent SEM. *p < 0.05, **p < 0.01.
To the extent that hippocampal outcome responses are related to successful memory updating, better memory for the most recent (new) association may come at the expense of retaining the original (old) association (Kim et al., 2014). We were able to test this idea using data from Experiment 2 as this Experiment (but not Experiment 1) included a two-stage post-test in which stage 1 probed memory for the new association (as described above) and stage 2 probed memory for the original association (see Materials and Methods). Toward this end, we re-ran the linear regression analyses using Experiment 2 data only. In one set of analyses, the predictor variable was hippocampal outcome responses and the dependent measure was RTs during subsequent successful retrieval of the new association (stage 1 performance). In a separate set of analyses, the dependent measure was instead RTs during subsequent successful retrieval of the original association (stage 2 performance). Importantly, we only considered trials for which subjects successfully selected the most recent (stage 1) and the original association (stage 2). We also separately considered relationships for near versus far trials. A 2 × 2 repeated-measures ANOVA with factors of trial type (near, far) and memory association (new, original) revealed a significant main effect of memory association (F(1,20) = 6.4, p = 0.02), as well as a significant interaction (F(1,20) = 4.8, p = 0.04). The main effect of memory association reflected the fact that greater hippocampal outcome responses were associated with relatively faster RTs during retrieval of new associations and relatively slower RTs during retrieval of original associations (Fig. 5B). In other words, hippocampal outcome responses signaled a tradeoff between memory for the new versus original associations. The interaction reflected the fact that this difference was relatively stronger for near trials compared with far trials, complementing our finding that hippocampal mismatch signals were relatively more robust for near than far trials. Although these analyses are based only on subsequent retrieval speed and not retrieval accuracy, they are consistent with the idea that hippocampal outcome responses reflect an adaptive mechanism.
Discussion
Here, we tested whether hippocampal responses to unexpected outcomes are sensitive to the strength of neural predictions and to the similarity between predictions and outcomes. We quantified prediction strength by measuring cue-evoked memory reactivation within the default mode network and two subregions within the DMN: medial prefrontal cortex and posterior parietal cortex. We report three main findings. First, prediction strength was positively related to hippocampal responses to unexpected outcomes, but not expected outcomes, consistent with the proposed role of the hippocampus as a mismatch detector (Kumaran and Maguire, 2006b; Duncan et al., 2012). Second, hippocampal outcome responses were sensitive to the similarity between predictions and outcomes, particularly when considering predictions derived from mPFC. More specifically, hippocampal outcome responses increased with prediction strength to a greater degree when predictions were similar to outcomes (near trials) compared to when predictions were dissimilar to outcomes (far trials). Finally, hippocampal responses to unexpected outcomes were associated with subsequent behavioral expressions of memory updating, with greater hippocampal outcome responses predicting relatively faster retrieval of new associations and relatively slower retrieval of older associations.
Compared with prior reports of hippocampal mismatch signals (Kumaran and Maguire, 2006a, 2006b; Duncan et al., 2009, 2012; Chen et al., 2015), a critical—and novel—advantage of our experimental approach is that we measured directly, on a trial-by-trial basis, neural prediction strength. Although the hippocampus is known to act as a novelty detector (Stern et al., 1996; Strange et al., 1999; Ranganath and Rainer, 2003), the mismatch signal is not thought to simply reflect associative novelty, but to reflect a comparison between an actively generated prediction and a new, but unexpected associative outcome (Kumaran and Maguire, 2007). Consistent with this perspective, we found that hippocampal outcome responses increased as a function of prediction strength for unexpected trials, but not expected trials. In other words, hippocampal outcome responses did not simply scale with prediction strength, but were instead sensitive to whether predictions matched outcomes. This dissociation was observed when predictions were derived from DMN, mPFC, or PPC, but the dissociation was most compelling for mPFC predictions, in which a significant, positive relationship was observed for unexpected trials and a numerically negative relationship was observed for expected trials. Importantly, we did not find differences in hippocampal outcome responses to unexpected versus expected outcomes when prediction strength was not taken into account, confirming that hippocampal outcome responses reflected a combination of strong predictions and a violation of those predictions.
We also found that hippocampal outcome responses were sensitive to the similarity between predictions and outcomes. Considering predictions derived from DMN, mPFC, or PPC we found a significant relationship between prediction strength and hippocampal outcome response for near outcomes but not far outcomes. Again, this dissociation was particularly evident when considering mPFC predictions, with a significantly stronger relationship for near trials compared with far trials. Therefore, hippocampal mismatch signals were greatest when outcomes were close, but not identical, to predictions. Potentially, this finding is related to the proposed role of the hippocampus in disambiguating similar stimuli (Marr, 1971; McNaughton and Morris, 1987; O'Reilly and McClelland, 1994; Leutgeb et al., 2007; Yassa and Stark, 2011). Recently, we have shown that hippocampal activity patterns become differentiated when stimuli are highly overlapping (Favila et al., 2016). However, whether hippocampal mismatch signals are directly related to disambiguation of hippocampal activity patterns remains an open question and such a relationship could take multiple forms. When similar representations are successfully disambiguated or pattern separated, this may facilitate mismatch detection (Lee et al., 2005). Conversely, detection of near mismatches may drive the hippocampus into a “pattern separating” state (Duncan et al., 2012) that results in disambiguation. In either case, there may be a direct relationship between hippocampal mismatch detection and the disambiguation of similar stimuli. One caveat, however, in relating the present findings to prior evidence of hippocampal disambiguation of similar events (Bakker et al., 2008; Hulbert and Norman, 2015; Favila et al., 2016) is that our near condition only referred to stimuli from a common visual category, whereas prior studies have considered stimuli with much stronger perceptual overlap. Therefore, an informative follow-up to the present work would be to consider the relationship between prediction strength and hippocampal outcome responses across a wider range of similarities between predictions and outcomes (Lacy et al., 2011; Duncan et al., 2012).
As a point of comparison, we also considered outcome responses in caudate and LIFGt. As with hippocampal outcome responses, we found that caudate and LIFGt outcome responses tended to increase with mPFC prediction strength when outcomes were unexpected, but to decrease with prediction strength when outcomes were expected. The negative relationship for expected trials, which was marginally significant for both caudate and LIFGt (Fig. 4), potentially reflects a form of repetition suppression that occurs when outcomes match actively held predictions (Miller et al., 1991; Wiggs and Martin, 1998; Henson and Rugg, 2003; Grill-Spector et al., 2006; Meyer and Olson, 2011; Klein-Flugge et al., 2013; Boorman et al., 2016). Conversely, the tendency for activity to increase as a function of prediction strength on unexpected trials is consistent with prior evidence relating caudate responses to expectancy violations (Schultz et al., 1997; Daw and Doya, 2006; Daw and Shohamy, 2008) and LIFGt activity to changes in mnemonic associations (Dolan and Fletcher, 1997; Kuhl et al., 2012). However, in contrast to the hippocampus, neither caudate or LIFGt were sensitive to the similarity between predictions and outcomes (Fig. 4), with no differences in the strength of relationships between prediction strength and outcome responses for near versus far trials. Indeed, the hippocampus was significantly more sensitive to the difference between near versus far trials than either caudate or LIFGt. Therefore, whereas hippocampus, caudate, and LIFGt may each play a role in updating mnemonic associations, our findings point to a qualitative difference across these regions, with hippocampus uniquely sensitive to the similarity between predictions and outcome.
By considering performance on the post-scan memory test, we were able to assess whether hippocampal outcome responses reflected an adaptive learning mechanism. Although we did not find relationships between hippocampal outcome responses and subsequent memory accuracy, we did find relationships with subsequent reaction times: namely, greater hippocampal outcome responses on unexpected trials predicted faster reaction times during subsequent retrieval of the new (updated) association. Interestingly, we observed a significantly different relationship when we considered subsequent retrieval of the older (original) associations, with greater hippocampal outcome responses tending to predict slower retrieval of the older associations. These findings are consistent with the idea that hippocampal responses to unexpected outcomes reflect an adaptive tradeoff that biases memory toward new, relevant associations and away from older, irrelevant associations (Kim et al., 2014).
To measure memory-based predictions, we targeted the DMN based on theoretical proposals that the DMN actively represents memory-based predictions (Bar, 2007, 2009) and recent evidence that activity patterns in the DMN and its subregions reflect the contents of memory retrieval (Kuhl and Chun, 2014; Chen et al., 2016; Richter et al., 2016). Our findings strongly reinforce both of these points while also providing new insight into the functional significance of predictions carried by the DMN. Although memory reactivation has most typically been studied in visual cortical areas (e.g., Polyn et al., 2005; Kuhl et al., 2011), we observed a double dissociation between the DMN and the visual network with stronger reactivation (predictions) in the DMN than the VisN and stronger decoding of outcomes (perception) in the VisN than the DMN. Moreover, we found that predictions derived from the DMN and its subregions, but not predictions from VisN, were related to hippocampal outcome responses. These dissociations between the DMN and the VisN add to prior evidence of functional dissociations in reactivation across visual and frontoparietal regions (Kuhl et al., 2013). Our findings also specifically highlight mPFC as an important “prediction region” in relation to hippocampal outcome responses. The current mPFC findings are highly consistent with prior evidence that mPFC represents older memories in relation to new learning (Richter et al., 2016) and that mPFC interacts with the hippocampus during memory updating (van Kesteren et al., 2010; Zeithamova et al., 2012).
Finally, although our findings suggest that predictions within the DMN may be particularly relevant to hippocampal mismatch signals, it is important to emphasize that the predictions we decoded from DMN activity patterns were presumably triggered by hippocampal pattern completion processes (O'Reilly and McClelland, 1994; O'Reilly and Rudy, 2001; Staresina et al., 2012; Rolls, 2013; Hindy et al., 2016). Therefore, the hippocampus may play a critical role both in generating predictions and comparing predictions to outcomes (Hasselmo and Wyble, 1997; Lisman and Grace, 2005; Kumaran and Maguire, 2007; Chen et al., 2015). That said, when we decoded prediction strength directly from the hippocampus, it was not related to univariate hippocampal outcome responses. This null result may simply reflect the difficulty of decoding predictions from the hippocampus (Mack and Preston, 2016). Alternatively, it is possible that the DMN plays an important role in transforming or processing hippocampal predictions before they are fed back to the hippocampus. Although future work will be required to tease apart these possibilities, which would benefit from methods with more precise temporal resolution, the present work establishes an important relationship between the predictions carried by the DMN and mismatch signals within the hippocampus.
Footnotes
This work was supported by the National Institutes of Health (Grant NS089729). We thank Marvin Chun for helpful discussion and feedback and Sam Cartmell for assistance with data collection.
The authors declare no competing financial interests.
- Correspondence should be addressed to either Nicole Long or Brice Kuhl, Department of Psychology, Lewis Integrative Science Bldg, University of Oregon, Eugene, OR 97403. niclong{at}uoregon.edu or bkuhl{at}uoregon.edu


