

Abstract
Neural dynamics preceding seizures are of interest because they may shed light on mechanisms of seizure generation and could be predictive. In healthy animals, hippocampal network activity is shaped by behavioral brain state and, in epilepsy, seizures selectively emerge during specific brain states. To determine the degree to which changes in network dynamics before seizure are pathological or reflect ongoing fluctuations in brain state, dorsal hippocampal neurons were recorded during spontaneous seizures in a rat model of temporal lobe epilepsy. Seizures emerged from all brain states, but with a greater likelihood after REM sleep, potentially due to an observed increase in baseline excitability during periods of REM compared with other brains states also characterized by sustained theta oscillations. When comparing the firing patterns of the same neurons across brain states associated with and without seizures, activity dynamics before seizures followed patterns typical of the ongoing brain state, or brain state transitions, and did not differ until the onset of the electrographic seizure. Next, we tested whether disparate activity patterns during distinct brain states would influence the effectiveness of optogenetic curtailment of hippocampal seizures in a mouse model of temporal lobe epilepsy. Optogenetic curtailment was significantly more effective for seizures preceded by non-theta states compared with seizures that emerged from theta states. Our results indicate that consideration of behavioral brain state preceding a seizure is important for the appropriate interpretation of network dynamics leading up to a seizure and for designing effective seizure intervention.
SIGNIFICANCE STATEMENT Hippocampal single-unit activity is strongly shaped by behavioral brain state, yet this relationship has been largely ignored when studying activity dynamics before spontaneous seizures in medial temporal lobe epilepsy. In light of the increased attention on using single-unit activity for the prediction of seizure onset and closed-loop seizure intervention, we show a need for monitoring brain state to interpret correctly whether changes in neural activity before seizure onset is pathological or normal. Moreover, we also find that the brain state preceding a seizure determines the success of therapeutic interventions to curtail seizure duration. Together, these findings suggest that seizure prediction and intervention will be more successful if tailored for the specific brain states from which seizures emerge.
Introduction
In temporal lobe epilepsy, seizures can emerge from both sleep and wakeful states (Dinner, 2002) and, in some cases, show preference for emerging from rapid eye movement (REM) sleep (Sedigh-Sarvestani et al., 2014). The heterogeneity of brain states preceding seizures raises the possibility that seizures arising from distinct states may arise through at least partially distinct mechanisms and thus would require tailored intervention. To understand the network dynamics involved in spontaneous seizure generation, studies of neural activity patterns preceding seizures have revealed that individual inhibitory interneurons increase their firing rates, whereas principal cells increase firing rate variability (Bower and Buckmaster, 2008; Truccolo et al., 2011; Bower et al., 2012; Grasse et al., 2013). In these studies, neuron dynamics before seizures were interpreted as reflecting the pathological changes associated with the oncoming seizure, which suggests that they could be used to predict seizures. However, substantial changes in interneuron and principal cell firing patterns also occur at the transition between brain states, which raises the possibility that an altered neuronal firing pattern in advance of seizures reflects behavioral brain state transitions. Indeed, it was found recently that preseizure activity patterns for many neurons were associated with hippocampal theta rhythm (Fujita et al., 2014), which is characteristic of REM sleep and awake movement states. Seizure prediction that is based on neuronal firing patterns could thus be refined by studying the interaction between brain state transitions and neural activity before seizures.
In the hippocampus, brain states are characterized by unique neuronal activity patterns that correlate with specific behavioral states of the animal. During periods of awake mobility, hippocampal local field potential (LFP) oscillates at theta frequency (6–10 Hz; Vanderwolf, 1969), interneurons fire at high rates and are rhythmically locked to specific phases of the LFP theta rhythm (McNaughton et al., 1983), and principal cells fire theta rhythmic bursts when animals are within the cells' spatial receptive field (O'Keefe and Dostrovsky, 1971; Muller et al., 1987; Ylinen et al., 1995; Csicsvari et al., 1999). During REM sleep, the LFP and neuronal activity patterns largely resemble those in awake mobility. In contrast, during slow-wave sleep (SWS) hippocampal LFP is characterized by delta (2–4 Hz) oscillations with intermittent sharp-wave ripples (∼200 Hz; Buzsáki et al., 1992). During sharp wave ripples, interneurons fire at high rates or are suppressed depending on subtype (Lapray et al., 2012; Varga et al., 2012; Varga et al., 2014) and principal cells fire spikes in temporally compressed sequences reflecting their sequential activation during prior experience (Buzsáki et al., 1992; Wilson and McNaughton, 1994).
Given the disparate activity of neurons across brain states, coupled with the propensity for seizures to selectively emerge from distinct brain states, it is interesting to consider to what extent previously reported preseizure changes were an indication of brain state transitions rather than of pathological changes. To test this directly, we recorded hippocampal network dynamics before spontaneous seizures in a chronic rat model of temporal lobe epilepsy and compared activity patterns between seizures emerging from distinct brain states. In addition, neuronal network activity was compared between seizure associated and non-seizure-associated brain states. Finally, we tested whether preceding brain state would have therapeutic relevance, which would strongly motivate the consideration of brain state dependence of seizures when developing seizure prediction algorithms and interventions that prevent seizures.
Materials and Methods
Subjects.
All experimental procedures were performed as approved by the Institutional Animal Care and Use Committee at the University of California–San Diego and according to National Institutes of Health and institutional guidelines. Epilepsy was induced in male Wistar rats (40 d of age; Charles River Laboratories) using a modified repeated low-dose kainate chronic model of temporal lobe epilepsy (Hellier et al., 1998; Fig. 1A). Thirty-six rats were treated with kainic acid (5 mg/kg, i.p.; Tocris Bioscience) each hour until the onset of status epilepticus, which was determined by >10 motor seizures per hour of class IV or V on the Racine scale (Racine et al., 1972). Six rats (17%) displayed apparent insensitivity to kainic acid and were euthanized. Status was maintained for 3 h, after which one dose of pentobarbital was administered (40 mg/kg pentobarbital, i.p.). Eight rats had fatal seizures during the induction (mortality rate of 22%). After the seizure induction protocol, the remaining 22 rats were housed individually and maintained on a reverse 12 h light/12 h dark schedule with lights off at 6:00 A.M. To confirm whether rats had developed chronic spontaneous seizures that define epilepsy, the animals were videomonitored for 4 h per day beginning at 2 months after kainic acid treatment. Video monitoring continued for a maximum of 9 months. If fewer than two seizures were observed during that time period, the animals were not used for the study (n = 11, 50%). Once two or more motor seizures of class III or greater on the Racine scale were observed, the animal was considered epileptic. Of the 11 rats that were classified as epileptic, six were used for electrophysiological experiments and seizures were observed during isolated single-unit recordings in four.
Surgical procedures and electrode placement.
Rats with confirmed chronic epilepsy (n = 6 rats, 6–8 months of age) were anesthetized with isoflurane (2–2.5% in O2) and an electrode assembly that consisted of 14 independently movable tetrodes was implanted above the right hippocampus (AP, 4.1 mm posterior to bregma; ML, 3.0 mm) and fixed to the skull using stainless steel screws and dental cement. Two screws were used as animal ground and were implanted to touch the surface of cortex anterior and lateral to bregma. Tetrodes were prepared by twisting 4 insulated platinum wires (diameter = 0.017 mm; California Fine Wire) together and melting the insulation to bind the four leads. Leads were plated with platinum before surgery to have stable impedances near 200 MΩ. Two tetrodes had all four leads shorted to be used for reference signals. One was left in the cortex and its signal was used as a differential signal and the other was advanced to the hippocampal fissure to record LFPs. The other 12 tetrodes were positioned to record hippocampal single units.
Data acquisition during monitoring in observation box.
Tetrodes were positioned above and in the CA1 cell layer to optimize the simultaneous recording of interneurons and principal cells. LFPs and single units were recorded for several hours each day while animals rested in a clear Plexiglas observation box (30 × 30 × 56 cm), which allowed for simultaneous videomonitoring of animal behavior (Fig. 1B). Each rat's chronic electrode implant was connected to a unity-gain operational preamplifier. The output of the preamplifier was conducted via a lightweight multiwire tether through a slip-ring commutator to a data acquisition system (Digital Lynx SX; Neuralynx) with 64 digitally programmable amplifiers. Unit activity was amplified and band-pass filtered between 0.6 and 6 kHz. Spike waveforms above a trigger threshold (40 μV) were time stamped and digitized at 32 kHz for 1 ms. The LFP was recorded continuously in the 0.1–900 Hz band from one of the wires of each tetrode. In three animals, after completion of CA1 recordings, tetrodes were advanced to the dentate gyrus (DG) and CA3.
Data acquisition during random foraging behavioral sessions.
Single units and LFPs were also recorded during behavioral experiments to provide conditions in which the animals experienced sustained periods of movement and thus sustained theta states (Fig. 1C). Animals were food deprived to 85% of their baseline weight and trained to forage for randomly scattered food reward (chocolate cereal crumbs) in open arenas. Open arenas were enclosed by either circular walls (diameter = 1.0 m, height = 0.5 m) or square walls (0.8 × 0.8 m, height = 0.5 m). Behavioral sessions consisted of two to four 10 min foraging sessions preceded and followed by resting sessions. The rats were also allowed to rest in a holding box for 5 min between foraging sessions. For position tracking, light-emitting diodes on the head-mounted preamplifier were tracked at 30 Hz by processing video images. In three cases, animals had seizures during foraging sessions. See Figure 1D for the amount of time each animal was monitored in the observation box and during random foraging behavioral sessions.
Statistics.
For each statistical comparison, normality was assessed with Lilliefors test and either parametric or nonparametric tests were chosen accordingly. Throughout the text, values are presented as mean ± SEM unless otherwise noted.
Defining seizure onsets.
For each seizure recorded during monitoring sessions in the observation box (33 seizures), the onsets for three phases of the seizure were defined: the onset of the electrographic seizure, the onset of stage III motor seizure, and the onset of ictal spiking (Fig. 2A). First, LFP traces were visually scanned for DC shifts and spikes offline and possible seizure start times were noted. Next, the corresponding video was observed to determine whether the suspected period was associated with a stage III, IV, or V seizure. Only stage III, IV, or V seizures (Racine scale) were analyzed because they were indisputably recognizable as behavioral seizures on the video. Five minute segments of the LFP trace and simultaneous video recordings before and immediately after the identified seizure were subjected to further analysis to identify the onset of the electrographic seizure, motor seizure, and ictal spiking. To determine the onset of the electrographic seizure, two independent observers (L.A.E. and C.A.) noted the moment when the LFP signal first looked abnormal according to criteria adapted from Bower et al. (2008). Briefly, abnormalities were characterized as one of the following: (1) a decrement of the amplitude of the signal, (2) a slow voltage deflection or “slow-wave,” or (3) low amplitude rhythmic activity. When the two noted electrographic onsets were within 2 s of each other, the earliest start time was used (27/33 seizures, “visual inspection method”). In the remaining 6 cases, the onset times that the observers noted differed by >2 s and an automated approach was used to detect a slow wave. The LFP signal was low-pass filtered (<1 Hz), rectified, and smoothed and the earliest slow-wave event was assigned as the onset of the electrographic seizure (6/33 seizures, “slow-wave method”). Stage III motor seizure start times were defined as the initiation of forelimb clonus in the video. Start times were calculated by averaging the times observed by two independent observers (L.A.E. and L.L.; the average discrepancy was 1.4 ± 0.18 s). The start of ictal spiking in the hippocampus was noted “by visual inspection” by two independent observers (L.A.E. and C.A.) looking for the earliest time that large rhythmic spikes were seen. The earliest value was used (see Table 1 for relative onset times for each identified seizure and Fig. 2B for a population summary). In three cases, seizures occurred during random foraging behavioral sessions, in which case there was tracking of head-mounted LEDs for position coordinates but no available video monitoring. For seizures during behavior, the seizure onset was assigned as the onset of the electrographic seizure using the visual inspection method detailed above. The onset of ictal spiking was also assigned. For these three seizures, the onset of stage III motor seizure is unknown (however real-time observation confirmed that the seizures evolved into at least stage III). These three cases allowed us to analyze neural dynamics before seizures that occurred during periods of sustained movement-related hippocampal theta oscillations and are treated separately.
Summary of seizures recorded in the observation box
Brain state during monitoring sessions in the observation box.
For each monitoring session, the tetrode with the largest theta (6–10 Hz) to delta (2–4 Hz) (θ/δ) power ratio was selected by performing spectral analysis of the LFP using the Chronux package (www.chronux.org). The spectrogram was calculated over the frequency range of 1–20 Hz for the entire monitoring session using a sliding 10 s window that stepped in increments of 1 s. Next, the θ/δ ratio for each second of the spectrogram was calculated by dividing the average power in the 6–10 Hz frequency range by the average power in the 2–4 Hz frequency range. As reported by several other groups, the θ/δ ratio is a reliable indicator for distinguishing non-theta from theta periods (Csicsvari et al., 1999; Sedigh-Sarvestani et al., 2014). Theta periods were defined as times when θ/δ ratios were elevated >2 for at least 10 s. Theta periods that were separated by dips below threshold that lasted <10 s were assumed to be part of the same epoch and were therefore joined. Theta periods were further analyzed by visual inspection of the corresponding video segment to determine whether the animal was awake and moving or quietly resting. Awake behavior was defined as either grooming or walking around in the observation box. Resting was defined as no movement of any limbs or the tail, but included phasic movements of the head such as whisking, chewing, eye movements, and head nods. Such head movements are consistent with REM sleep (Montgomery et al., 2008). Cases in which the animal was primarily resting but had a few limb movements (e.g., when the animal rearranged its sleeping position) were categorized as “ambiguous.”
Cell sorting and cell tracking.
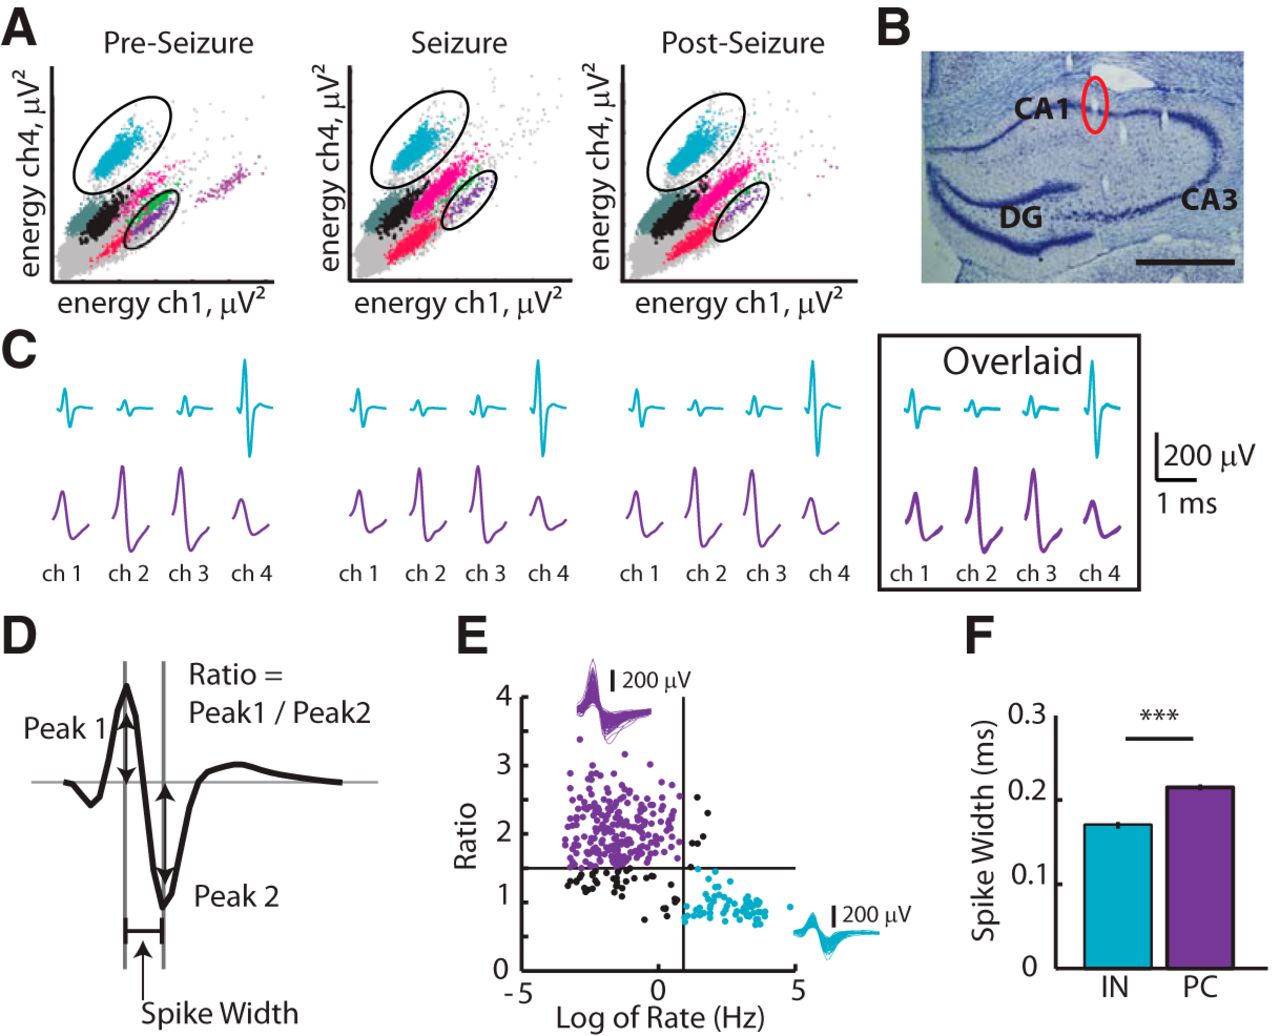
Single units were manually sorted using MClust (version 3.5, written by A. David Redish; http://redishlab.neuroscience.umn.edu/MClust/MClust.html). Because our study depends on stable unit recordings, we confirmed that we could track the same set of cells from a period at least 1 h before any seizure (when cell type was defined) until after seizure events using a customized version of MClust (Mankin et al., 2012). Clusters that persisted in the same region of parameter space throughout a seizure event were accepted for analysis, which included the time before, during, and after a seizure event. In other words, the action potentials of a given neuron included in the analysis did not change shape, were distinct from noise signals, and remained inside the cluster boundary such that observed rate changes could not be attributed to the definition of the cluster boundaries (Fig. 3A–C).
Cell classification.
Neurons were classified as putative interneurons versus putative principal neurons using a criterion applied to the relationship between spike ratio and spike rate (Csicsvari et al., 1999; Fig. 3D,E). For each monitoring session in the observation box, cells were recorded during a 5 min quiet period, during which the animal was resting ∼1 h before any seizure event was recorded. This was done to minimize any potential seizure-related contamination of spike rate or waveform shape. Mean spike rates and spike ratios were calculated from signals recorded during the quiet seizure-free period and cells were classified accordingly. The calculation was as follows:
 Extracellular recordings of action potentials (spikes) were inverted. Spike waveforms are biphasic with an early upward peak (peak1) and a later downward peak (peak2). The amplitude of the first peak is related to the rise time of the depolarization and the amplitude of the second peak is related to the decay time of repolarization (Henze et al., 2000). Spike ratios are thus approximately equal to 1 for cells that have comparable rates of depolarization and repolarization and interneurons rather than principal cells are known to have repolarization rates that are approximately equal to depolarization rates. Putative interneurons (n = 62) were considered cells that had spike rates >2.5 Hz (mean; 20.0 ± 2.3 Hz) and spike ratios <1.5 (mean; 0.93 ± 0.02). Putative principal cells (n = 219) were considered cells that had spike rates <2.5 Hz (mean; 0.37 ± 0.03 Hz) and spike ratios >1.5 (mean; 2.1 ± 0.03). To further validate the classification of single units into one of the two groups (interneurons versus principal cells), we measured the spike widths of the different cell populations. As expected, putative interneurons had significantly narrower spike waveforms compared with putative principal cells (spike width mean; 0.17 ± 0.01 vs 0.22 ± 0.01 ms respectively; p ≤ 0.01; Fig. 3F). Henceforth, we will refer to the two groups as simply interneurons and principal cells. A heterogeneous group of cells that met one criterion but not the other were grouped as “other” and likely comprises a mixture of principal cells and non-fast-spiking interneurons (n = 61). “Other” cells were not included in subsequent analysis. For analysis of neuron dynamics before seizures, cells classified during quiet periods were tracked across the seizure event. Only cells identified before, during, and after seizures were included in seizure dynamics analysis because the recording parameters were determined to be stable. Cell identity was not tracked across multiple seizures detected in the same animal; instead, units were considered independent for each seizure period. Cells recorded from individual subfields of the hippocampal formation were pooled in this study (interneurons: CA1, n = 59, CA3, n = 7, DG, n = 5; principal cells: CA1, n = 189, CA3, n = 30, DG, n = 0; Table 1).
Preseizure spike rates of individual cells.
Spike times of individual neurons were binned (bin = 1 s) to determine spike rates (Hz) before, during, and after seizure events. Baseline rate distributions were calculated for a 20 s segment from 100 to 80 s before the transition of interest (either the onset of a seizure from SWS or a transition from SWS to REM sleep). To assess changes from REM states, a baseline from 40–20 s before the transition from REM sleep to the seizure was used. Subsequent rates with z-scores >2.5 or <−2.5 were considered significant deviations from baseline.

Spike rates at brain state transitions.
For assessing firing rate changes at transitions into REM sleep and seizure-associated REM (SA-REM) sleep, firing rates of interneurons and principal cells were aligned to the onset of REM and SA-REM (defined when the θ/δ ratio first exceeded a value of 2). Because REM sleep duration varies, in a separate analyses, firing rates were aligned to either the offset of REM sleep (when the θ/δ ratio decreased below a value of 2) or, for SA-REM, to the onset of electrographic seizure. Spike rates were binned in 20 s intervals for analysis.
Spike rate comparisons between brain states.
For individual neurons that could be tracked between REM sleep periods and SA-REM sleep periods (n = 102 principal cells, n = 27 interneurons), spike rates were averaged over the first or last 20 s of the respective periods and compared; 20 s was used to accommodate variable lengths of REM duration. For comparisons between REM sleep and movement periods, 20 s of random foraging was selected for movement during which animals had sustained θ/δ ratios >2. For individual neurons that could be tracked between REM sleep and movement (n = 53 principal cells, n = 20 interneurons), spike rates were averaged over the 20 s of the respective periods and compared.
Theta phase preference of interneurons.
Theta phase was determined over the same periods of recording used for firing rate comparisons between brain states. First, the tetrode with the highest θ/δ ratio was selected for analysis of LFP theta. For each spike time, the instantaneous phase of theta was calculated using a Hilbert transform. For each interneuron, the distribution of spike phases was tested for nonuniformity using a Raleigh test. Only neurons that had significant nonuniformity (preferred phase of firing) were included in analysis. For comparison of phase preference across brain states, average phase for each neuron was calculated.
Histology and reconstruction of electrode tracks.
Once electrophysiological experiments were concluded, all rats received an overdose of sodium pentobarbital. Animals were perfused intracardially with 1× PBS followed by 4% paraformaldehyde (PFA) in PBS. Brains were extracted and stored overnight in the PFA solution and then transferred to 30% sucrose in PBS. Brains were sectioned using a freezing microtome. Forty-micrometer-thick coronal sections were cut through the segment of the hippocampus with electrode tracks and each section was stained with cresyl violet. The tetrode positions were determined from reconstructing the positions of all tetrodes across serial sections. A small angular deviation between the plane of sectioning and the electrode tracks resulted in an apparent shift of the tissue damage between sections (Leutgeb et al., 2005). The electrode tip was considered to be located in the section where the tissue damage was most posterior. In the animals that had serial recordings from CA1 and deeper structures (CA3 and DG), the final position would only be informative for the second recording site. In those cases, the CA1 recording site was confirmed by verifying that the path of the tetrode track passed through the CA1 subregion. In addition, the distance of advancement through the tissue between the two recording sites was calculated and compared with the distance that the tetrode was advanced through the tissue after recordings from the first hippocampal neuronal cell layer. Recordings from a tetrode were included in the data analysis if the tetrode was determined to be in the CA1, CA3, or DG at that time of recording.
Optogenetic curtailment of seizures.
Analysis was performed on a previously published dataset; see Krook-Magnuson et al. (2013) for details of animal model, online seizure detection, and optogenetic stimulation parameters. We focused our analysis on a selection of seizures that were already detected by the online detection described in that study. In that dataset, 50% of detected seizures triggered an optical stimulation that activated parvalbumin-positive interneurons. We classified whether seizures were preceded by theta or non-theta states using the algorithm described above (see “Brain State during monitoring sessions in the observation box”). For each seizure, we then calculated the duration of the seizure defined as the start and stop of ictal spiking as determined by visual inspection of an observer who was blinded to whether the seizure received a light-triggered interruption. Statistics were performed on distributions of seizure durations for four cases: non-theta, no light; non-theta, light; theta, no light; and theta, light.
Results
To study the relationship between brain state and single-unit activity in the hippocampus before spontaneous motor seizures, we used the low-dose kainate model of temporal lobe epilepsy (Hellier et al., 1998; Fig. 1A). Rats with chronic epilepsy; that is, those observed to have had >2 spontaneous motor seizures, were selected for chronic electrophysiological recordings (n = 6). Over the course of several weeks, independently movable tetrodes were placed in or near principal cell layers to record hippocampal LFP and single units. Animals were monitored in an observation box or during random foraging sessions to ensure the recording of hippocampal activity during various behavioral states such as sleep and sustained running (Fig. 1B,C). In total, single units were recorded during 33 spontaneous seizures that occurred during monitoring sessions in the observation box in four of six rats (four seizures in rat 443; five seizures in rat 480; 13 seizures in rat 617; and 11 seizures in rat 485; Fig. 1D). In addition, we recorded three seizures that occurred during random foraging sessions while animals actively foraged for food in an open arena (one seizure in rat 443; one seizure in rat 617; and one seizure in rat 485; Fig. 1D).

Experimental design and seizure frequency. A, Timeline of the epilepsy model and recording device implantation. At 40 d of age, animals were induced with serial injections of kainate until they experienced status epilepticus. Several months later, a subset of animals that experienced >2 spontaneous motor seizures were implanted with a hyperdrive recording device. B, Setup for monitoring sessions in the observation box. Video and electrophysiological data were recorded simultaneously. C, Experimental design for recordings during behavior. Animals were trained to randomly forage for sweetened cereal. During foraging, electrophysiological data were recorded and position was tracked. D, Recording schedule and seizure distribution for each animal included in the study. Day 1 defines the first day with stable single-unit recording. Recording schedule is shown for CA1 recordings (4/4 animals) and subsequent CA3 recordings (3/4 animals). White boxes represent a 30 min block of video monitoring (see B) and cyan boxes represent a 45 min behavioral recording block (see C). Seizure occurrences are marked by red ticks.
To investigate the neural dynamics that precede seizure activity in the dorsal hippocampus, we sought to define the earliest detectable component of seizures in our rat model. We determined the onset of the electrographic seizure (ES) as described in the Materials and Methods (Fig. 2A) and found that the ES onset was always the earliest component of the seizure and preceded the generalized motor seizure for each case (on average by 4 ± 1 s; Fig. 2B). Because our recordings were targeted to dorsal hippocampus, we could not verify the seizure focus for each animal; however, the time difference between the ES and motor seizure indicates that we were able to measure seizure dynamics at a time point before generalization. Others have examined single-unit activity in relation to the onset of ictal spiking (Grasse et al., 2013), so we also defined that time point in our model for comparison and found that ES onset preceded ictal spiking in each case (on average by 12 ± 1 s; Fig. 2B). In summary, a typical spontaneous seizure in our rat model started with an electrographic change in the hippocampal LFP, such as a slow wave or sudden attenuation of the signal amplitude. Within a few seconds of this change, the animal's motor seizure evolved to a stage III motor seizure as detected with simultaneous video monitoring. Meanwhile, the LFP continued to be marked by low-amplitude activity that, after several seconds, evolved into larger amplitude ictal spikes (>1 Hz).

Electrographic seizures precede motor seizures and ictal spiking in hippocampal LFP. A, Example seizure recorded in the hippocampus showing the onset of the electrographic seizure as determined by visual inspection (red line), the first sign of stage III motor seizure (black line), and the onset of ictal spiking (green line). Top trace, The broad-band signal (0.1–900 Hz) was used to estimate the onset of ictal spiking. Bottom trace, To estimate the onset of the electrographic seizure, the signal was low-pass filtered (<1 Hz), rectified, and smoothed for finding the largest amplitude, slow voltage change or slow wave. When two independent observers marked the onset of the electrographic seizure within 2 s of each other, the earliest value was taken and the seizure onset was said to be determined by visual inspection (seizure shown in A is a representative example of the 27/33 seizures determined by visual inspection). In cases when visual observations were not within 2 s of each other, automated detection of the time of the slow wave was used (6/33 seizures). B, Left, Time difference between electrographic seizure and stage III motor seizure (positive values indicate that electrographic seizure onset preceded stage III motor seizure). Right, Time difference between electrographic seizure onset and ictal spiking (positive values indicate that electrographic seizure onset preceded ictal spiking).
Seizures are more likely preceded by REM sleep than by SWS or waking states
Next, we determined the brain states from which spontaneous seizures emerged. In sleeping animals, delta (2–4 Hz) occurs during SWS and theta (6–10 Hz) occurs during REM sleep. In awake animals, theta occurs during periods of movement or during attentive behaviors. To distinguish among SWS, REM sleep, and waking, we first determined the behavioral state of the animal as either immobile or moving and then defined the oscillatory dynamics of the hippocampal LFP as either theta for θ/δ >2 or non-theta for θ/δ <2 (see Materials and Methods for detailed procedures). The brain state for the animal was then classified for each second of the monitoring session as REM sleep (behavior: immobile; LFP: theta), SWS (behavior: immobile; LFP: non-theta), or awake (behavior: moving; LFP: theta; Fig. 4A).

Isolation and classification of hippocampal single units. A, Example tetrode recordings from the CA1 pyramidal layer show that hippocampal single units were well isolated and separated before, during, and after motor seizures. The energy (i.e., the area under the amplitude curve) of spike waveforms that were recorded within a 1 ms time window (see D) was calculated and a scatterplot for the energy on two (ch1, ch4) of the four recording channels is shown. For each tetrode channel, the amplitude and energy of spikes that are generated by action potentials of individual cells tends to be consistent over time; the spikes from each cell thus appear in clusters within each scatter plot. All dots within a cluster that was assigned to a cell are shown in the same color and waveforms that did not clearly separate from noise and that were not included into the analysis are shown in gray. Within the 5 min before the motor seizure (Pre-Seizure), the 5 min throughout and immediately after the motor seizure (Seizure), and the five subsequent minutes (Post-Seizure), clusters remained in a stable position within the parameter space such that individual cells could be tracked throughout the entire recording period. Pronounced changes in firing rate result in differences in the density of the dots but not in their relative position in the parameter space. B, Coronal section through the area of the hippocampus with tetrode tracks. The tetrode position for the recordings in A is highlighted. Scale bar, 300 μm. C, For the two clusters circled in the corresponding panel in A, the average waveform shape on each of the four tetrode channels (ch1-ch4) is shown. Cyan is a putative interneuron and purple is a putative principal cell. Average waveforms from the three periods were overlaid to show the consistency of the signal throughout the period around and during the seizure event. D, Schematic of an extracellular single-unit spike illustrating the parameter (ratio) that was used to classify each neuron as either a putative interneuron or a putative principal cell and the parameter (spike width) that was used to verify the classification. E, Spike ratio is plotted versus spike rate for each single unit. Vertical line corresponds to a rate of 2.5 Hz and horizontal line corresponds to a ratio of 1.5. Cyan-filled circles show putative interneurons and purple-filled circles show putative principal cells. Insets, Overlaid average waveforms for principal cells (top) and for interneurons (right). F, Interneurons and principal cells classified as shown in E have significantly different spike widths ***p ≤ 0.001, unpaired t test.

Seizures preferentially followed REM sleep states. A, The method for determining brain state is shown for a 5 min example LFP trace that was recorded in the observation box. From top to bottom are shown: raw LFP trace with insets of representative 1 s segments to facilitate visualization of theta (a, c) and non-theta (b) epochs. The time-frequency spectrograms of the LFP were calculated. For each second of the spectrogram, a θ/δ ratio of >2 (red horizontal line) was used to determine transitions in and out of theta epochs (vertical gray and black lines, respectively). The behavior of the animal during the corresponding time was determined by scoring the behavioral state in video recordings as either immobile (gray boxed time) or moving (white boxed time). By using LFP theta and behavior, the brain state was classified as SWS (dark blue), REM sleep (green), or awake (orange). B, Left, The distribution of brain states in the monitoring box using the criteria shown in A. Right, The distribution of brain states that preceded seizures. States were determined for the 2 min preceding the seizure onset using the same criteria as shown in A. Amb., Ambiguous. C, Seizures were preceded by an unexpectedly high proportion of REM states and an unexpectedly low proportion of SWS states. Shown is a χ2 table corresponding to the pie charts in B. The observed number of seizures emerging from REM sleep was more than expected by the time spent in REM states. D, Distribution of REM sleep durations. Bold numbers above bars indicate the number of REM sleep epochs of a particular duration that preceded a seizure.
Using the criteria described above, the extent of time that each animal spent in a particular brain state was quantified. Animals were monitored for a total of 4484 min in the observation box (refer to Fig. 1D for distributions per animal). Of these, the animals spent 86% of the time in SWS, 8% of the time awake, 5% of the time in REM sleep, and <1% of the time in ambiguous states (Fig. 4B). The 33 seizures that occurred during the time in the observation box were not distributed across brain states, as would be expected according to the frequency of brain states (Fig. 4C; χ2 = 133.8, df = 2, p ≤ 0.01). For 16 of the 33 seizures, the minutes just before the seizure were characterized by REM sleep, even though only approximately two seizures would be expected to be associated with that brain state according to the percentage of time in REM sleep. Conversely, 13 seizures were preceded by SWS versus ∼28 that would be expected based on the percentage of time in SWS (Fig. 4C). The propensity of seizures to be preceded by REM sleep is consistent with recent findings using a different rat model of chronic epilepsy (Sedigh-Sarvestani et al., 2014). Consistent with that study, there was no significant difference between the duration of REM epochs associated with seizure (SA-REM) compared with REM sleep not associated with seizure [SA-REM median, 72.5 s; interquartile ratio (IQR), 33.5–115.5 s; n = 16; REM median, 46.5 s; IQR, 28–88 s; n = 216; n.s., Wilcoxon's rank-sum test; Fig. 4D]. This is consistent with the interpretation that seizures predominantly emerge at the end of REM sleep and at approximately the time when a transition from REM sleep to SWS would be expected.
Hippocampal network activity dynamics before seizures remain characteristic of preceding brain state
As mentioned above, hippocampal networks oscillate at theta frequency during REM sleep (note the power in the 8 Hz band; Fig. 4A). In contrast, during SWS sleep, hippocampal networks participate in delta, which occurs along with sharp wave events (note the large amplitude fast events in the LFP during periods with θ/δ <2, Fig. 4A). The differences in LFP activity between REM sleep and SWS are associated with major differences in neuronal firing patterns. Therefore, to investigate to what extent the spiking patterns of individual neurons deviated from the expected hippocampal neural network dynamics for the current brain state before seizures, we analyzed seizures emerging from SWS and seizures emerging from REM sleep separately. This allowed us to distinguish whether single-unit rate changes before seizures indicate pathological network processes preceding hippocampal seizure activity, or alternatively, retain the normal dynamics for the current brain states.
We categorized single units as recorded during seizures preceded by either SWS or REM sleep and also distinguished between interneurons and principal cells (see Materials and Methods and Fig. 3). For seizures that were preceded by SWS, interneuron and principal cell firing rates did not deviate from levels normal for SWS (Fig. 5A,B; see Table 2 for detailed statistics). To test whether the apparently unchanged mean firing rate could have arisen from opposing changes in individual neuron firing rates, we calculated the percentage of neurons that increased or decreased their firing rate from a 20 s baseline period of SWS 1.5 min before the seizure (Fig. 5C,D). Individual principal cells did not significantly change rate before seizure; however, a subpopulation of interneurons changed rates near the onset of the ES (|z-score| >2.5). One second before the ES, 21% of interneurons significantly decreased rate and 2 s after, similar percentages of interneurons had increased and decreased rates. Interneuron rate changes in the early phase of seizures preceded by SWS would still precede generalization into a motor seizure and the onset of gross LFP signatures such as ictal spiking and therefore may have potential value for early detection of seizures.

The activity of a subpopulation of interneurons deviated from normal at the onset of the electrographic seizure preceded by SWS. A, Top to bottom, Hippocampal LFP recording, spike raster of interneurons and principal cells (cyan and purple, respectively), and average rate changes compared with baseline for a seizure emerging out of SWS. Start of ES is marked by vertical red line. B, Top to bottom, Time-frequency spectrograms of LFP power, mean interneuron rate (cyan line), and mean principal cell rate (purple line). Shading around the mean rates is SEM. Plots are aligned to the onset of the electrographic seizure (vertical red line, ES). Statistics on firing rate changes were performed on 20 s binned medians and compared with baseline rate (BL). No significant changes were found (Wilcoxon's signed-rank test with Bonferroni's correction for multiple comparisons). C, For seizures emerging out of SWS sleep, percentage of interneurons (cyan) and percentage of principal cells (purple) that exhibited rate increases of >2.5 SDs over BL (A) during each second from 30 s before to 30 s after electrographic seizure onset (red line, ES). D, Same as shown in C but percentage of interneurons and principal cells that exhibit significant rate decreases (z-score <−2.5).
Firing rate distributions for interneurons and principal cells during brain state transitions
For seizures preceded by REM sleep, we considered that REM states typically only last for ∼1 min (median time of transition relative to ES was 72.5 s, n = 16 seizures; Fig. 4D) and follow a brain state transition from SWS, which in healthy animals is known to correlate with increases in spiking activity (Grosmark et al., 2012). We therefore first considered the neuronal dynamics at the transition into and out of REM states that were not associated with seizures. Interneurons showed a gradual increase in firing rate over the 30 s before the transition into REM sleep (p ≤ 0.001). This increase was sustained throughout REM and decreased by 30 s after REM sleep offset (p ≤ 0.001). In contrast, the firing rates of principal cells remained unchanged through the transition into and out of REM sleep (Fig. 6A, Table 2). Examination of individual neuron dynamics revealed that 33% of interneurons participated in the gradual sustained increase at the transition into REM sleep (z-score >2.5; Fig. 6B). Interestingly, 26% of interneurons transiently exceeded the already high REM rates during the 2 s before the transition out of REM sleep (Fig. 6C). However, this event was too transient to be captured in the average activity over 20 s shown in Figure 6A.

Rate increases of interneurons minutes before seizures preceded by REM sleep reflect brain state transitions to REM sleep. A, Top to bottom, Time-frequency spectrograms of LFP power, mean interneuron rate (cyan line), and mean principal cell rate (purple line). Shading around the mean rates is SEM. Plots are aligned to the onset of REM (vertical blue line) and to the onset of ES (vertical red line). The time break (parallel slashes) is used to align to both time points despite the differences in REM duration. Statistics on firing rate changes were performed on 20 s binned medians and compared with baseline rate (BL). B, Percentage of interneurons (cyan) and principal cells (purple) that exhibited rate increases (top) or decreases (bottom) of >2.5 SDs over baseline activity (BL, in A, left) during each second from 100 s before and 20 s after the transition from SWS to REM sleep marked by blue vertical line. C, Percentage of interneurons (cyan) and principal cells (purple) that exhibited rate increases (top) or decreases (bottom) of >2.5 SDs over baseline activity (BL, in A, right) during each second from 40 s before and 80 s after the transition from REM sleep to SWS marked by vertical gray line. D–F, Same as A–C, but for transitions in and out of seizure-associated REM states. Vertical red line marks seizure onset. *p ≤ 0.05, **p ≤ 0.01, ***p ≤ 0.001, Wilcoxon's signed-rank test with Bonferonni's correction for multiple comparisons, all comparisons were made against the baseline period (BL) of the respective panel.
To assess neuron dynamics for REM sleep that was followed by seizures (Fig. 6D), we performed the same analysis as for the SWS-REM transitions that were not associated with seizures. Qualitatively similar to REM transitions not associated with a seizure, 30 s before the transition into SA-REM sleep, interneuron firing rate increased (p ≤ 0.01) and principal cell rates remained constant (Fig. 6D, Table 2). Individual neuron dynamics also appeared similar, with 22% of interneurons showing gradual sustained rate increases preceding the transition into REM sleep (Fig. 6E). Together with an average REM duration of ∼1 min (Fig. 4D), these data suggest that a rate increase of interneurons during the minutes before seizures preceded by REM was not pathological, but rather corresponds to a typical brain state transition from SWS to REM.
To investigate whether there may be differences in REM dynamics as the seizure approached, we aligned spiking activity to the seizure onset and examined the firing rates during the REM period 30 s before the ES onset (Fig. 6D, right). Average interneuron and principal cell rates remained at the level that was characteristic for REM leading up to the onset of the ES, followed by a substantial decrease during the seizure (p ≤ 0.01; Fig. 6D). Similar to the individual neuron dynamics seen at the REM to SWS transition, a subpopulation of interneurons (23% of interneurons, z-scores >2.5) transiently increased their rate even beyond the high level within REM (Fig. 6F). The increase occurred ∼14 s before the first sign of the ES. These data indicate that the predominant network activity leading up to seizures is consistent with those seen in normal brain states and the transition between states.
Neuron dynamics do not differ between SA-REM sleep and REM sleep not associated with a seizure
Although we describe a propensity for seizures to be preceded by REM sleep, it was not the case that all REM sleep periods led to seizures. Either SA-REM is unique and distinct from other REM periods or all REM periods are generally more seizure prone and more readily progress to a seizure state in the epileptic brain. Qualitative comparison between SA-REM sleep and REM sleep suggests that average single-unit activity is similar between the two states (cf. Fig. 6A–C, D–F). However, it is possible that the activation of individual neurons differs when a seizure is about to emerge from a REM state. We therefore compared directly single neurons that could be identified and tracked across SA-REM and REM sleep. The analysis was performed separately for the early and late phases of REM sleep (Fig. 7). In early REM, principal cell firing rates were slightly lower in general REM sleep compared with SA-REM sleep (median difference, −0.05 Hz; IQR, −0.2 to 0.04 Hz, p ≤ 0.006, n = 102 principal cells), but there was no difference in the percentage of active principal cells (n.s., Wilcoxon's rank-sum test; Fig. 7A). In interneurons, there was no difference in firing rates between early SA-REM sleep and REM sleep (median difference, 1.8 Hz; IQR, −0.2 to 5.1; n = 27 interneurons; Fig. 7B). Perhaps more unexpectedly, the activity patterns of interneurons and principal cells in the late phase of REM and SA-REM were also indistinguishable (Fig. 7C,D). Therefore, individual interneurons experienced similar magnitudes of rate change throughout REM sleep, which suggests that the overall inhibitory tone remained similar between REM and SA-REM.

Hippocampal firing rates during REM sleep that is not associated with seizures are predominantly similar to firing rates during seizure-associated REM sleep. A, During the early component (first 20 s) of SA-REM compared with other REM periods, the firing rates of principal cells were slightly higher. Left, Each dot corresponds to an individual principal cell that was tracked between SA-REM and REM sleep periods. The identity line (black) is indicated in the scatterplots. Insets display the corresponding boxed data with the axis stretched to reveal overlapping data points. Middle, Distribution of rate difference between REM and SA-REM for principal cells. **p ≤ 0.01, sign test. Right, Cumulative distributions of principal cell rates in SA-REM (dotted line) and REM (solid line) show that the difference in firing rate between REM and SA-REM is predominantly due to minor firing rate differences of cells with low rate (<0.1 Hz). B, Same as shown in A but for comparisons of interneurons (INs) that were tracked between REM and SA-REM. Again, the early component was compared. For INs, there were no rate differences between the two brain states. n.s., Not significant, sign test. C, Principal cell comparisons like shown in A but for the late component of REM (last 20 s) and SA-REM (20 s of REM leading up to the seizure). D, Interneuron comparisons like shown in B but for the late component of REM (last 20 s) and SA-REM (20 s of REM leading up to the seizure).
In the hippocampus, many interneuron subtypes are strongly theta modulated and have a preferred theta phase for which they fire (Fig. 8A). Therefore, to test whether the temporal structure of inhibition was altered in SA-REM sleep, we compared the preferred theta phase of interneurons between REM sleep and SA-REM sleep. Similar numbers of interneurons were theta modulated in REM sleep (18/26) and in SA-REM sleep (19/26; p ≤ 0.05 Raleigh test) and there was no difference in phase preference (median difference, −2 degrees; IQR, −10.1 to 3.6 degrees; n.s., sign test, n = 16 interneurons; Fig. 8B,C). The minor difference in principal cell firing rates between early SA-REM sleep and REM sleep and the lack of a difference in late REM phases, along with the lack of difference in interneurons rates and timing under the same conditions, suggests that SA-REM sleep and REM sleep engage hippocampal single units in a similar manner. In our seizure model, we were therefore not able to identify prominent differences between SA-REM and REM sleep, which suggests that network activity patterns that define REM periods or the transition out of REM are generally more susceptible to seizure activity.

Theta phase preference of interneurons was consistent between SA-REM sleep, REM sleep, and movement. A, The spiking activity of a representative interneuron (cyan ticks) is in phase with ongoing LFP theta oscillations (gray line, raw trace; black line, band-pass filtered between 6 and 10 Hz). B, Example phase preference of two hippocampal interneurons (top and bottom boxes) across REM sleep, SA-REM sleep, and awake movement (Awake). Note that the phase distributions (plotted on a polar axis spanning the 360 degrees of a theta cycle) approximately match across the three theta brain states. C, For each interneuron, the mean phase preference in REM sleep is plotted against the mean phase preference in SA-REM sleep. Each dot corresponds to an interneuron. D, The same as shown in C, but comparing REM sleep with awake movement.
REM sleep and movement are theta brain states with different levels of excitatory neural activity
To gain insights into potential differences in network activity that would promote seizures in one theta state (REM sleep) but not another (awake movement), single-unit activity between the two states was compared directly. First, to be certain that awake movement did not also alter seizure frequency, the analysis was expanded beyond the time in the observation box to include sustained periods of movement in random foraging experiments. When combining periods of movement in the open field and in the observation box, 7 seizures were observed, which was consistent with movement having no effect on promoting seizure frequency; the number of observed seizures (7/36) was as expected from the amount of time spent in movement (22% of time spent in movement; χ2, 0.16; df, 1, n.s.). We then compared directly the firing rates of cells that were tracked between movement and REM sleep. Principal cells exhibited higher firing rates in REM sleep (0.38 ± 0.1) compared with movement (0.23 ± 0.06 Hz; median difference, 0.05 Hz; IQR, −0.01 to 0.14 Hz; p ≤ 0.02, sign test, n = 53 principal cells), as well as decreased sparsity (percentage of cells with rates >0.05 Hz; movement, 19/53, 36%; REM sleep 31/53, 58%), which was reflected as a difference in median firing rate (p ≤ 0.02; Fig. 9A–C). In the case of interneurons, there were no differences in firing rates between movement and REM sleep when considering all interneurons (median difference of −2.12 with IQR of −6.6 to 6.31, n.s., sign test, n = 20 interneurons; Fig. 9D–F). However, a subpopulation of interneurons (7/20) had significantly different rates in REM sleep compared with movement (p ≤ 0.05, Wilcoxon's rank-sum test with Bonferonni's correction for multiple comparisons), with 6/7 having lower rates in REM sleep (Fig. 9D). For interneurons that were theta phase modulated in REM sleep and movement, we found no difference in theta phase preference (median difference of 6.9 degrees with an IQR of −7.0 to 20.9 degrees, n.s., sign test, n = 12 interneurons; Fig. 8B,D). Single-unit activity levels are consistent with REM sleep being more hyperexcitable than movement, with more principal cells activated and a subpopulation of interneurons having lower firing rates in REM sleep. Such reduced inhibition of principal neurons may underlie a greater propensity for seizures to emerge from REM sleep compared with movement, even though both are theta states.

The firing rates of principal cells were increased during REM sleep compared with awake movement. A, Principal cells have higher firing rates during REM compared with awake movement (Awake), as illustrated by the larger number of dots below the identity line (black). Each dot corresponds to an individual principal cell that was tracked across REM and awake movement. Insets display the corresponding boxed data with the axis stretched to reveal overlapping data points. B, Distribution of principal cell rate difference between periods of REM and movement. *p ≤ 0.05, sign test. C, Cumulative distributions of principal cell firing rates in movement (orange line) and REM (green line) reveal that there are fewer cells with low firing rates during REM. *p ≤ 0.05, Wilcoxon's rank-sum test. D–F, Same as shown in A–C, but for interneurons (INs) for which there were no rate differences between the two brain states; however, there was a subset of INs that had significantly different rates between movement and REM states denoted by open circles in D (p ≤ 0.05, Wilcoxon's rank-sum test with Bonferonni's correction for multiple comparisons).
Preceding brain state determines success of seizure intervention
Our results indicate that neural dynamics preceding seizures predominantly follow patterns that would be expected given the preceding brain state or brain state transition. This implies that the large differences in single-unit activity between SWS and REM sleep, which may well influence seizure generation and spread, are retained before seizures. We therefore investigated whether preceding brain state exerted any influence on the success of therapeutic seizure intervention. Because seizure intervention with optogenetics in chronic temporal lobe epilepsy has only been performed successfully in mice, we analyzed the effect of brain state on seizure intervention in a mouse intrahippocampal kainate model. In this model, spontaneous seizures were shown to be frequent and optogenetic stimulation of parvalbumin-positive (PV) interneurons was shown to effectively curtail seizure duration (Krook-Magnuson et al., 2013). We classified seizures as emerging from theta (35 seizures, four animals) versus non-theta states (308 seizures, four animals; Fig. 10A,B). Different from the rat low-dose kainate model and the rat tetanus toxin model (Sedigh-Sarvestani et al., 2014), more classified seizures emerged from non-theta states than theta states in the mouse intrahippocampal kainate model (Fig. 10C). There were nonetheless a sufficient number of seizures that emerged from each state, which allowed for a comparison of the success of optogenetic curtailment of seizures that emerged from the two different brain states. Light stimulation of PV interneurons successfully curtailed seizures emerging from non-theta states (p ≤ 0.001; Fig. 10D), whereas light intervention had no effect on seizures emerging from theta states (Fig. 10E). Furthermore, it was not the case that the duration of seizures emerging from theta states compared with non-theta states was already shorter and therefore could not be curtailed further (Fig. 10F). There was no difference in duration between seizures emerging from theta regardless of whether they were light stimulated and seizures emerging from non-theta that were not light stimulated. These results support the idea that preceding brain state determines the effectiveness of a particular type of intervention.

The effectiveness of optogenetic curtailment of seizure duration was determined by preceding brain state. A, For seizures that emerged from a non-theta state, the time-frequency spectrogram of hippocampal LFP before seizures did not show a clear band of power in the theta range (6–10 Hz). Vertical red line indicates seizure onset. B, Same as shown in A, but for a seizure that emerged from a theta state. Note the clear band of power at 7 Hz. C, In the intrahippocampal kainate model, 89.8% of analyzed seizures emerged from non-theta states (308 seizures, 4 animals) and 10.2% emerged from theta states (35 seizures, 4 animals). D, Optogenetic activation of PV interneurons successfully curtailed seizures that emerged from non-theta states. Seizure durations were shorter with light intervention (blue line, 154 seizures) than without light intervention (black line, 154 seizures; ***p <0.001, two-sample K-S test). E, Optogenetic activation of PV interneurons did not curtail seizures that emerged from theta states. Seizure durations with light intervention (blue line, 18 seizures) and without light intervention (gray line, 17 seizures) did not differ (n.s., two-sample K-S test). F, The durations of seizures emerging from theta states (with or without light intervention, blue and gray line redrawn from E did not differ from the durations of seizures emerging from non-theta states without light intervention (black line, redrawn from D).
Discussion
In light of the increased attention on using single-unit activity for the prediction of seizure onset and closed-loop seizure intervention, our findings emphasize that monitoring brain state is critical for interpreting network activity before seizures. Specifically, we found that changes in unit activity recorded in dorsal hippocampus before seizures was not pathological, but rather indicated changes in normal brain-state-dependent patterns of activity. In the case of seizures preceded by REM sleep, we discovered that interneuron rate increased at REM onset regardless of whether REM was followed by seizures or by a transition back to SWS. This result is particularly relevant for the interpretation of neuronal rate changes in advance of seizures preceded by REM sleep given that REM sleep has a propensity for preceding seizures in two separate rat models of chronic temporal lobe epilepsy (Fig. 4 and Sedigh-Sarvestani et al., 2014). Several in vitro studies have suggested that increases in interneuron activity would be expected to precede seizures (Trevelyan et al., 2007; Lasztóczi et al., 2009; Zhang et al., 2012; Shiri et al., 2015). When such pre-ictal increases were observed in vivo, they were therefore interpreted to be pathological indicators of oncoming seizures (Bower and Buckmaster, 2008, Grasse et al., 2013, Truccolo et al., 2011). However, our results suggest that a careful analysis of the associated changes in brain state is critical to distinguish correctly pathological network activity from standard changes in network state in response to brain state transitions.
The only pathological activity observed in our results was observed in a subpopulation of individual neurons. In the case of seizures preceded by SWS, some interneuron's activity decreased seconds before the onset of ES and was followed by heterogeneous increases and decreases in rate in the first seconds of the seizure. Given that the onset of the ES is difficult to detect “online,” interneuron rates may be helpful for early detection in this case (∼12 s before ictal spiking). In the case of seizures preceded by REM sleep, some interneurons transiently increased activity tens of seconds before the ES, but we also observed transient increases in individual interneuron rates at the transition out of REM sleep not associated with seizures, suggesting that transient surges in activity are a normal component of transitions out of REM sleep.
It is possible that we did not observe more pronounced preseizure pathological “signatures” of impending seizures because of our recording location. Indeed, in a concurrent study to ours, some brain regions showed preseizure interneuron activity locked to current brain state dynamics, whereas other regions exhibited preseizure rate changes that were independent of brain state (Toyoda et al., 2015). In our study, the recordings in dorsal hippocampus may not have targeted the seizure focus as indicated by the lack of large scale increases in principal cell firing rates at the time of seizure onset (Figs. 5, 6) coupled with no distortion of spike waveforms during the seizure (Fig. 3; Ziburkus et al., 2006). However, the fact that the ES always preceded generalization to the motor cortex (Fig. 2) indicates that we are recording early components of seizure spread. Perhaps most important, our recording situation is clinically relevant because in human recordings, it would be unlikely that depth recordings would invariably target the focus.
An important aspect of our study is the confirmation that seizures preferentially emerged from distinct brain states. In our low-dose kainate rat model, REM sleep was more seizure prone, highlighting the question of why REM sleep can be seizure promoting. We find that the level of excitation in REM sleep is higher for principal neuron populations than in other theta states, perhaps as a result of the reduced inhibition observed in a subset of the interneuron population (Fig. 9). The heterogeneity of interneuron subclasses in the hippocampus is widely studied; however, careful comparison of activity between REM sleep versus movement while considering interneuron class has not been investigated systematically. Our novel report of a subpopulation that may distinguish between the two states is of particular interest for targeted seizure intervention. Ideally, interneurons that have lower rates during REM sleep could be stimulated to fire at rates comparable to rates attained during movement. We predict that slight increases in network inhibition during REM sleep would reduce seizure probability or spread. Specific targeting of low-rate interneurons would be far simpler if it is determined that they belong to one genetically defined subclass or shared common inputs from extrahippocampal brain regions, facilitating a cell-type- or a circuit-connectivity-based approach. Unfortunately, it is unclear whether commonly used electrophysiological signatures for interneuron classification (e.g., theta phase preference and ripple-related firing) would be consistent in the diseased brain compared with control (Lapray et al., 2012; Varga et al., 2012; Varga et al., 2014). Therefore, these ideas should be further tested in epileptic animals in which cells can be definitely identified, for example, by using juxtacellular recordings and labeling or by using mouse models of chronic epilepsy that facilitate genetic tagging of interneuron subclasses.
Another consideration regarding the seizure propensity of REM sleep comes from our finding that REM states before seizures are of the same duration as typical REM states. Similar durations in these two cases suggest that the transition out of REM sleep may be the “trigger” for seizure generation rather than the REM state itself. In terms of neuromodulation, REM sleep is distinguished from other sleep states and wake states by a silencing of neuromodulatory systems mediating noradrenergic and serotonergic modulation (Roussel et al., 1967; McGinty and Harper, 1976). Upon waking, the drive from monoamine neuromodulatory systems increases, which is proposed to control the transition to wakefulness and support brain computations that occur during alert behaviors (Berridge and Waterhouse, 2003; Sara, 2009; Carter et al., 2010; Monti, 2010). Therefore, there are not only higher principal cell firing rates during REM, but the transition out of REM sleep is also associated with temporal lobe structures undergoing a neurotransmitter switch, raising the possibility that this switch in neuromodulation further promotes seizures. This possibility is supported by human patients, whose seizures are often associated with sleep-to-wake transitions (Zambrelli and Canevini, 2011). Additional studies of brain state transitions have the potential to yield insights into the range of mechanisms for seizure generation, but can also provide insights into the effectiveness of therapeutic strategies for seizures that emerge from distinct initial states.
Even though we found that activity dynamics preceding seizures were not pathological, it was still striking that seizures could emerge from such distinct network configurations as those seen across REM sleep and SWS. There is existing evidence that seizures show distinct patterns of spread and duration depending on the state from which they arise (Bazil and Walczak, 1997), suggesting that the excitability of networks and the ability of pathological activity to be transferred between networks are fundamentally different depending on the brain state. Accordingly, we show that the distinct network conditions associated with brain state exert a profound influence on the success of seizure intervention. The dependence of successful optogenetic intervention of seizures on preceding brain state in our mouse model of chronic temporal lobe epilepsy hints that seizures emerging from REM sleep versus those arising from SWS are mechanistically different, at least during the early phase. For seizures preceded by non-theta states, stimulating a subclass of interneurons resulted in successful curtailment in the duration of the seizure. In contrast, optical stimulation of the same neuronal cell class did not influence the duration of seizures that emerged from theta states. Why would stimulation of interneuron networks only work in one case? It is interesting to consider that, for seizures emerging from REM sleep, the interneuron networks are already switched to a high level of activity. The overexcitation has therefore already overcome a relatively high level of hippocampal interneuron activity and further optogenetic stimulation of a subclass of interneurons may no longer be effective. Furthermore, during theta states, the hippocampus is flooded with high levels of acetylcholine. Muscarinic excitation of PV interneurons was shown to promote depolarization block and increase seizure severity (Yi et al., 2015). Therefore, perhaps for seizures preceded by theta states, PV interneurons are more likely to be rendered ineffective, making photoactivation unsuccessful. This raises the possibility that these seizures may only respond to a different type of intervention, for example, light inactivation of principal cells. Additional experimentation under conditions in which distinct cell types can be manipulated would be essential for addressing these questions.
In light of the increased attention on using single-unit activity for the prediction of seizure onset and closed-loop seizure intervention, we provide valuable parameters that emphasize a need for monitoring brain state to interpret correctly pathological activity before seizure onset. Moreover, our findings that distinct brain states are characterized by different activation patterns of hippocampal interneurons before seizures suggests that seizure intervention may be more successful if tailored for the behavioral states that precede seizures.
Footnotes
This work was supported by the Epilepsy Foundation (Grant 157927), the Hellman Family Foundation, a Walter F. Heiligenberg Professorship (J.K.L.), and the National Institutes of Health (Ruth L. Kirschstein Institutional National Research Service Award NRSA 1F32 MH096526-01A1 to L.A.E.). Implementation of the seizure model was supported in part by the National Institutes of Health (Grant NS74702 to I.S.). We thank V. Lam and M. Wong for technical assistance and E.K. Magnuson for providing previously published optogenetic intervention data.
The authors declare no competing financial interests.
- Correspondence should be addressed to Jill K. Leutgeb, Division of Biological Sciences, University of California–San Diego, 9500 Gilman Drive, La Jolla, CA 92093-0357. jleutgeb{at}ucsd.edu


