

Abstract
Selection and inhibition of motor behaviors are related to the coordinated activity and compositional capabilities of striatal cell assemblies. Striatal network activity represents a main step in basal ganglia processing. The dopaminergic system differentially regulates distinct populations of striatal medium spiny neurons (MSNs) through the activation of D1- or D2-type receptors. Although postsynaptic and presynaptic actions of these receptors are clearly different in MSNs during cell-focused studies, their activation during network activity has shown inconsistent responses. Therefore, using electrophysiological techniques, functional multicell calcium imaging, and neuronal population analysis in rat corticostriatal slices, we describe the effect of selective dopaminergic receptor activation in the striatal network by observing cell assembly configurations. At the microcircuit level, during striatal network activity, the selective activation of either D1- or D2-type receptors is reflected as overall increases in neuronal synchronization. However, graph theory techniques applied to the transitions between network states revealed receptor-specific configurations of striatal cell assemblies: D1 receptor activation generated closed trajectories with high recurrence and few alternate routes favoring the selection of specific sequences, whereas D2 receptor activation created trajectories with low recurrence and more alternate pathways while promoting diverse transitions among neuronal pools. At the single-cell level, the activation of dopaminergic receptors enhanced the negative-slope conductance region (NSCR) in D1-type-responsive cells, whereas in neurons expressing D2-type receptors, the NSCR was decreased. Consequently, receptor-specific network dynamics most probably result from the interplay of postsynaptic and presynaptic dopaminergic actions.
Introduction
The current model of the basal ganglia (BG) posits that the direct pathway facilitates whereas the indirect pathway inhibits movement execution (Albin et al., 1989; DeLong, 1990; Graybiel, 1995, 1996; Grillner et al., 2005b; Bateup et al., 2010; Kravitz et al., 2010). Striatal medium spiny neurons (MSNs) display correlated voltage oscillations in vivo and in vitro (Stern et al., 1997; Vergara et al., 2003; Mahon et al., 2006; Carrillo-Reid et al., 2008; Pomata et al., 2008) that represent distinct behavioral conditions (Mahon et al., 2006; Vautrelle et al., 2009; Yin et al., 2009; Kravitz et al., 2010). Indeed, during pathological situations, MSNs get locked into a dominant network state resembling the lack of movement (Costa et al., 2006; Liang et al., 2008; Jáidar et al., 2010).
Postsynaptically and presynaptically, dopamine (DA) is a crucial modulator of the striatal function (Schultz, 1994; Salgado et al., 2005; Calabresi et al., 2007; Tecuapetla et al., 2007; Wickens et al., 2007; Shen et al., 2008; Surmeier et al., 2009; Chuhma et al., 2011). DA loss produces parkinsonism (Carlsson, 1972; DeLong, 1990; Ingham et al., 1998). Nevertheless, the actions of DA at the network level have been difficult to elucidate because of variable results recorded from MSNs immersed in circuitry activity (Costa et al., 2006; Liang et al., 2008; Burkhardt et al., 2009; Kravitz et al., 2010).
Cell-focused studies have shown that postsynaptic activation of D1- or D2-type receptors increases or decreases, respectively, the firing of MSNs (Hernández-López et al., 1997; Hernandez-Lopez et al., 2000; Surmeier et al., 2007), in agreement with the “two pathways model.” Presynaptic activation of D1- and D2-type receptors increases or decreases, respectively, MSN axon collaterals inhibition within the network (Guzman et al., 2003; Salgado et al., 2005; Tecuapetla et al., 2007, 2009). Local circuitry inhibition is fundamental for striatal network activity because the blockade of GABAergic transmission disrupts cell assembly dynamics generating neuronal entrainment into a dominant network state (Carrillo-Reid et al., 2008; Jáidar et al., 2010). Finally, DA also modulates corticostriatal long-term synaptic plasticity (Surmeier et al., 2009).
Complex, indirect and contradictory DA actions have been recorded from striatal neurons (Liang et al., 2008; Kravitz et al., 2010), making it difficult to predict, intuitively, the final result of simultaneous postsynaptic and presynaptic modulations on the striatal microcircuit. Here we report a direct assessment of the network effects after selective activation of D1- and D2-type receptors in striatal cell assembly configuration.
Functional multicell calcium imaging revealed that either D1- or D2-type receptor activation increases network synchronization. Nonetheless, analysis of network state transitions demonstrated that activation of D1-type receptors selects specific closed pathways during activity of striatal cell assemblies. In contrast, D2-type receptor activation generates a manifold of alternate pathways, thus reducing the probability to select a given one. Therefore, activation of different dopamine receptors promotes receptor-specific dynamics in striatal cell assemblies. These results allow the search for hypothesis about postsynaptic and presynaptic mechanisms to understand the rules that govern striatal networks and its compositional properties.
Materials and Methods
Slice preparation
Corticostriatal slices (300 μm) were obtained from P14–P40 male Wistar rats as described previously (Vergara et al., 2003; Carrillo-Reid et al., 2008, 2009a,b). All animal manipulations followed the guidelines of the National Autonomous University of Mexico Animals Scientific Procedures Committee. Slices were obtained with ice-cold saline (4°C) containing the following (in mm): 123 NaCl, 3.5 KCl, 1 MgCl2, 1.5 CaCl2, 26 NaHCO3, and 11 glucose (saturated with 95% O2 and 5% CO2). Afterward, slices were transferred to saline at room temperature (21–25°C), where they remained for at least 1 h before the experiments.
Electrophysiological recordings
An Axoclamp 2B amplifier (Molecular Devices) was used to perform whole-cell recordings in current- and voltage-clamp configurations. Signals were filtered at 1–3 kHz and digitized at 3–9 kHz with an AT-MIO-16E4 board (National Instruments) in a cloned personal computer. Data acquisition used software designed in the LabVIEW environment. Patch pipettes (3–6 MΩ) were filled with the following (in mm): 115 KH2PO4, 2 MgCl2, 10 HEPES, 0.5 EGTA, 0.2 Na2ATP, and 0.2 Na3GTP. In some experiments, biocytin at 0.5% and fluo-4 salt (20–100 μm) were added to the recording pipettes. Voltage steps were used to perform current–voltage relationships (Vergara et al., 2003; Carrillo-Reid et al., 2009b) in control conditions and in the presence of NMDA (8 μm), SKF 81297 (6-chloro-2,3,4,5-tetrahydro-1-phenyl-1H-3-benzazepine hydrobromide) (1–5 μm), quinelorane (1–5 μm), N-propylnoraporphine (NPA) (1–5 μm), SCH 23390 [R(+)-7-chloro-8-hydroxy-3-methyl-1-phenyl-2,3,4,5-tetrahydro-1H-3-benzazepine hydrochloride] (1 μm), and sulpiride (1 μm).
Optical recordings of neuronal populations with single-cell resolution
Slices were loaded with the calcium indicator fluo-4 AM (10 μm) in dark conditions for 20 min (Tef Labs) in saline containing 0.1% dimethylsulfoxide, equilibrated with 95% O2 and 5% CO2. We used an upright microscope equipped with a 20×, 0.95 NA water-immersion objective (Olympus BX51WI). To observe the changes in fluorescence, we delivered pulses at 488 nm (50–100 ms exposure) to the preparation with a Lambda LS illuminator (Sutter Instruments), connected to the microscope via fiber optics. Experiments were performed at room temperature.
Series of images were acquired with a cooled digital camera (CoolSNAP ES2; Photometrics, Roper Scientific) at 200–500 ms/frame using RS Image (Photometrics, Roper Scientific). The imaged field was 800 × 600 μm in size. Short movies (∼180 s = epoch) were taken at time intervals of 5–20 min during ≥45 min.
Cells active during the experiment were identified, and the spontaneous calcium transients were recorded in control saline and during the application of NMDA and selective dopamine receptor ligands. Stock solutions were prepared before experiments and added to the recording chamber in the final concentration indicated. NMDA, SKF 81297, quinelorane, NPA, SCH 23390, and sulpiride were obtained from Sigma-Aldrich/RBI.
Immunocytochemical procedures
To identify the recorded cells, 1% biocytin was included in the pipette solution. For immunocytochemistry, the slices were fixed overnight with 4% paraformaldehyde in PBS. The slices were incubated in streptavidin conjugated with Cy3 (1:200 dissolved in PBS containing 0.25 Triton X-100; Zymed Laboratories). This allowed us to visualize the recorded neuron (one per slice). Thereafter, slices were preincubated 30 min with 1% bovine serum albumin to block nonspecific binding sites and then incubated for 24 h with a mouse monoclonal antibody against enkephalin or a rabbit polyclonal antibody against substance P (1:100, Millipore Bioscience Research Reagents; 1:200, Peninsula Lab; dissolved in PBS containing 0.25% Triton X-100, respectively). The slices were then rinsed thrice with PBS and incubated with a goat versus mouse or rabbit secondary antibody during 1 h, respectively. This antibody was conjugated with FITC (Vector Laboratories). Next, slices were mounted with Vectashield (Vector Laboratories) and viewed using standard epifluorescence and laser scanning confocal microscopy (Olympus Fv-1000).
Image processing
Image analysis was performed with NIH Image J (version 1.42q) and custom-made programs written in MATLAB (MathWorks) as described previously (Mao et al., 2001; Cossart et al., 2003; Carrillo-Reid et al., 2008, 2009a,b). Briefly, active neurons were semiautomatically identified assigning a two-dimensional coordinate for each cell. Each neuron was numbered, and its precise location in the field of view was known. Calcium transients represent changes in fluorescence: (Fi − Fo)/Fo, where Fi denotes the fluorescence intensity at any frame, and Fo denotes the basal fluorescence of each neuron. As it has been reported (Carrillo-Reid et al., 2008, 2009a,b; Jáidar et al., 2010), the first time derivative of the calcium transient reflects the bursting activity of striatal neurons (>2.5 times the SD of the noise value); in this way, the activity of each neuron in the field of view could be followed along the experiment. We constructed binary matrixes with the activity of many neurons recorded simultaneously. Each row denotes the number of an active neuron, whereas columns represent the total number of frames for each movie. For analysis, we considered calcium transients elicited by neurons only. Signals from neurons are much faster than signals from glial cells (Ikegaya et al., 2004; Sasaki et al., 2007; Carrillo-Reid et al., 2008). To visualize bursting activity from all active neurons, the binary matrix was plotted as a raster plot in which neuronal firing is represented by dots. The time histogram of the raster plot illustrates population activity of all neurons recorded during an experiment. Spontaneous peaks of synchronous activity denote several neurons firing together (having correlated activity). These peaks can be vectorized (population vectors), identified, and counted (Mao et al., 2001; Cossart et al., 2003; Carrillo-Reid et al., 2008) so that the level of network synchronization can be quantitatively assessed.
Analysis of the compositional properties of neural networks
Vectorization of network activity.
To identify neuronal pools firing in synchrony, we constructed temporal neuronal population vectors out of the synchrony peaks (see above). Each vector represents the activation of different neurons within a time window (Brown et al., 2005; Sasaki et al., 2007; Carrillo-Reid et al., 2008). To set significance levels for the appearance of these vectors, we generated 1000 shuffled raster plots from each experimental condition and compared the random distribution against the real data (Mao et al., 2001; Cossart et al., 2003; Carrillo-Reid et al., 2008). Only synchrony peaks with more cells than those expected by chance (p < 0.01) were considered for additional analysis. Together, the sequence of synchrony peaks (neuronal population vectors) represent the overall activity of the microcircuit along time, that is, the sequence of network states making up the dynamics (Schreiber et al., 2003; Stopfer et al., 2003; Brown et al., 2005; Sasaki et al., 2007; Carrillo-Reid et al., 2008). To know whether synchronization increased after a given treatment, the number of synchrony peaks (population vectors) was counted in each of several 3 min epochs (image sequences) at different times in the same experiment and averaged. Mean of averages from different slices were lumped together, and a free-distribution statistic was used (Mann–Whitney U test) for comparison. A Wilcoxon's t test was used to compare the same neurons under different conditions. However, because electrophysiological recordings of activity show either increases or decreases in bursting, we used the sign test to show the major direction of change in most neurons. Also, because all active neurons were identified and their correlated firing was graphed as a pseudocolored matrix, neurons that fired together were united by lines in a correlation map. An increase in the lines of the map graphically shows the increase in correlated firing.
Similarity maps.
The population vectors representing network activity define a multidimensional space, in which the number of dimensions is given by the total number of active cells in each vector. Vectorization of network activity along the experiment allows the searching of recurrent patterns of activity, i.e., vectors being active repeatedly (Schreiber et al., 2003; Ikegaya et al., 2004; Brown et al., 2005; Carrillo-Reid et al., 2008). To know whether the same vectors are active several times, similarity maps were constructed, and all possible vector pairs were compared. The similarity index between any pair of vectors is defined by their normalized scalar product (Sasaki et al., 2007; Carrillo-Reid et al., 2008, 2009a): the cosine of the angle between the compared vectors. High similarity between two vectors means that almost the same cells were simultaneously active at different times (Schreiber et al., 2003; Carrillo-Reid et al., 2008, 2009a; Jáidar et al., 2010).
Network states depicted by multidimensional reduction techniques.
The method used to detect different network states from multidimensional datasets has been published previously (Carrillo-Reid et al., 2008, 2009a; Jáidar et al., 2010). Briefly, dimensionality of population vectors representing network states was reduced by locally linear embedding (LLE), a dimensionality reduction technique that preserves the structure of nonlinear multidimensional data (Roweis and Saul, 2000; Brown et al., 2005; Carrillo-Reid et al., 2008). Then, vectors are projected into a two-dimensional space. As a result, it is possible to visualize clusters of data points representing similar population vectors (network states) after activity sequences or closed cycles (Schreiber et al., 2003; Sasaki et al., 2007; Carrillo-Reid et al., 2008, 2009a; Jáidar et al., 2010). To choose the optimal number of network states, we used hard and fuzzy clustering algorithms and the Dunn's index as a validity function (Bezdek and Pal, 1998; Sasaki et al., 2007; Carrillo-Reid et al., 2008, 2009a).
Identification of activity cycles with graph theory techniques.
We looked for closed trajectories in activity sequences of network states because they are thought to be the foundation of reverberations, a characteristic of Hebbian-like cell assemblies activity and considered to be essential for memory traces (Hebb, 1949; Harris, 2005; Carrillo-Reid et al., 2009a). In addition, microcircuits with recurrent architecture better display compositional properties (Bienenstock and Geman, 1995; Hammer, 2003). To identify closed activity cycles, Hamiltonian or Eulerian trajectories composed of recurrent activity of microcircuit state transitions were identified (Carrillo-Reid et al., 2009a). Briefly, we plotted the state transitions as a time sequence identifying “sentences.” From these sentences, we construct isomorphic directed graphs (digraphs) that posses properties of Hamiltonian or Eulerian cycles. A Hamiltonian cycle of a digraph is a closed trajectory (of neuronal activity in this case) passing through each and every vertex of the graph exactly once. Each vertex is a network state in this case. An Euler cycle is a closed trajectory passing through every edge exactly once (Diestel, 2005). That is, a microcircuit can expand or contract, adding or subtracting states and trajectories to the activity cycles, thus exhibiting compositionality (Carrillo-Reid et al., 2009a). Digraphs are represented by a unique adjacency matrix. Because of this, we could identify whether the same activity cycles were being repeatedly displayed over time, generating cell assembly dynamics. Graph theory techniques applied to microcircuit state transitions allow study of the compositional properties or “syntax” of neuronal pools with cell assembly dynamics (Hebb, 1949; Bienenstock and Geman, 1995; Hammer, 2003; Abeles et al., 2004; Carrillo-Reid et al., 2009a). In summary, synchronicity, correlated activity, activity cycles, expansions or contractions of activity cycles, compositionality, and recurrent or alternate trajectories all are microcircuit properties that can be used to observe modulatory changes in network dynamics (Carrillo-Reid et al., 2009a). The cellular and synaptic mechanisms underlying these circuitry properties will be the subject of future reports.
Results
Optical recordings in populations of striatal neurons
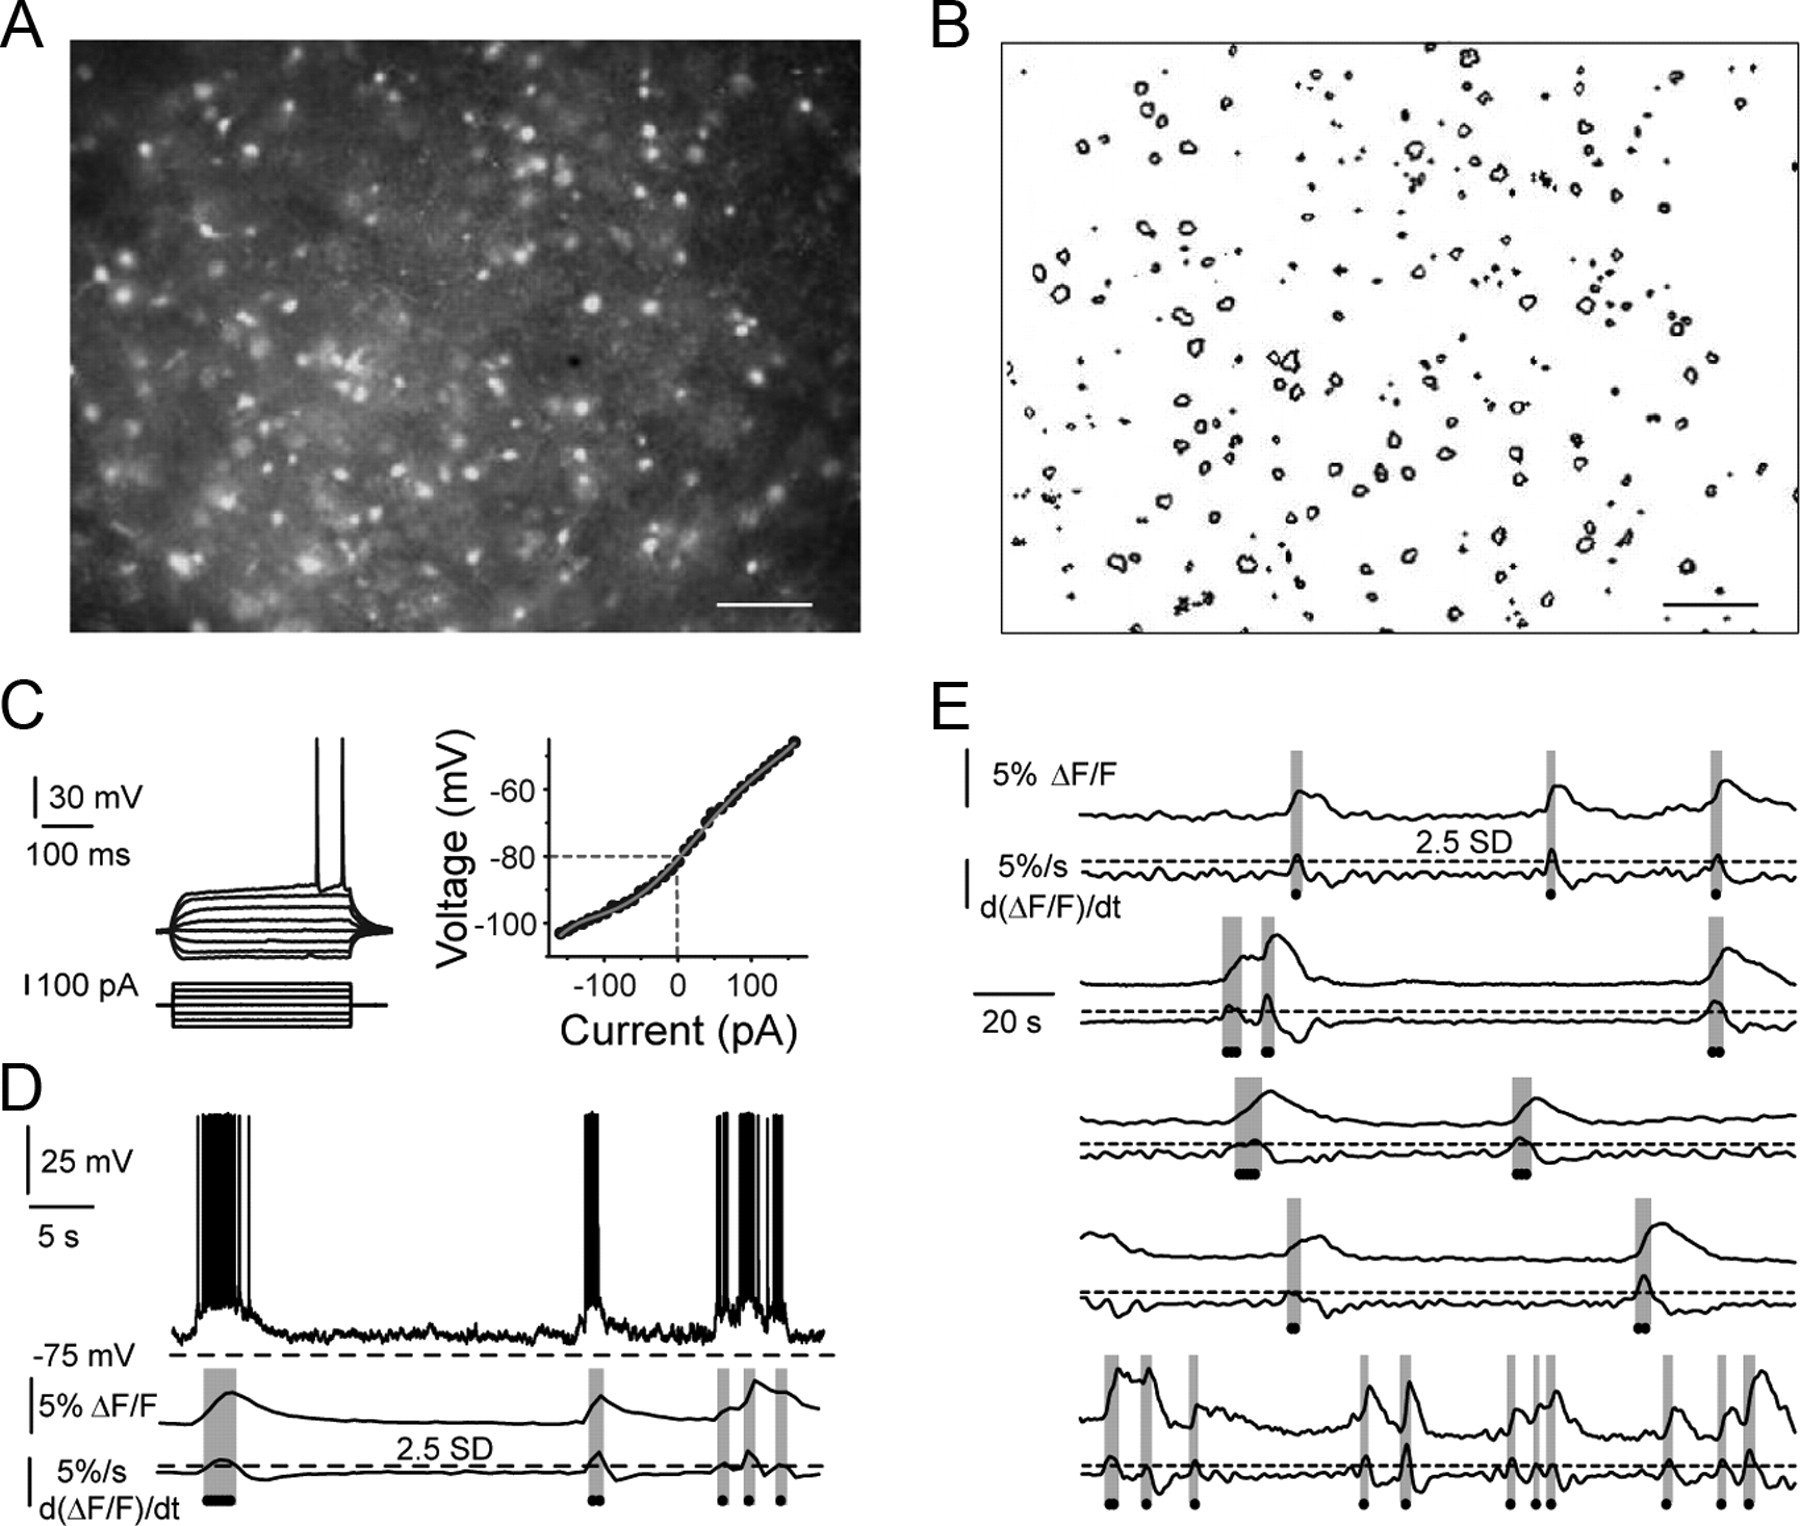
To study striatal microcircuits, we used functional multicell calcium imaging and electrophysiological recordings in corticostriatal slices loaded with the calcium indicator fluo-4 AM (Fig. 1A). Microcircuit dynamics are defined as the basic properties that underlie network activity in a given observational field (Cossart et al., 2003; Carrillo-Reid et al., 2008; Jáidar et al., 2010). Optical recordings with single-cell resolution allow description of circuit dynamics in different pharmacological conditions (Carrillo-Reid et al., 2008, 2009a,b; Jáidar et al., 2010). The contour detection of the loaded cells allows the identification and location of each active neuron through different experimental conditions (Fig. 1B). We recorded an optical field of 800 × 600 μm in 42 corticostriatal slices. Electrophysiological recordings of selected cells showed that most loaded neurons were MSNs (Carrillo-Reid et al., 2008) as can be assessed by the presence of inward rectification and delayed firing (Fig. 1C). Recurrent bursting activity of MSNs is related to motor behavior (Raz et al., 1996; Berke et al., 2004; Goldberg et al., 2004; Barnes et al., 2005; Vautrelle et al., 2009). NMDA application evokes recurrent bursting activity in striatal MSNs in vitro (Vergara et al., 2003; Carrillo-Reid et al., 2008, 2009a; Vautrelle et al., 2009). It has been demonstrated (Carrillo-Reid et al., 2008, 2009a; Jáidar et al., 2010) that electrical activity of neurons is signaled by the first time derivative of the calcium transients (Fig. 1D). Therefore, we can identify indirectly the simultaneous bursting activity of dozens of neurons with single-cell resolution (Fig. 1E).

Visualization of striatal microcircuits with single-cell resolution. A, Fluorescent neurons from a striatal slice loaded with the calcium indicator fluo-4 AM. B, Contour detection from loaded cells in A. Scale bar, 100 μm. C, Voltage responses (left) to current steps recorded from an MSN. Current–voltage relationship (right) measured in current-clamp mode. D, Simultaneous electrophysiological (top) and calcium imaging (middle) recordings taken from a medium spiny neuron that displayed bursting activity after the application of 8 μm NMDA. The duration of the positive region of the first time derivative of the calcium transients (bottom) matches the duration of the up states sustaining bursts of action potentials (gray stripes). Dots indicate bursting events in which the first derivative of the calcium transients is >2.5 times the SD of the noise. E, Calcium transients and first time derivatives from five neurons recorded simultaneously in the presence of 8 μm NMDA. Note that differentiated calcium transients reflect, indirectly, the up and down bursting activity of MSNs as that shown in D.
Dopaminergic modulation of network activity in striatal microcircuits
Similarly to other microcircuits (Grillner et al., 2005a,b), NMDA administration can be used to induce spatiotemporal patterned activity in the striatal network in vitro (Vergara et al., 2003; Carrillo-Reid et al., 2008), in which it is possible to visualize neuronal pools exhibiting synchronous, alternate, and reverberating bursting conforming network states that display cell assembly dynamics (Hebb, 1949; Harris, 2005; Carrillo-Reid et al., 2008, 2009a; Wallace and Kerr, 2010). To investigate the effect of dopamine D1- or D2-type receptor activation in striatal microcircuit activity, functional multicell calcium imaging under different pharmacological conditions was used. In this work, we used selective DA agonists, because the use of DA itself masks specific effects by producing mixed results difficult to interpret. Raster plots (see above) such as those in Figure 2A depict the activity of dozens of neurons as recorded in a brief representative movie displaying one experimental epoch (3 min). Each row represents activity of one neuron, and the simultaneous activity of several neurons is displayed (Mao et al., 2001; Ikegaya et al., 2004; Cossart et al., 2005; Carrillo-Reid et al., 2008, 2009a; Jáidar et al., 2010). Peaks of spontaneous synchronization are depicted in red. D1-class receptor activation significantly increased the number of synchrony peaks per epoch from 2.3 ± 0.3 peaks/epoch in NMDA to 4.3 ± 0.8 peaks/epoch in SKF 81297 plus NMDA (Fig. 2A; n = 12 slices; p < 0.01). Coordinates of active cells during both epochs (filled circles) as well as those participating in the synchrony peaks (red circles) are depicted together with neurons that were not active during these epochs (open circles) (Fig. 2B); note that some neurons are shared by both epochs. Increases in correlated firing among active neurons can also be assessed by correlation maps, for example, see 33 lines in NMDA (Fig. 2C, left) versus 52 lines when SKF 81297 is added (Fig. 2C, right; n = 12 slices; p < 0.01). Nonetheless, the number of cells active per epoch did not change significantly during D1-class receptor activation, for example, 33 cells in NMDA versus 41 cells in SKF 81297 (Fig. 2B–D, NS), indicating that a similar number of cells increased their correlated firing as a result of D1-class receptor activation.
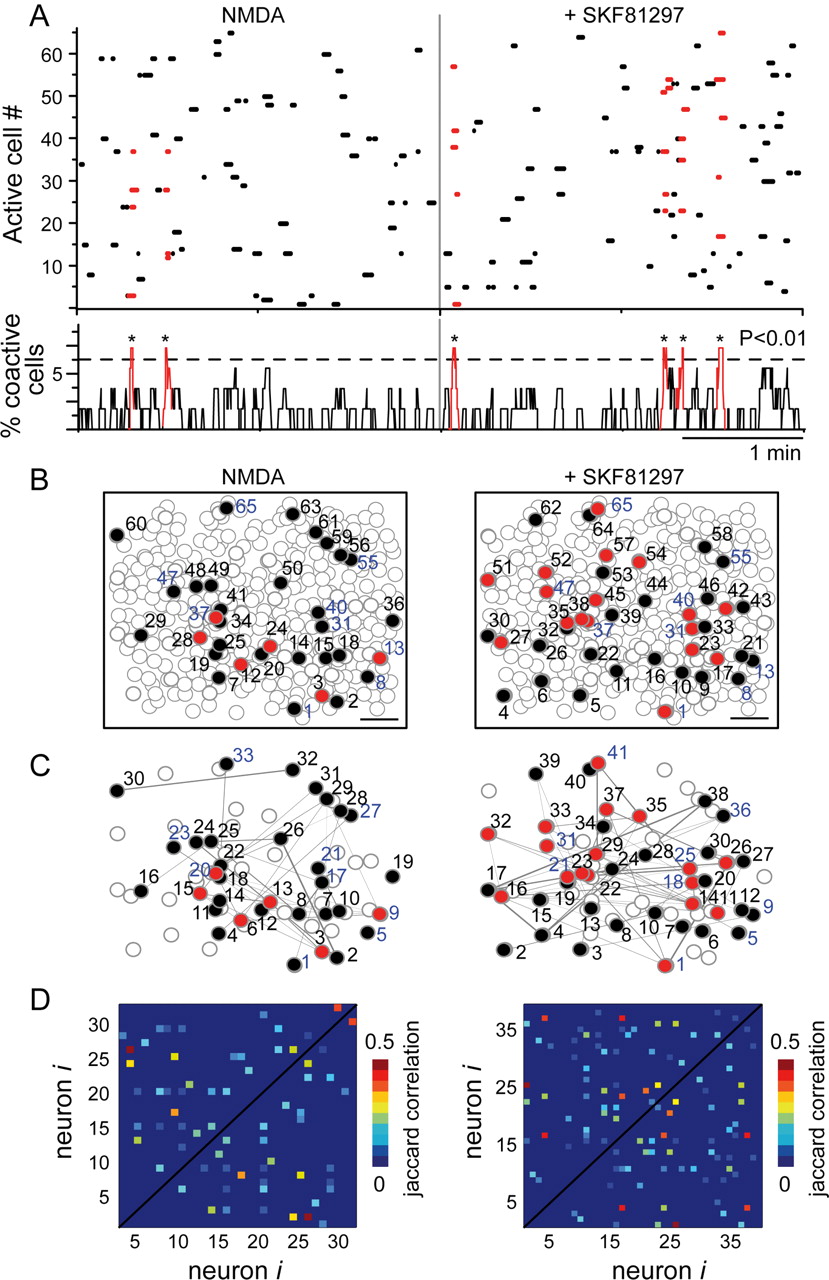
D1-class receptor modulation of striatal microcircuit activity. A, Raster plot of network activity induced by 8 μm NMDA before and after D1-class receptor activation. Spontaneous peaks of synchrony (red) reflecting network activity increase during 5 μm SKF 81297 exposure (p < 0.01). Peaks of synchronous activity are in red. Note that synchronous activity increases after activation of D1-class receptors. B, Spatial maps of neurons involved in striatal network activity (filled circles). Open contours represent loaded cells that were not active during recording time. Blue numbers indicate neurons active in both conditions. Scale bar, 100 μm. C, Spatial correlation maps of network activity. Lines indicate neurons with correlated firing in the epoch illustrated. Red circles signal the neurons participating in the peaks of synchrony (numbers correspond to pseudocolored maps from D). D, Pseudocolored maps showing all neurons with correlated firing. The number of correlated neurons increased significantly after D1-class receptor activation (p < 0.01), although the number of active cells remains without a significant increase.
Interestingly, activation of D2-class receptors also increased significantly the number of peaks of synchronous activity per epoch from 2.7 ± 0.3 peaks/epoch in NMDA to 4.9 ± 0.9 peaks/epoch when quinelorane or NPA were added (Fig. 3A; n = 12 slices; p < 0.04). Coordinates of cells active during recorded epochs (filled circles) as well as those participating in the synchrony peaks (red circles) are depicted together with neurons that were not active during recorded epochs (open circles) (Fig. 3B). A representative correlation map (Fig. 3C) shows 33 lines in NMDA versus 42 lines in quinelorane (n = 12 slices; p < 0.05). Again, the increase in correlated activity was achieved without affecting significantly the number of active cells: 31 cells in NMDA versus 39 cells in quinelorane (Fig. 3B–D). That is, both dopamine receptors are increasing synchronous activity in the microcircuit (see Discussion), thus showing an intriguing result that could not be expected intuitively from published data of single cells only.

D2-class receptor modulation of striatal microcircuit activity. A, Raster plot of network activity induced by 8 μm NMDA before and after D2-class receptor activation. Spontaneous peaks of synchrony (red) reflecting network activity increase during 5 μm quinelorane exposure (p < 0.04). Peaks of synchronous activity are in red. Note that network synchrony increases. B, Spatial maps of neurons involved in striatal network activity (filled circles). Open contours represent loaded cells that were not active during recording time. Blue numbers indicate neurons active in both conditions. Scale bar, 100 μm. C, Spatial correlation maps of network activity. Lines indicate neurons with correlated firing in the epoch illustrated. Red circles signal the neurons participating in the peaks of synchrony (numbers correspond to pseudocolored maps from D). D, Pseudocolored maps of all neurons with correlated firing in the field of view. The number of correlated neurons increased significantly after D2-class receptor activation (p < 0.05), although the number of active cells remains without a significant increase.
Therefore, we studied the compositional capabilities of striatal cell assemblies conveyed by D1- or D2-class receptors activation.
Activation of D1-class receptors facilitates the organization of striatal cell assemblies into recurrent activity cycles
To investigate the actions of D1-class receptor activation on striatal cell assemblies, we obtained several movies for long time periods (≥45 min; n = 9 slices). Vectorization of synchrony peaks allows the following up of overall network dynamics along time (Schreiber et al., 2003; Stopfer et al., 2003; Brown et al., 2005; Sasaki et al., 2007; Carrillo-Reid et al., 2008, 2009a; Jáidar et al., 2010). The inner product of all possible vector pairs yields a similarity matrix that shows neuronal pools firing in synchrony as a function of time (Fig. 4A). Temporal evolution of neuronal vectors defines the sequence of network states that could be evaluated in the presence of selective dopaminergic receptor agonists. The appearance of cluster-like structures in the similarity matrix demonstrates that neuronal pools are formed by mainly the same cells that exhibit correlated bursting at different times, alternating their activity (Sasaki et al., 2007; Carrillo-Reid et al., 2008, 2009a; Jáidar et al., 2010). To visualize the pathways that this activity follows, dimensionality of vectors is reduced with LLE (Roweis and Saul, 2000; Brown et al., 2005; Carrillo-Reid et al., 2008, 2009a; Jáidar et al., 2010). Points represent vectors projected into a two-dimensional space (see Materials and Methods) in which similar vectors are grouped together (colored clusters of points in Fig. 4B), thus defining network states. Arrows between network states show the flow of correlated activity or sequences of network states. To describe the compositional properties of striatal cell assemblies, that is, to follow up the flow of activity (Bienenstock and Geman, 1995; Hammer, 2003; Abeles et al., 2004; Sasaki et al., 2007; Carrillo-Reid et al., 2009a), we identified sentences dictated by the transitions from one network state to the other as a function of time (Fig. 4C, black numbers on top). In many cases, it was seen that sentences during an experiment followed closed pathways that fulfill the requirements for Hamiltonian or Eulerian cycles, thus complying with reverberation, a requirement for Hebbian-like cell assemblies (see Materials and Methods). Matched cycles beginning and ending at the same state define the “words” that compose an entire sentence (Diestel, 2005; Carrillo-Reid et al., 2009a). To facilitate appreciation of the syntax, words are represented here as colored numbers (Fig. 4C, “1231”). Graph theory techniques applied to transitions of network states (Fig. 4C, top) allowed the representation of the words of a sentence with digraphs (Diestel, 1990, 2005). Isomorphic digraphs (see Materials and Methods) demonstrated that the activation of D1-class receptors facilitates the repetition of exactly the same fixed sequences many times along the duration of the experiment (Fig. 4C, bottom; >40 min; n = 7/9 slices; p < 0.001). This can be directly observed in the raster plot of microcircuit activity in the presence of 5 μm SKF 81297 (Fig. 4D) depicting three different epochs in which it is possible to observe increased synchronous activity. This activity is reversible during washing the agonist and can be blocked with the selective antagonist SCH 23390 (data not shown), suggesting that this dynamics is temporarily set on top of the robust cell assembly template appearing with NMDA only (Carrillo-Reid et al., 2008). Location of neurons belonging to a specific network state (Fig. 4E, filled circles) shows that transitions originating the activity cycles are orchestrated by overlapping or shared striatal neurons (Fig. 4F). Hubs of information processing may be present within elements shared by different states (Carrillo-Reid et al., 2008, 2009a; Bonifazi et al., 2009). Shared elements can be located (Fig. 4E) and identified (Fig. 4G) by hierarchical cluster analysis.

D1 receptor activation generates sequences with high recurrence. A, Similarity map of the vectors representing the network activity as a function of time in the presence of SKF 81297. B, Dimensionality reduction of the vectors representing network dynamics using LLE. Points represent vectors at a given time. Clusters of vectors define different network states. Arrows represent the pathways between network states. The probability to leave a given state is represented by numbers. C, State transitions as a function of time (top). Vertical lines separate different epochs. The sentence of an experiment is given by black numbers. Each number represents a network state. Cyclic folds that fulfill the requirements to be Hamiltonian or Eurelian are indicated with colors. The same colors represent exactly the same cycles. The transitions between the network states can be represented as directed graphs (bottom). Asterisks signal starting points. Percentages indicate the conditional probability for the existence of a specific sequence. Note that the same cycle can be repeated several times in a given experiment. D, Raster plot and time histogram of the network activity in the presence of SKF 81297. Each row represents one active cell. Peaks of synchronous activity that occur above chance are signaled with asterisks. Vertical lines indicate different epochs. Colors denote that the vectors belong to a given network state. E, Spatial maps of the neurons that conform to a given state (filled circles). F, Percentage of coactive cells between different network states. G, Hierarchical cluster analysis of neurons underlying the network states. Colored boxes indicate that a neuron participates in a given state.
Activation of D2-class receptors promotes diverse configurations of striatal cell assemblies
To study the actions of D2-class receptor activation on cell assemblies, we analyzed the network dynamics evoked by NMDA in the continuous presence of 5 μm quinelorane (n = 9 slices), a selective D2-receptor agonist. Similarity maps of the vectors representing the network states (Fig. 5A) showed that D2 receptor activation produced patterned activity generated by the alternate and recurrent firing of specific neuronal pools. Dimensional reduction of synchrony peaks representing network states (Fig. 5B) revealed that the number of pathways among them increased with respect to the control (NMDA only). This architecture gives rise to more variable transitions among network states (Fig. 5C, top), inducing the appearance of diverse sentences. Graph theory techniques applied to these transitions revealed that activation of D2-class receptors greatly avoided the repetition of the same cycles of activity when the closed cycles were present (Fig. 5C, bottom; >40 min; n = 8 of 9 slices; p < 0.001), thus originating composed cycles from simple ones. Indeed, some experimental epochs did not exhibit the existence of Hamiltonian or Eulerian closed cycles as can be observed in the raster plot representing uncertain or unpredictable trajectories in the overall activity of the network (Fig. 5D), even when periods of synchrony remained stable. Spatial maps of the neurons belonging to a given network state (Fig. 5E) showed that some cells can be shared by different states (Fig. 5F). Hierarchical cluster analysis demonstrated that each state could be divided into subgroups, allowing compositional capabilities to striatal cell assemblies (Fig. 5G) and resembling the property of “distributed synchrony” (Levy et al., 2001). Theoretically, cell assemblies with these characteristics have the ability to reconfigure, allowing the formation of new representations based on stored memories (Bienenstock and Geman, 1995; Levy et al., 2001; Hammer, 2003; Abeles et al., 2004; Carrillo-Reid et al., 2009a).

D2 receptor activation promotes sequences with low recurrence. A, Similarity map of the vectors representing the network dynamics in the presence of quinelorane. B, Multidimensional reduction of the vectors representing network dynamics. Clusters of vectors define network states. Arrows represent the pathways between network states. C, State transitions as a function of time (top). Vertical lines separate different epochs. Each number represents a network state. Cyclic folds are indicated with colors. Directed graphs (bottom) represent the transitions between the network states. Asterisks signal starting points. Percentages indicate the conditional probability for the existence of a specific sequence. Note that filled cycles are diverse and are not repeated several times. In addition, some epochs do not allow a valid (closed) sequence. D, Raster plot and time histogram of the network activity in the presence of quinelorane. Rows represent active neurons. Asterisks signal peaks of synchronous activity. Vertical lines indicate different epochs. Colors denote network states. E, Spatial maps of the neurons that give rise to the network states (filled circles). F, Percentage of coactive cells between different network states. G, Hierarchical cluster analysis of neurons belonging to different network states. Neurons participating in a given state are indicated by colored boxes.
Modulation of D1- and D2-type receptors has differential effects on nonlinear postsynaptic properties of MSNs immersed in microcircuit activity
The effect that the selective activation of dopaminergic receptors has on the nonlinear postsynaptic properties of MSNs has been poorly investigated. Because changes in nonlinear properties have been directly correlated to network activity in striatal microcircuits (Carrillo-Reid et al., 2009b), we first studied the basic postsynaptic mechanisms underlying the dopaminergic receptor-specific configuration of striatal cell assemblies. Accordingly, we performed electrophysiological recordings from enkephalin-immunoreactive (ENK+) or substance P-immunoreactive (SP+) neurons from indirect and direct pathways, respectively (Fig. 6A,B). The actions of D1- or D2-class receptors activation in voltage-clamp current–voltage relationships (I–V plots) of each cell population can be seen around the negative-slope conductance region (NSCR) responsible for membrane potential oscillations induced by NMDA (Vergara et al., 2003). Application of the selective D1-class receptor agonist SKF 81297 (5 μm) enhanced the amplitude of the inward component of NSCR in all responsive cells (Fig. 1C; n = 26 cells; p < 0.001). This action was blocked by the selective D1-class receptor antagonist SCH 23390 (1 μm) (Hernández-López et al., 1997; Flores-Barrera et al., 2011). Nevertheless, membrane potential transitions, a product of circuitry processing that includes presynaptic dopaminergic actions (Tecuapetla et al., 2007; Chuhma et al., 2011), showed variable responses to D1-class receptor activation in different cells (Fig. 6D, top and bottom show different cells). In most neurons (64%), D1-class receptor activation (Fig. 6D, top) either induced or augmented burst firing: from zero to three up-state transitions per 30 s in the control (n = 16 of 25 cells; 5–8 μm NMDA; trace in Fig. 6D, top left, has no transitions in 5 μm NMDA only) to three to six transitions per 30 s after adding 5 μm SKF 81297 to the bath saline (p < 0.0001, sign test). However, in eight neurons, transitions per 30 s time intervals were reduced or left unchanged (Fig. 6D, bottom). Conversely, bath addition of two different selective D2-class receptor agonists, quinelorane (5 μm) or NPA (5 μm), reduced the inward component of NSCR induced by NMDA receptor activation in all responsive cells (Fig. 6E; n = 22 cells; p < 0.001). This action was blocked by the selective D2-class receptor antagonist sulpiride (1 μm) (Hernandez-Lopez et al., 2000; Flores-Barrera et al., 2011). However, variable actions were seen in the circuitry-immersed bursting activity of different MSNs (Fig. 1F, top and bottom show different cells): in n = 18 of 25 neurons, D2-class receptor activation inhibited bursting (72%; Fig. 6F, top) from two to four transitions per 30 s to 0 (p < 0.0001, sign test). Nonetheless, in six neurons, D2 receptor agonists appeared to enhance or not affect bursting (Fig. 6F, bottom). Thus, postsynaptic activation of either receptor did not have a full correlate with bursting activity, supporting that dopaminergic actions observed at the network level involve both postsynaptic and presynaptic modulations occurring simultaneously. D1 receptor modulation increases postsynaptic excitability of most SP+ MSNs but at the same time enhances GABA release from their axon collateral terminals (Hernández-López et al., 1997; Tecuapetla et al., 2007; Flores-Barrera et al., 2011). Conversely, D2 receptor modulation decreases postsynaptic excitability of most ENK+ MSNs but at the same time decreases inhibition conveyed by their terminals within the circuit (Hernandez-Lopez et al., 2000; Tecuapetla et al., 2007; Flores-Barrera et al., 2011). These actions suggest complex internal circuitry processing during network activity (Kostal et al., 2007), so that any postsynaptic action taken alone, no matter how robust, is not a complete determinant of neuronal responses immersed in a functioning circuit. Nonetheless, D1-class receptor activation facilitated bursting in most SP+ MSNs, and D2-class receptor activation suppressed bursting in most ENK+ MSNs.

Response of medium spiny neurons to D1- and D2-class receptor agonists. A, Superimposed electrophysiological responses from ENK+ (red) and SP+ (black) MSNs to 100 pA current steps (left). Current–voltage relationships in current-clamp mode of both neuron classes are illustrated (right). B, MSNs filled with biocytin (left). Same optical field shows neurons immunoreactive for ENK or SP (middle) and double-labeled neurons (overlaid) for biocytin and peptides (right) using confocal microscopy. Scale bar, 20 μm. C, Current–voltage relationships in voltage-clamp mode show that activation of NMDA receptors induces an NSCR. Activation of D1-type receptors (5 μm SKF 81297) increases the NSCR in responsive cells belonging to the direct pathway (SP+). This action was blocked by 1 μm SCH 23390. D, Membrane potential recordings of two different SP+ MSNs (top and bottom) during bath addition of 5 μm SKF 81297 in the presence of NMDA. Note that bursting activity could be induced (top) or not significantly changed (bottom) even if NSCR was increased in both neurons. E, Current–voltage relationships in voltage-clamp mode show that activation of D2-type receptors (5 μm quinelorane) reduces the NSCR from indirect pathway ENK+ MSNs. This action was blocked by 1 μm sulpiride. F, Membrane potential oscillations induced by NMDA in two different ENK+ neurons (top and bottom). Note that, in the presence of a D2-type agonist, 5 μm NPA, the bursting activity could be abolished (top) or enhanced (bottom) even if the NSCR was reduced in both cells.
Discussion
DA configures striatal microcircuits through modulation of synaptic mechanisms and postsynaptic properties (Cepeda et al., 1995; Hernández-López et al., 1997; Hernandez-Lopez et al., 2000; Guzman et al., 2003; Tecuapetla et al., 2007, 2009; Shen et al., 2008; Yin et al., 2009). Nevertheless, the selective activation of D1- or D2-type receptors at the network level, preserving single-cell resolution, had not been reported.
We used electrophysiological recordings and functional multicell calcium imaging of striatal microcircuits in combination with neuronal population analysis to demonstrate the following. (1) Activation of either receptor class, D1 or D2, increases the correlated activity and synchrony of the striatal microcircuit, perhaps explaining some synergistic actions described in behavioral and clinical studies (Robertson and Robertson, 1986; Martin-Iverson and Yamada, 1992; Robertson, 1992; Murer et al., 1995). (2) Activation of D1-class receptors selects specific patterns of activity assessed by a high recurrence of determined closed cycles at specific periods (Carrillo-Reid et al., 2009a). This property could be fundamental for action selection (Grillner et al., 2005b). (3) D2-class receptor activation discloses a manifold of reverberating cycles with low recurrence plus the appearance of more complex cycles with various pathways for the flow of neural activity. This property may represent the non-chosen states or the outline of potential configurations of the network for a future selection. (4) At the postsynaptic level, activation of D1-class receptors facilitates the NSCR induced by NMDA, whereas D2-class receptor activation decreased the NSCR in MSNs, in agreement with previously reported actions of dopamine during firing induced by direct current injection (Hernández-López et al., 1997; Hernandez-Lopez et at., 2000). However, while the circuitry was generating recurrent membrane potential oscillations induced by NMDA, either enhanced or decreased bursting could be observed during activation of D1- or D2-class receptors by using selective receptor agonists, suggesting that during circuitry processing the action of postsynaptic receptors are not as determinant but that presynaptic actions and circuitry ongoing processing affect the final outcome (Kostal et al., 2007). These results encompass apparent contradictions reported previously (Liang et al., 2008; Kravitz et al., 2010) without demerit of robust postsynaptic actions observed (Hernández-López et al., 1997; Hernandez-Lopez et al., 2000).
These experiments demonstrate that selective activation of dopamine receptors enables different compositional properties to cell assemblies and illustrates a rationale for the striatal microcircuit being arranged into parallel circuits (Rayport, 2008; Jáidar et al., 2010; Chuhma et al., 2011), as though one network displays possible trajectories and the other selects one or a few of them.
Mechanisms underlying network properties of the striatal microcircuit
We described previously that striatal microcircuits generate closed reverberating cycles of activity (Carrillo-Reid et al., 2008), a long-range prediction of circuit theories since the work of Hebb (1949). We formally demonstrated that cyclic folds induced by NMDA follow stringent closed trajectories, Hamiltonian and Eulerian (Carrillo-Reid et al., 2009a), resembling central pattern generators (Grillner et al., 2005a). In addition, we previously showed presynaptic and postsynaptic dopaminergic actions in MSNs and their axon collateral terminals (Hernández-López, 1997; Hernandez-Lopez et al., 2000; Guzman et al., 2003; Salgado et al., 2005; Tecuapetla et al., 2007, 2009; Flores-Barrera et al., 2011).
In agreement with previous studies (Hernández-López et al., 1997; Hernandez-Lopez et al., 2000; Flores-Barrera et al., 2011) and as expected by the “two pathways model” of the BG (Albin et al., 1989; DeLong, 1990), the postsynaptic activation of D1-class receptors increased the responsiveness of striatonigral MSNs by enhancing the NSCR of the current–voltage relationship (Schiller and Schiller, 2001; Carrillo-Reid et al., 2009b), whereas the selective activation of D2-class receptors reduces the NSCR, promoting a decrease in excitability of striatopallidal MSNs.
D1 receptor actions increase postsynaptic excitability (Hernández-López et al., 1997) and at the same time enhance GABA release by axon collaterals of MSNs (Guzman et al., 2003; Tecuapetla et al., 2007). Both actions occurring simultaneously promote the selection of highly probable cycles of reverberating activity that are relatively fixed. The increase in lateral inhibition and network synchrony is consistent with the enhancement of postsynaptic excitability and depolarizing inhibition among active neurons (Flores-Barrera et al., 2010, 2011). This circuit characteristic may underlie action selection (Grillner et al., 2005b).
By the same token, D2 receptor activation produced the decrease of postsynaptic excitability (Hernandez-Lopez et al., 2000) and GABA release of axon collateral terminals of indirect pathway neurons (Guzman et al., 2003; Tecuapetla et al., 2007), opening the way for more paths to convey the flow of activity at the microcircuit level. The enhancement in correlated firing and synchrony generate active neuronal pools after a manifold of alternative trajectories, rarely repeating a given activity cycle (Carrillo-Reid et al., 2009a). The decrease in lateral inhibition promotes more frequent transitions without augmenting the number of active neurons as a result of the concomitant decrease in postsynaptic excitability, suggesting that quantity and processing of information can be distinctly modulated in the same circuits by the activation of specific DA receptors.
We demonstrated previously that blockade of GABAergic transmission increases the peaks of synchronous activity, shifting the network to a dominant network state that recruits most active neurons and severely restricts the dynamics of cell assemblies (Carrillo-Reid et al., 2008). Consistently, DA deprivation that is known to greatly decrease the inhibition from local axon collaterals (Taverna et al., 2008; Tecuapetla et al., 2009) is reflected as cell assemblies engaging into a dominant network state (Carrillo-Reid et al., 2008; Jáidar et al., 2010). Together, these works emphasize that the presynaptic actions of dopamine on inhibitory terminals are crucial for the selection and alternation of neuronal pools (Guzman et al., 2003; Carrillo-Reid et al., 2008; Jáidar et al., 2010; Chuhma et al., 2011).
Functional implications and limitations
Electrophysiological recordings reveal that the striatum encodes functions associated with motor control, procedural memory, reward-related activity, and various cognitive states (Albin et al., 1989; Graybiel et al., 1994; Schultz, 1994; Graybiel, 1995; Costa et al., 2006; Berke, 2008; Liang et al., 2008; Pomata et al., 2008; Vautrelle et al., 2009; Yin et al., 2009). The firing of MSNs is characterized by spontaneous voltage transitions in vivo and in vitro (Wilson, 1993; Vergara et al., 2003; Carrillo-Reid et al., 2008, 2009a; Pomata et al., 2008; Vautrelle et al., 2009). However, the network properties of striatal neurons in normal and pathological conditions have been difficult to elucidate (Carrillo-Reid et al., 2008, 2009a; Rayport, 2008; Jáidar et al., 2010). In fact, during an akinetic parkinsonian state, the activity of MSNs is enhanced (Liang et al., 2008; Jáidar et al., 2010; Kravitz et al., 2010) but is also enhanced during dyskinetic states (Liang et al., 2008; Kravitz et al., 2010).
Network states are a succession of events in which some neurons need to go down in their activity while others go up. The induction of highly reproducible reverberating cycles induced by D1 modulation could represent the selection of activity patterns that require a precise performance as a result of direct pathway output (Tseng and O'Donnell, 2005; Yin et al., 2009). The generation of alternative activity pathways induced by D2 modulation may support uncertainness before selecting a sequence (Graybiel, 1995, 1997), thus promoting a readiness or expectant state, allowing the encoding of diverse procedures and preparing the striatal network for a behavioral change. In parkinsonian conditions, the activity of striatal neurons gets engaged into a dominant network state, limiting alternative trajectories and inhibiting movement execution (Jáidar et al., 2010). In contrast, in normal conditions, a decrease in DA levels and the activation of the cholinergic system promotes the generation of more alternative pathways of activity, perhaps related to memory processes and habit formation (Carrillo-Reid et al., 2009a,b).
We demonstrated previously (Carrillo-Reid et al., 2008) that most active neurons supporting cell assembly dynamics are MSNs. However, subpopulations of neurons shared by all functional states exhibited firing properties of GABAergic interneurons. Thus, interneurons are fundamental players in the striatal dynamics (Berke et al., 2004). Nevertheless, the role of interneurons in the orchestration of cell assembly dynamics require additional studies with transgenic mice.
An intrinsic limitation of functional multicell calcium imaging is a low signal-to-noise ratio; thus, in the present experimental conditions, we can reliably detect trains of two or more action potentials embedded in bursting activity (Carrillo-Reid et al., 2008, 2009a; Jáidar et al., 2010). A direct relationship between single spikes, firing frequency, and fluorescence changes deserves the use of alternative optical methods, as two-photon calcium imaging. In turn, electrical recordings are limited to a few adjacent fixed points, making it impossible to study network dynamics of silent and active neurons that are anatomically widespread. This fact could in part explain the lack of synchrony observed in striatal spiny neurons during DA deprivation assessed by electrical recordings (Goldberg et al., 2004).
In summary, even if limited, multicell calcium imaging allows the systematic characterization of striatal cell assemblies, providing an intermediate stage between cellular, systems, and pathological levels, perhaps impossible to guess by cellular studies only. The description of striatal cell assemblies would posit boundaries for modeling studies (Wickens et al., 2007) and generate testable hypotheses for behavioral approaches (Yin et al., 2009), expanding our view of striatal microcircuit dynamics.
Footnotes
This work was funded by Investigacion Multidisciplinaria de Proyectos Universitarios de Liderazgo y Superacion Academica–Universidad Nacional Autónoma de México (UNAM) and Dirección General de Asuntos del Personal Académico–UNAM Grants IN-205610 (J.B.) and IN-206010 (E.G.), The Miguel Alemán AC Foundation, Consejo Nacional de Ciencia y Tecnología (CONACyT)–Deutsche Forschungsgemeinschaft Grant I0110/193/10 FON.INST.-29-10, and CONACyT Grant 154131 (J.B.). L.C.-R. had a doctoral scholarship from CONACyT, and the experimental results were part of his PhD dissertation in the Biomedicine Graduate School (UNAM). The analytical tools used here were refined at the Brain Mechanisms for Behavior Unit, Okinawa Institute for Science and Technology. We thank Dr. A. Hernandez-Cruz for his critical comments and advice. We thank engineers Jesus Perez-Ortega and Vladimir Calderon for programming part of the code used to analyze the data. We also thank C. Rivera, A. Laville, G. X. Ayala, and A. Hernandez for technical support.
- Correspondence should be addressed to José Bargas, Division of Neuroscience, Institute of Cellular Physiology, National Autonomous University of Mexico, P.O. Box 70-253, Mexico City, DF 04510 Mexico. jbargas{at}ifc.unam.mx


