

Abstract
Despite many advances made in understanding the pathophysiology of epileptic disorders, seizures remain poorly controlled in approximately one-third of patients with mesial temporal lobe epilepsy. Here, we established the efficacy of cell type-specific low-frequency stimulation (LFS) in controlling ictogenesis in the mouse entorhinal cortex (EC) in an in vitro brain slice preparation. Specifically, we used 1 Hz optogenetic stimulation of calcium/calmodulin-dependent protein kinase II-positive principal cells as well as of parvalbumin- or somatostatin-positive interneurons to study the effects of such repetitive activation on epileptiform discharges induced by 4-aminopyridine. We found that 1 Hz stimulation of any of these cell types reduced the frequency and duration of ictal discharges in some trials, while completely blocking them in others. The field responses evoked by the stimulation of each cell type revealed that their duration and amplitude were higher when principal cells were targeted. Furthermore, following a short period of silence ranging from 67 to 135 s, ictal discharges were re-established with similar duration and frequency as before stimulation; however, this period of silence was longer following principal cell stimulation compared with parvalbumin- or somatostatin-positive interneuron stimulation. Our results show that LFS of either excitatory or inhibitory cell networks in EC are effective in controlling ictogenesis. Although optogenetic stimulation of either cell type significantly reduced the occurrence of ictal discharges, principal cell stimulation resulted in a more prolonged suppression of ictogenesis, and, thus, it may constitute a better approach for controlling seizures.
SIGNIFICANCE STATEMENT Epilepsy is a neurological disorder characterized by an imbalance between excitation and inhibition leading to seizures. Many epileptic patients do not achieve adequate seizure control using antiepileptic drugs. Low-frequency stimulation (LFS) is an alternative tool for controlling epileptiform activity in these patients. However, despite the temporal and spatial control offered by LFS, such a procedure lacks cell specificity, which may limit its efficacy. Using an optogenetic approach, we report here that LFS of two interneuron subtypes and, even more so, of principal cells can reliably shorten or abolish seizures in vitro. Our work suggests that targeted LFS may constitute a reliable means for controlling seizures in patients presenting with focal seizures.
Introduction
Mesial temporal lobe epilepsy is the most common form of focal epilepsy in adulthood and involves seizures arising from limbic structures such as the hippocampus and the rhinal cortices (Gloor, 1997). It is also one of the most refractory forms of epilepsy since up to 75% of patients do not achieve adequate seizure control through medication (Jallon, 1997); therefore, costly, and at times impractical, surgical resection of the epileptic tissue remains the only therapeutic alternative in these cases (Wiebe, 2004; Blume and Parrent, 2006). An alternative approach for treating patients with intractable epilepsy rests on low-frequency stimulation (LFS) that can be delivered through either transcranial magnetic or deep-brain electrical procedures (Fisher and Velasco, 2014). The rationale for such an intervention is supported by experimental evidence obtained from in vivo rodent models of mesial temporal lobe epilepsy where LFS of the ventral hippocampal commissure reduces seizure frequency (Kile et al., 2010; Rashid et al., 2012).
It is also known that CA3-driven interictal activity controls the entorhinal cortex (EC) propensity to generate ictal discharges in vitro (Bragdon et al., 1992; Barbarosie and Avoli, 1997). In addition, when inputs from the CA3 are removed by cutting the Schaffer collaterals, electrical stimuli delivered in the subiculum at frequencies similar to those of CA3-driven interictal discharges decrease epileptiform synchronization in the EC (Barbarosie and Avoli, 1997); indeed, it has been shown that 1 Hz stimulation frequency exhibits maximal efficacy in reducing ictogenesis in the EC (D'Arcangelo et al., 2005). However, despite the temporal and spatial control offered by electrical or magnetic LFS, these procedures lack cell specificity, thus presumably limiting their anti-ictogenic efficacy. This drawback can now be addressed using optogenetic techniques (Yizhar et al., 2011) that have been recently used as potential therapeutic tools for controlling seizures (Bui et al., 2015; Wykes et al., 2016). Overall, there are two approaches used in this context. One is to use the optogenetic inhibition of excitatory principal cells expressing halorhodopsin; experiments using this approach have revealed attenuation of epileptiform activity in vivo (Krook-Magnuson et al., 2013) and in vitro (Tønnesen et al., 2009) preparations. The second strategy is to increase the activity of inhibitory interneurons expressing channelrhodopsin-2 (Kokaia et al., 2013); optogenetic activation of hippocampal interneurons has been shown to attenuate seizures in vivo (Krook-Magnuson et al., 2013), while low-frequency activation of GABAergic cells in the CA3 hippocampal subfield controls 4-aminopyridine (4-AP)-induced ictal discharges in vitro (Ledri et al., 2014; Ladas et al., 2015).
It remains to be established whether low-frequency activation of principal cells results in attenuation or strengthening of ictal synchronization. Also, most of the studies reviewed above focused on the effects of optogenetic stimulation on epileptiform activity in the hippocampus, and thus it is unknown whether optogenetic activation of specific neuron subtypes in parahippocampal structures such as the EC can control epileptiform synchronization as well. The EC is an epileptogenic area that is highly interconnected with the hippocampus (Rutecki et al., 1989; Gloor, 1997; Canto et al., 2008). Anatomically, the EC is made up of six layers, which are separated by layer IV into superficial layers (I–III) and deep layers (V–VI; Insausti et al., 1995). Fast-spiking and regular-spiking inhibitory interneurons, which express parvalbumin (PV) and somatostatin (SOM), respectively, are abundant in both superficial layers II and III. Principal cells in layers II and III, which may be stellate or pyramidal cells, receive strong inhibitory synaptic input and project to hippocampal subregions (Kumar and Buckmaster, 2006). The deep layers, on the other hand, receive input from the hippocampus, which is then connected with other cortical regions (Canto et al., 2008). Therefore, in this study we used optogenetic stimulation of calcium/calmodulin-dependent protein kinase II (CaMKII)-positive principal cells and of PV- or SOM-positive interneurons at 1 Hz to compare, for the first time, the effects induced by activation of these specific cell subtypes on 4-AP-induced ictal discharges generated from the transgenic mouse EC in an in vitro brain slice preparation.
Materials and Methods
Animals.
All procedures were performed according to protocols and guidelines of the Canadian Council on Animal Care and were approved by the McGill University Animal Care Committee. CaMKII-Cre [B6.Cg-Tg(Camk2a-cre)T29-1Stl/J, The Jackson Laboratory; RRID: IMSR_JAX:005359], PV-Cre [B6;129P2-pvalbtm1(cre)Arbr/J, The Jackson Laboratory; RRID: IMSR_JAX:008069], and SOM-Cre [Ssttm2.1(cre)Zjh/J, The Jackson Laboratory; RRID: IMSR_JAX:013044] homozygote mouse colonies were bred and maintained in-house to generate the pups that were used in this study.
Stereotaxic virus injections.
Six CaMKII-Cre, seven PV-Cre, and four SOM-Cre male or female pups were anesthetized at postnatal day 15 (P15) using isoflurane and positioned in a stereotaxic frame (Stoelting). AAVdj-ChETA-eYFP (enhanced yellow fluorescent protein) virus (UNC Vector Core, Chapel Hill, NC) was delivered in the EC (0.6 μl at a rate of 0.06 μl/min). Injection coordinates were as follows: anteroposterior, −4.00 mm; mediolateral, ±3.60 mm; dorsoventral, −4.00 mm. The transverse sinus was used as a point of reference, and the injection needle was inserted with a 2° anteroposterior angle. After completion of the surgery, pups were given a single injection of carprofen (20 mg/kg, s.c.) and placed on a heat pad for 30 min to allow recovery. Pups were then returned to their home cage.
Slice preparation.
Mice were deeply anesthetized with inhaled isoflurane and decapitated at P30 to P40. Brains were quickly removed and immersed in ice-cold slicing solution containing the following (in mm): 25.2 sucrose, 10 glucose, 26 NaHCO3, 2.5 KCl, 1.25 KH2PO4, 4 MgCl2, and 0.1 CaCl2, pH 7.3, oxygenated with 95% O2/5% CO2. Horizontal brain slices (thickness, 400 μm) containing the EC were cut using a vibratome (VT1000S, Leica) and incubated for ≥1 h at room temperature in a slice saver filled with oxygenated artificial CSF (aCSF) of the following composition (in mm): 125 NaCl, 25 glucose, 26 NaHCO3, 2 KCl, 1.25 NaH2PO4, 2 MgCl2, and 1.2 CaCl2. Reagents were obtained from Sigma-Aldrich.
Electrophysiological recordings and photostimulation.
Brain slices were transferred to a submerged chamber where they were perfused with oxygenated aCSF (KCl and CaCl2 adjusted to 4.5 and 2 mm, respectively) at a rate of 10–15 ml/min at 30°C. Field potentials were recorded with aCSF-filled microelectrodes (1–2 MΩ) positioned in the EC deep layers in the presence of 4-AP. Signals were recorded with a differential AC amplifier (AM Systems), filtered on-line (0.1–500 Hz), digitized with a Digidata 1440a Digitizer (Molecular Devices), and sampled at 5 kHz using pClamp software (Molecular Devices). For ChETA excitation, blue light (473 nm; intensity, 35 mW) was delivered through a custom-made LED system (Luxeon) coupled to a 3-mm-wide fiber optic (Edmund Optics) and placed above the recorded area. For optogenetic activation of CaMKII-positive principal cells and PV- or SOM-positive cells, light pulses (1 ms duration) were delivered at 1 Hz for 180 s with a 220 s interval between stimulating protocols.
Immunohistochemistry.
Mice were deeply anesthetized with ketamine/xylazine/acepromazine (100/16/3 mg/kg, i.p., respectively) and intracardially perfused with 4% paraformaldehyde in PBS. Brains were dissected and postfixed for 24 h by immersion in the same fixative and then washed in PBS. Free-floating horizontal sections (50 μm) of the EC were cut using a vibratome. Sections from PV-Cre mice were incubated with PV mouse monoclonal antiserum (1:1000; Sigma-Aldrich) and GFP rabbit antiserum (1:1000; Invitrogen). Sections from SOM-Cre mice were incubated with SOM rabbit antiserum (1:250; Santa Cruz Biotechnology) and GFP goat antiserum (1:5000; Millipore). Sections from CaMKII-Cre mice were incubated with CaMKII rabbit antiserum (Invitrogen) and GFP goat antiserum (1:5000; Millipore). Primary antibodies were detected with anti-mouse IgG1, or anti-rabbit or anti-goat secondary antibodies coupled to Alexa Fluor 488 or 555 (1:1000; Invitrogen). Sections were mounted on glass slides, the injection site was localized, and one section from every 100 μm was analyzed. Cells positive for GFP and/or CaMKII/PV/SOM immunostaining were counted using ImageJ software (National Institutes of Health).
Data analysis.
The stimulation was considered successful if only a brief discharge was elicited at the beginning of stimulation or if no ictal discharge occurred during stimulation. In some trials, stimulation was not able to influence ictogenesis and was therefore considered unsuccessful. The success of stimulation trials is quantified in the Results section as a change in the rate of ictogenesis. The rates of ictal discharges were computed based on the number of ictal discharges (per minute) that occurred during periods of no stimulation compared with the number of ictal discharges (per minute) that occurred during 1 Hz stimulation trials, regardless of whether the stimulation trial was successful in blocking or shortening ictogenesis. The duration of ictal discharges in the “control” condition represented ictal discharges occurring before stimulation trials. The duration of ictal discharges in the “stimulation” (Stim) condition represented ictal discharges occurring during successful stimulation trials. The duration of ictal discharges in the “poststimulation” (Poststim) condition represented ictal discharges occurring immediately following stimulation trials. Ictal recovery time was measured from the end of the last optogenetic pulse to the start of the next ictal discharge. To quantify the responses to optogenetic pulses, we measured the delay, amplitude, and duration of each response. The delay of each response was measured from the time the LED was on until the time the first deflection from baseline occurred. The negligible artifacts that occurred during the 1 ms pulse were not considered in the response onset. The amplitude of each response was measured as the peak minus the trough of the resulting waveform. The duration of the response was measured from the first deflection from baseline until the return to baseline.
Spectral analysis.
Field potentials were analyzed using the spectrogram method with a discrete short-time Fourier transform. Recordings were first filtered between 1 and 500 Hz and then downsampled to 2000 Hz to eliminate any possible effects caused by aliasing. Datasets were separated into 1 s intervals to which a Hamming window was applied, and the spectrogram was elaborated. To enhance the detection of oscillations, a gamma correction with a factor of 0.1 was applied to the spectrogram to improve their contrast to random noise. The average power in the theta (4–12 Hz), beta (15–35 Hz), and gamma (40–55 Hz) frequency bands was calculated for a period of 20 s before ictal events, 5 s after ictal onset, and during interictal time periods.
Statistical analysis.
Measurements throughout the text are expressed as the mean ± SEM. Data were compared using parametric ANOVAs followed by Bonferroni's post hoc corrections for multiple comparisons. Results were considered significant if the p value was <0.05. Virus expression across the three experimental groups was compared using the nonparametric Kruskal–Wallis (KS) one-way ANOVA.
Results
As described in the study by Shiri et al. (2016), 4-AP application in slices obtained from the three types of transgenic mice induced spontaneous epileptiform activity with similar electrographic characteristics. The average intervals of spontaneous ictal discharge occurrence were 110.23 ± 6.24, 153.46 ± 9.51, and 145.43 ± 11.14 s, respectively, in CaMKII, PV, and SOM mice (not significantly different). Furthermore, the average duration of ictal discharges obtained from ∼140 events/transgenic type were 52.85 ± 1.58, 56.45 ± 1.31, and 55.67 ± 1.02 s, respectively, in CaMKII, PV, and SOM mice (not significantly different).
Opsin expression and specificity in the three experimental groups
To assess the specificity of virus expression in EC within each experimental group, we examined eYFP distribution across the region and coexpression with the different cell type markers. Virus expression was distributed extensively across the EC in the three strains used (Fig. 1A–C). We found that the eYFP reporter was strongly expressed in principal cells as 97.0 ± 0.2% of cells positive for CaMKII also coexpressed eYFP (total number of cells counted, 1064; n = 3 mice). Nonspecific expression was very limited in these mice since only 1.0 ± 0.9% of eYFP-positive neurons did not express CaMKII (Fig. 1D). In PV-Cre mice, 91.0 ± 0.4% of interneurons positive for PV also coexpressed eYFP (total number of cells counted, 371; n = 3 mice), while 1.5 ± 0.3% of cells expressing the virus were negative for PV (Fig. 1E). In the SOM-Cre strain, 83.0 ± 1.9% of interneurons positive for SOM coexpressed eYFP (total number of cells counted, 325; n = 3 mice), whereas 32.5 ± 1.1% of eYFP-positive cells were negative for the SOM marker (Fig. 1F). The higher proportion of unspecific viral expression in this strain seems to stem from one of the three mice tested (see distribution of data in Fig. 1G). It remains unclear why there was a high proportion of eYFP-positive cells in this particular SOM-Cre mouse that was negative for SOM; however, this finding is not alarming as we found no statistically significant difference in the proportion of eYFP specificity among the three strains used (Kruskal–Wallis test = 5.422, n.s.; n = 9; Fig. 1G).

Specificity of ChETA-eYPF expression in EC of three mouse strains. A–C, Low-magnification microphotographs of EC horizontal sections immunostained for eYFP in a representative CaMKII-Cre (A), PV-Cre (B), or SOM-Cre (C) mouse. D–F, Double immunostaining for YFP (green) and either CaMKII (D), PV (E), or SOM (F, magenta). Bar graphs quantifying the proportion of cells positive for eYFP and the corresponding cell marker are shown in the lower right corner of each panel (n = 3 mice/group; total number of cells counted: CaMKII, 1064; PV, 371; SOM, 325). In CaMKII-Cre mice, 97.0 ± 0.2% of CaMKII neurons expressed ChETA-eYFP, while 1.0 ± 0.9% of eYFP neurons were negative for CaMKII. In PV-Cre mice, 91.0 ± 0.4% of PV interneurons expressed ChETA-eYFP, while 1.5 ± 0.3% of eYFP neurons were negative for PV. In SOM-Cre mice, 83.0 ± 1.9% of SOM interneurons expressed ChETA-eYFP, while 32.5 ± 1.1% of eYFP neurons were negative for SOM. G, Columnar scatter plots comparing the specificity of eYFP expression in the three experimental groups. Each data point (red) represents the proportion of specific viral expression in brain slices obtained from each mouse. The horizontal line in each plot represents the mean and the SEM for the three mice tested from each strain. Note that there was no statistically significant difference in the proportion of eYFP transfection specificity among the three strains (KS test = 5.422, n.s; n = 9). Scale bars: A–C, 200 μm; D–F, 30 μm.
Optogenetic activation of CaMKII-positive neurons
First, we used brain slices (n = 7) obtained from six transgenic mice expressing the ChETA opsin in CaMKII-positive principle cells in the EC; spontaneous ictal discharges lasting 51.94 ± 2.63 s on average were recorded in all experiments during continuous perfusion with 4-AP-containing aCSF (Fig. 2Aa). Optogenetic stimulation of CaMKII-positive principal cells using 1 ms light pulses at 1 Hz for 180 s disrupted this ictal activity and significantly reduced its rate of occurrence from 0.31 ± 0.06 to 0.11 ± 0.03 discharges/min (60% reduction; p < 0.05; Fig. 2B). In 51% of the optogenetic stimulation trials (n = 21), an initial ictal discharge of shorter duration (34.13 ± 2.21 s; p < 0.05; Fig. 2C) was elicited and was followed by stimulation-induced field potentials (Fig. 2Ab; ANOVA: df = 2, F = 10.6, p < 0.001). In the remaining recordings (n = 20), 1 Hz stimulation of principal cells was effective in blocking ictal discharges for the entire duration of the session (Fig. 2Ac). It should be emphasized that partial or full blockade of ictal discharges during stimulation of CaMKII-positive principal cells could occur in different sessions performed in the same slice. Following termination of this stimulation paradigm, ictal activity recovered to control (prestimulation) conditions within 135.35 ± 12.49 s in both outcomes with similar duration, rate of occurrence, and electrographic pattern (Figs. 2A; see also Fig. 5).

Optogenetic activation of CaMKII-positive principal cells reduces ictal discharges. Aa, Spontaneous ictal discharges can be recorded from the EC following 4-AP administration (Control). Ab, A series of 200 s protocols were applied sequentially where we stimulated CaMKII cells using 1 ms pulses at 1 Hz for 180 s (Stim) followed by gap-free recordings of similar duration where we recorded the poststimulus 4-AP-induced network activity (Poststim); in 51% of stimulation trials, a brief ictal discharge was elicited followed by stimulation-induced field potentials (n = 21). Ac, The gap between the stimulation and poststimulation recordings was 4 s; in 49% of stimulation trials, ictal discharges were completely blocked (n = 20). The gap between the stimulation and poststimulation recordings was 3 s. In both Ab and Ac, the network fully recovers once the optogenetic stimulation is aborted and can generate ictal discharges once again. B, The rate of ictal discharges was 0.31 ± 0.06 discharges/min in the control and poststimulus recordings and 0.11 ± 0.03 discharges/min in the Stim recordings. C, The duration of ictal discharges in control and post-Stim conditions were 51.94 ± 2.63 and 46.08 ± 2.42 s, respectively. The duration of ictal discharges that occurred during Stim were significantly shorter at 34.13 ± 2.21 s. *p < 0.05.
Optogenetic activation of PV-positive interneurons
Next, we used brain slices (n = 7) obtained from seven transgenic mice expressing the opsin in PV-positive interneurons in the EC. As illustrated in Figure 3, optogenetic stimulation of PV-positive interneurons using the same stimulation paradigm as for principal cell stimulation (1 ms light pulses at 1 Hz for 180 s) significantly reduced the rate of spontaneous ictal discharges from 0.25 ± 0.01 to 0.12 ± 0.01 discharges/min (51% reduction; p < 0.01; Fig. 3B). PV-positive interneuron stimulation resulted in ictal discharges of shorter duration (24.69 ± 1.20 vs 72.55 ± 3.78 s on average; p < 0.05; Fig. 3C) followed by direct responses to optogenetic stimulation in 17% of trials (n = 4; Fig. 3Ab; ANOVA: df = 2, F = 12, p < 0.001). In 83% of trials (n = 19), optogenetic stimulation of PV interneurons only elicited brief field potentials while blocking ictal events for the duration of the recording (Fig. 3Ac). Ictal activity in this series of experiments recovered within 67.93 ± 6.90 s (see Fig. 5) with a similar rate of occurrence and a shorter duration (p < 0.05; ANOVA: df = 2, F = 11.6, p < 0.001).

Optogenetic activation of PV-positive interneurons reduces ictal activity. Aa, Spontaneous (Control) ictal discharges recorded from the EC are shown. Ab, A series of 200 s protocols were applied sequentially where we stimulated PV cells using 1 ms pulses at 1 Hz for 180 s (Stim) followed by gap-free recordings of similar duration where we recorded the poststimulus 4-AP-induced network activity (Poststim); in 17% of stimulation trials, a brief ictal discharge was elicited (n = 4). Ac, The gap between the stimulation and poststimulation recordings was 3 s; in 83% of stimulation trials, ictal discharges were completely blocked (n = 19). The gap between the stimulation and poststimulation recordings was 3 s. In both Ab and Ac, the network fully recovers once the optogenetic stimulation is aborted and can generate ictal discharges once again. B, The rate of ictal discharges was 0.25 ± 0.01 discharges/min in the control and Poststim recordings and 0.12 ± 0.01 discharges/min in the Stim recordings. C, The duration of ictal discharges was 72.55 ± 3.78 s in control, 24.67 ± 1.20 s in Stim, and 57.40 ± 5.03 s in Poststim conditions. **p < 0.01, *p < 0.05.
Optogenetic activation of SOM-positive interneurons
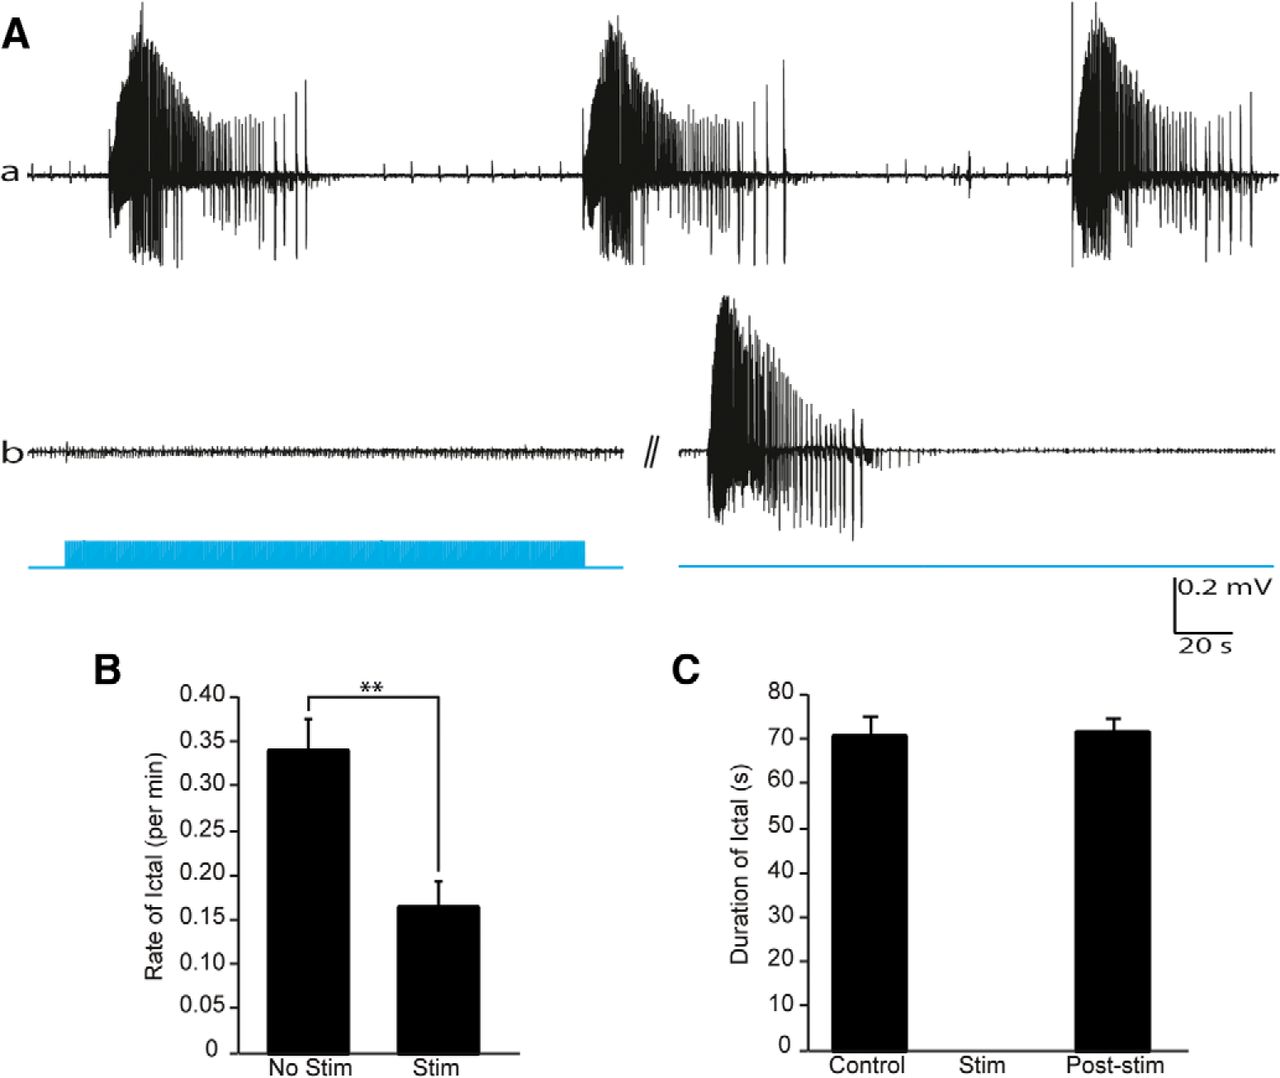
In a final set of experiments, we used slices (n = 6) obtained from four transgenic mice expressing the opsin in SOM-positive interneurons in the EC. Optogenetic stimulation of SOM-positive interneurons using 1 ms light pulses at 1 Hz for 180 s significantly reduced the rate of 4-AP-induced ictal discharges from 0.34 ± 0.04 to 0.16 ± 0.03 discharges/min (49% reduction; p < 0.01; Fig. 4B). In all successful trials (n = 15), 1 Hz stimulation of SOM interneurons was effective in blocking ictal discharges for the entire duration of the recording (Fig. 4Ab). Following this stimulation paradigm, ictal activity recovered on average within 70.45 ± 23.50 s (Fig. 4) and with a similar duration (Fig. 4C) and pattern of occurrence as seen before stimulation. As illustrated in Figure 5, ictal discharges reappeared significantly earlier following PV interneuron (p < 0.01) and SOM interneuron (p < 0.05) stimulation compared with principal cell stimulation.

Optogenetic activation of SOM-positive interneurons reduces ictal activity. Aa, Spontaneous (Control) ictal discharges recorded from the EC are shown. Ab, A series of 200 s protocols was applied sequentially in which we stimulated SOM cells using 1 ms pulses at 1 Hz for 180 s (Stim) followed by gap-free recordings of similar duration where we recorded the poststimulus 4-AP-induced network activity (Poststim); in all stimulation trials, ictal discharges were completely blocked (n = 15). The gap between the stimulation and poststimulation recordings was 4 s. Following stimulation, the network fully recovers and can generate ictal discharges once again. B, The rate of ictal discharges was 0.34 ± 0.04 discharges/min in the control and Poststim recordings and 0.17 ± 0.03 discharges/min in the Stim recordings. C, The duration of ictal discharges was 70.40 ± 4.49 s in control and 71.35 ± 3.44 s in Poststim conditions. **p < 0.01.

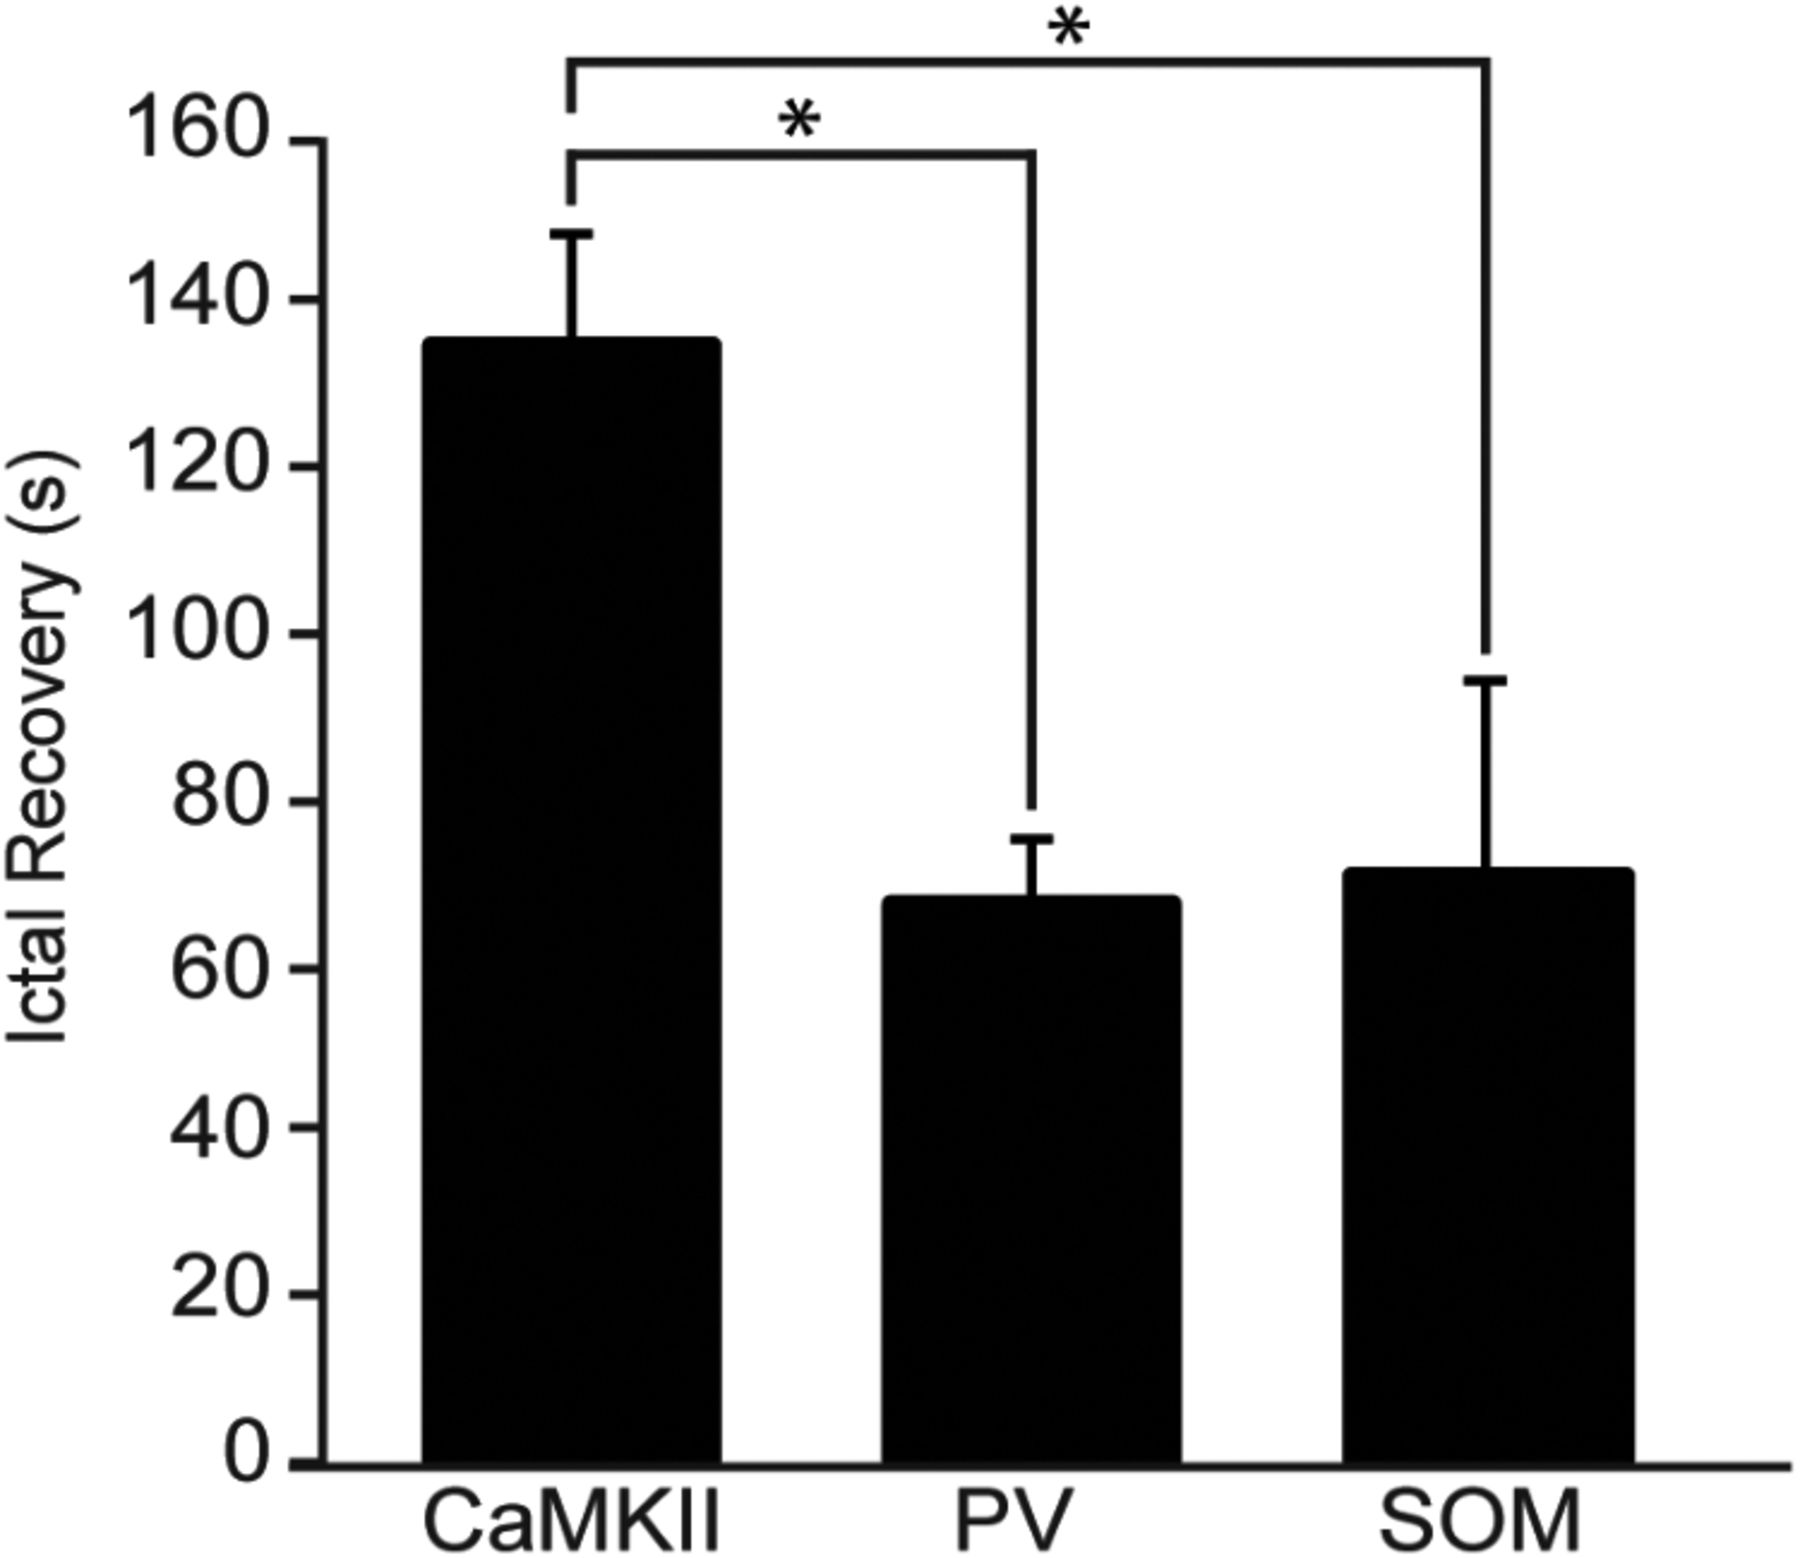
Recovery of ictal discharges. Bar graph depicting the average amount of time taken for ictal discharges to reappear following repetitive optogenetic stimulation of CaMKII, PV, or SOM neurons. Note that ictal discharges recovered significantly sooner when interneurons were the target of stimulation. *p < 0.05.
Characterization of field responses to optogenetic stimulation
To examine the electrographic properties of the field potentials evoked by the different optogenetic stimulation procedures, we superimposed 180 consecutive responses/group (Fig. 6A, gray traces). The average delay of the responses from stimulation onset was comparable in each group (Fig. 6B). The average field potential amplitude was highest (p < 0.05) in the CaMKII group at 0.41 ± 0.02 mV (ANOVA: df = 2, F = 303.2, p < 0.001; Fig. 6C). The average durations of the responses were 0.20 ± 0.01 s in the CaMKII group, which was significantly longer than in the PV group (0.26 ± 0.02 s) and the SOM group (0.19 ± 0.02 s; p < 0.05; Fig. 6D; ANOVA: df = 2, F = 5.8, p < 0.01).

LFP transients evoked by optogenetic stimulation. Aa–Ac, Overlap (gray traces) and average (black trace) of 180 consecutive field responses to CaMKII cell stimulation (Aa), PV cell stimulation (Ab), and SOM cell stimulation (Ac) using 1 ms light pulses. B, Bar graph showing the average delay of the field responses measured from the onset of the light pulses. C, Bar graph showing the amplitude of field responses evoked by 1 ms light pulses in each group. D, Bar graphs showing the duration of optogenetically induced field responses in each group. *p < 0.05.
To further characterize the properties of field responses to optogenetic stimulation, we have analyzed the spectral power in the theta (4–12 Hz), beta (15–35 Hz), and gamma (40–55 Hz) frequency bands in the CaMKII, PV, and SOM groups. Figure 7A shows representative interictal spikes with their corresponding spectrograms when no optogenetic stimulation was performed (OFF condition), whereas Figure 7B shows the spectral properties of field responses under optogenetic stimulation (ON condition). In the OFF condition, there were no significant differences between the average power in the theta, beta, and gamma frequency bands among the three groups in a time period of 20 s before ictal events, 5 s after ictal onset, and during interictal spiking (Fig. 7C). Under optogenetic stimulation, during interictal events, similar results were observed since no significant differences were observed in spectral power among the three groups (Fig. 7D).
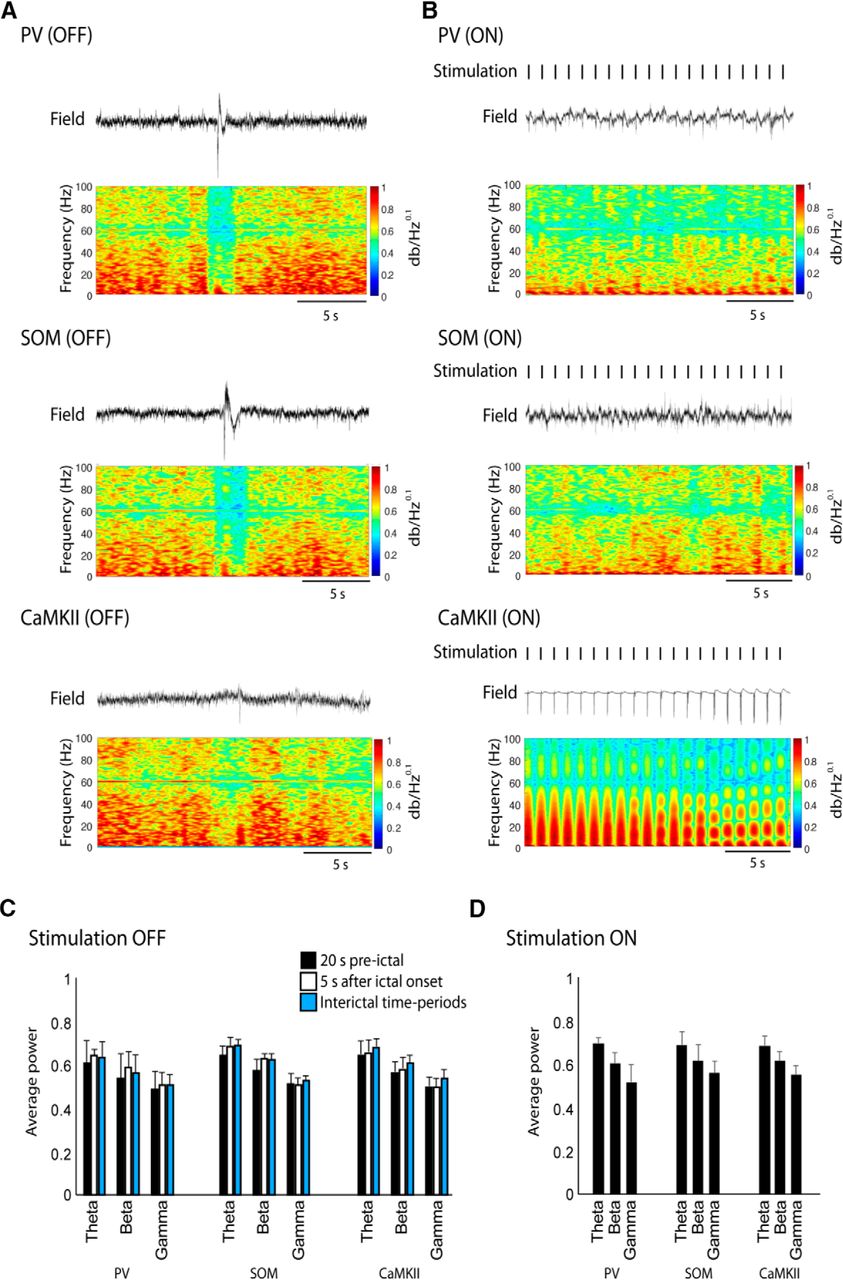
Power spectral analysis of field recordings during the optogenetic stimulation of PV-, SOM-, and CaMKII-positive cells. A, Power spectral analyses (from 1 to 100 Hz) of field recordings in the control (optogenetic stimulation OFF) condition. Note that no significant differences are observed among the spectrograms in the PV-, SOM-, and CaMKII-positive recordings. B, Power spectral analyses during time periods of optogenetic stimulation (ON). Note that the stimulation of CaMKII-positive principal cells induced high-amplitude field potential responses that were not recorded during PV- and SOM-positive interneuron stimulation. These sharp responses (see also Fig. 2Ac) were, as expected, associated with high power in frequencies from 1 to 50 Hz in the spectrogram due to the abrupt change in the signal. C, Bar graph showing the average power in the theta (4–12 Hz), beta (15–35), and gamma (40–55 Hz) frequency bands in the OFF condition. The average power for each frequency band was calculated 20 s before an ictal event, 5 s after onset, and during interictal time periods. No significant differences were observed. D, Bar graph showing the average power during optogenetic stimulation. The power in each frequency band was calculated during the interictal time periods. No significant differences were observed.
Discussion
We used an optogenetic approach of LFS in the EC to investigate the role of local interneuron subtypes and for the first time, of principal cells, in the process of stimulus-induced suppression of ictogenesis during application of 4-AP. The main findings of our study can be summarized as follows: (1) 4-AP-induced ictal discharges had similar features in slices obtained from the three transgenic mice used in this study; (2) using the same experimental parameters, optogenetic LFS of CaMKII-positive principal cells and PV- or SOM-positive interneurons in EC significantly reduced the rate of 4-AP-induced ictal discharges; and (3) optogenetic stimulation applied to principal cells had a longer lasting effect in suppressing ictal discharges once stimulation was aborted.
Evidence obtained from rodent models of temporal lobe epilepsy have shown that LFS can reduce both excitability and seizure frequency (Barbarosie and Avoli, 1997; D'Arcangelo et al., 2005; Kile et al., 2010; Rashid et al., 2012). However, it remained unclear whether this effect could be attributed to excitatory or inhibitory neurons or other cells of the CNS, as electric stimuli do not discriminate between different cell types. Using optogenetic stimulation, we showed that the activation of either principal cells or interneurons is effective in disrupting synchronicity and reducing seizure activity in the 4-AP model in vitro. However, variations in the size and shape of the waveform elicited by optogenetic stimulation of each cell population suggest that different mechanisms may be involved in the observed ictal suppression. For instance, stimulated principal cells in the EC project to the molecular layer of the hippocampus to activate inhibitory interneurons, which may in turn project back to the EC and exert a local inhibitory effect (Xu et al., 2016). PV-positive interneurons on the other hand have dense horizontal axon arborization targeting somatic regions of principal cells (Kawaguchi and Kondo, 2002). Optogenetic activation of this subpopulation of interneurons at low frequency would therefore exert synchronous inhibition of many principal cells in the region to locally restrain seizures (Cammarota et al., 2013). However, both principal cell and PV interneuron stimulation could initially trigger a short ictal discharge through a direct increase in excitability or rebound excitation, respectively. Finally, SOM-positive interneurons innervate dendritic shafts of fewer principal cells and may thus exert a more traditional GABA-mediated inhibitory effect on local cells (Kawaguchi and Kondo, 2002). However, these mechanisms should be confirmed using dual whole-cell patch-clamp recording techniques in future studies.
We have found here that 4-AP-induced ictogenicity in EC is depressed by repetitive stimulation of interneurons using 1 ms pulses at 1 Hz. These results are in line with results from other in vitro studies in which it was shown that electrical stimuli (Barbarosie and Avoli, 1997; Barbarosie et al., 2002; Benini et al., 2003) and optogenetic stimuli (Krook-Magnuson et al., 2013; Ledri et al., 2014; Ladas et al., 2015) delivered at low frequencies can reduce and block ictal discharge generation. The novel finding of our study, however, is that the LFS of principal cells in the EC is also effective in temporarily blocking ictal discharges. This finding is rather surprising as other studies have previously shown that the inhibition of excitatory cells in the hippocampus results in an anti-ictogenic action (Tønnesen et al., 2009; Krook-Magnuson et al., 2013). Specifically, Tønnesen et al. (2009) demonstrated that selective hyperpolarization of CaMKII-positive neurons in the hippocampus is effective in attenuating stimulation train-induced bursting. The differences observed in these studies and ours may be attributed to the different models of hyperexcitability used and the different structures being studied.
It may seem untenable that repeated stimulation of both principal cells and interneurons can play a protective role against ictal discharge generation. However, the common feature in these experiments is that we are increasing neuronal spatial synchrony by stimulating at low frequencies and thus protecting against ictogenesis (Timofeev and Steriade, 2004; Schindler et al., 2007). Similar slow repetitive hypersynchronous discharges occur toward the end of seizures in vitro and in vivo and are thought to be a mechanism of seizure termination (for review, see Timofeev and Steriade, 2004; de Curtis and Avoli, 2016). Selective activation of interneuron subtypes or principal cells induces rebound or direct excitatory bursting in the principal cell network, thus causing entrainment and consequently an overall suppression of hyperactivity (Ladas et al., 2015).
Previous studies have shown that repetitive stimulation can restrain ictal discharge generation in EC by clamping GABA-mediated potentials that would otherwise lead to ictal discharges due to the large elevations in extracellular potassium that are associated with them (Eng and Kocsis, 1987; Barbarosie et al., 2002). This hypothesis is supported by experiments that showed elevations in extracellular potassium induced by electrical stimulation delivered every 2 s is significantly lower than those induced by stimuli delivered every 10 s (Avoli et al., 2013). In other words, stimulating the network more frequently (i.e., 1 Hz) leads to an overall smaller elevation and accumulation of extracellular potassium than less frequent interictal discharges would induce, thus protecting against ictogenesis. These transient increases in extracellular potassium due to repetitive GABAA receptor activation can be reproduced presumably with any of the three procedures used in this study, either directly (through interneuron stimulation) or indirectly (through principal cell stimulation).
The idea that interictal discharges can exert an anti-epileptic effect is not novel. Indeed, it has been shown that the application of the GABAB receptor agonist baclofen (2 μm) blocks interictal spikes and leads to a prolongation of ictal-like discharges in the in vitro 4-AP model (Watts and Jefferys, 1993). However, the anti-epileptic effect of interictal events is not likely to be mediated through GABAB receptor activity since blocking these receptors does not affect the ability of low-frequency electrical stimulation to abolish ictal discharges (Barbarosie et al., 2002).
Our results show that recovery of spontaneous 4-AP-induced ictal discharges took longer in experiments where the optogenetic stimulation targeted principal cells rather than interneurons. This may be due to the morphology of interneurons and the large pool of local principal cells that they may target (Vereczki et al., 2016), which presumably causes a larger rebound activation and synchronization in the target excitatory cells. This orchestrated synchronization could explain why ictal discharges recover sooner in experiments where interneurons are the target of stimulation. Alternatively, during optogenetic LFS of each cell population, the network is generating interictal events that are followed by interspike inhibition due either to synchronization of post-excitatory synaptic inhibition or due to changes in extracellular pH (de Curtis et al., 1998) or extracellular potassium concentrations (Köhling et al., 1995); these events may prevent ictogenesis. Since the field responses evoked by principal cell stimulation is larger than those evoked by interneuron stimulation (Fig. 6C), the synchronization of post-excitatory inhibition is also expected to be larger in these experiments, which could explain why principal cell stimulation has a more prolonged anti-ictogenic effect. This hypothesis is supported by human data that have revealed that sustained interictal spiking reduces the probability of generating ictal discharges (for review, see de Curtis and Avanzini, 2001).
In conclusion, we have discovered that LFS of specific cell populations, principal cells or interneuron subtypes, can reliably shorten or delay seizures in vitro presumably by disrupting synchronicity. It remains unclear whether these stimulation paradigms can control ictogenesis when applied to other in vitro models and more importantly whether low-frequency optogenetic stimulation can modulate ictogenesis and epileptogenesis in models in vivo. However, our work suggests that optogenetic LFS targeting a single cell population at a time can address the limitations of classic LFS techniques and may thus constitute a more reliable means for controlling seizures in patients that present with focal seizures.
Footnotes
This study was supported by the Canadian Institutes of Health Research (Grant 74609 to M.A.; Grant MOP119340 to S.W.). Z.S. received a student scholarship from the Savoy Foundation for Epilepsy.
The authors declare no competing financial interests.
- Correspondence should be addressed to Dr. Massimo Avoli, Montreal Neurological Institute, McGill University, 3801 University Street, Montréal, QC H3A 2B4, Canada. massimo.avoli{at}mcgill.ca


