

Abstract
Multiple somatosensory cortices of adult primates reorganize following spinal cord injury, but little is known about the temporal dynamics and inter-areal differences of the reorganization. Using longitudinal high-resolution fMRI in combination with microelectrode recordings and tracer histology, we previously illustrated a two-phase dynamic spatial reorganization of digit representations in area 3b within weeks after a unilateral lesion of the dorsal column in squirrel monkeys (Chen et al., 2012). Here we report that higher-order area 1 and secondary somatosensory cortex (S2) underwent similar spatial reorganizations, which were characterized by shifted and expanded digit activations at week 4 after lesion, which then shifted back and contracted by week 8. In addition, the responsiveness of areas 3b and 1, and S2, as measured by the magnitude of the BOLD signal change to tactile stimuli, was reduced markedly at 4 weeks and then recovered to ∼50% of the prelesion level at 8 weeks, a time when behavioral recovery was complete, as assessed by successful food retrieval rates. Across animals, the extents of spatial reorganizations and changes in cortical responsiveness and activation sizes in all three areas were correlated with the degree of afferent disruption. In summary, our data show that more severe afferent disruption was associated with greater cortical plasticity and behavioral impairment. Reorganization that occurred in area 3b, area 1, and S2 were similar across most measures.
Introduction
Spinal cord injury (SCI) results in motor and/or sensory dysfunction. Over time, some functions recover spontaneously, while others remain permanently impaired (Finger and Almli, 1985; Almli and Finger, 1988; Ballermann et al., 2001; Darian-Smith and Ciferri, 2005; Padberg et al., 2010). Plastic changes, including reactivation (defined as regaining responsiveness) and reorganization (defined as reorganizing a somatotopic map), in subcortical and cortical regions are believed to play crucial roles in functional and behavioral recovery after SCI (for review, see Buonomano and Merzenich, 1998; Darian-Smith and Brown, 2000; Jones, 2000a; Ramachandran, 2005; Kaas et al., 2008). Much of the existing knowledge, however, is derived from studies that examined only one cortical area (e.g., S1 or S2) at a time (Pons et al., 1988). Fewer studies have examined how different cortical areas within the same information-processing system work together to recover cortical function or compensate for dysfunction after injury (Merzenich et al., 1983; Tandon et al., 2009; Bowes et al., 2013), and even fewer studies have reported postlesion effects at several times after injury (Qi et al., 2011). One approach to this question is to simultaneously and longitudinally monitor cortical plasticity changes (reactivation and reorganization) that occur in multiple areas, and then to correlate these changes with behavioral recovery. Information about the differences in cortical reorganization across different neuroanatomical and functional regions will elucidate the specific roles that each area plays, knowledge that is critical for developing effective therapeutic strategies to promote behavioral recovery after SCI.
With these goals in mind, we have conducted a series of studies on early somatosensory cortices of squirrel monkeys before and after unilateral dorsal column lesions. By using a combination of longitudinal sub-millimeter resolution fMRI, microelectrode electrophysiological mapping recording, optical imaging of intrinsic signals, and histological evaluations of lesion extent, our previous studies have led to several novel findings. First, after extensive disruptions of dorsal column afferents, much of the hand representations in both areas 3b and 1 reactivate within weeks after the spinal cord lesions. Furthermore, the reactivation patterns of area 1 did not completely reflect those of area 3b (Qi et al., 2011). Second, using longitudinal sub-millimeter resolution fMRI, we found that area 3b underwent a dynamic two-phase spatial reorganization, and the extent of plasticity correlated with the severity of afferent disruption (Chen et al., 2012). Third, after deafferentation, subthreshold activity played an important role during the reactivation process (Chen et al., 2012; Wang et al., 2013).
The current study is the fourth study in this series, and it aims to address the following four questions. (1) Does the dynamic spatial reorganization observed in deafferented area 3b also occur in higher-order area 1 and S2? (2) Do cortical reactivations and reorganizations processes differ across areas 3b and 1, and S2? (3) How does the cortical responsiveness to tactile stimuli change over time after the lesion? And (4), which measures of cortical plasticity correlate with the severity of the dorsal column lesion and the severity of the behavioral impairment on food retrieval task?
Materials and Methods
Five male adult squirrel monkeys were included in this study. Three animals underwent partial dorsal column lesion, and two animals remained intact. Baseline data were derived from the two intact animals, and prelesion data were derived from one of the lesioned animals, which was scanned multiple times before the lesion. Dense microelectrode mapping and recording were conducted between weeks 8 and 9 postlesion. Histological evaluation was performed on postmortem spinal cord and brain tissue to assess the level and extent of the dorsal column lesion, and the locations and inter-areal borders of areas 3b and 1, and S2; these data were reported in detail in our previous publication (Qi et al., 2011). This report focuses on the longitudinal fMRI changes for digit activations after dorsal column lesion.
Animal preparation.
For the fMRI experiments, each animal was sedated with ketamine hydrochloride (10 mg/kg)/atropine (0.05 mg/kg) and maintained on mechanical ventilation with isoflurane anesthesia (0.5–1.1%) delivered in a 70:30 O2/N2O mixture. After intubation, the animal was placed in a custom-designed MR cradle, and the head was secured with ear and head bars. A solution of 2.5% dextrose in saline solution was infused intravenously (3 ml/kg/h) throughout the imaging session to prevent dehydration and provide caloric energy. Saturation of peripheral oxygen and heart rate (Nonin), EKG, end-tidal CO2 (22–26 mmHg; SurgiVet), and respiratory pattern (SA Instruments) were monitored. Rectal temperature was monitored (SA Instruments) and maintained between 37.5 and 38.5°C by means of a circulating water blanket (Gaymar Industries). Vital signs were monitored throughout the procedure from induction of anesthesia until full recovery. Standard procedures were used in the fMRI and electrophysiological studies, as published previously (Chen et al., 2007, 2009, 2012). All procedures were in compliance with the Society for Neuroscience guidelines for the use of animals in research and were approved by the Institutional Animal Care and Use Committee of Vanderbilt University.
Stimulus protocol.
During the sedation period, the fingers of the animals were secured by gluing small pegs to the fingernails and fixing these pegs firmly in plasticine, leaving the glabrous surfaces available for vibrotactile stimulation with a rounded plastic probe (2 mm diameter) connected to a piezoelectric device (Noliac). Grass Instruments S48 square wave stimulators were used to drive Piezos to indent at 0.48 mm vertical displacement (Natus Neurology). Innocuous vibrotactile stimuli were delivered at a rate of 8 Hz with 30 ms pulse duration to individual distal finger tips (D1-D5) in blocks of 30 s duration. During off blocks (30 s), the probe remained lightly touching the skin. Typically, within a single fMRI imaging session, each stimulus condition was repeated seven times and was randomly repeated two to four times (runs) on individual fingers. Each fMRI run consisted of a total of 300 image frames, including seven stimuli blocks and eight baseline blocks, with each block containing 20 image frames.
MRI methods.
All MRI scans were performed on a 9.4 T 21 cm narrow-bore Inova magnet (Varian Medical Systems) using a 3-cm-diameter surface transmit–receive coil centered over S1 and S2 contralateral to the stimulated hand. Because the goal of this study was to map tactile responses in S1 and S2, four 2-mm-thick oblique image slices were centered over the central and lateral sulci to maximize mapping power. fMRI BOLD data were acquired from the same slices using a gradient echoplanar imaging (EPI) sequence [repetition time (TR), 1500 ms; echo time (TE), 19 ms; 550 × 550 × 2000 mm3 voxel size], then analyzed and spatially interpolated to overlay on T2*-weighted gradient echo high-resolution structural images (TR, 200 ms; TE, 14 ms; 78 × 78 × 2000 μm3 resolution) for display. Both surface and transcortical blood vessel features were easily identifiable, and were used for coregistration of MRI maps with surface blood vessel maps obtained later during microelectrode mapping/recording sessions, as well as for MRI maps obtained across imaging sessions conducted on different days (Fig. 1).

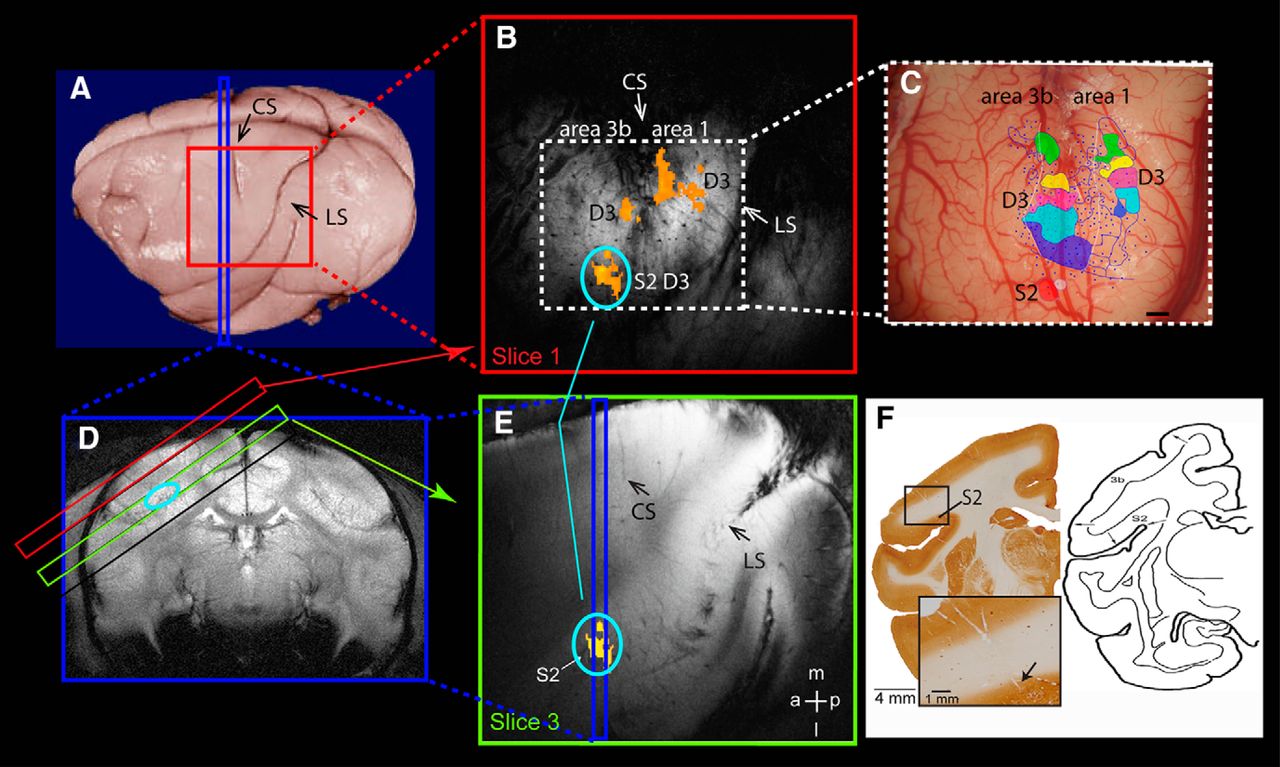
Methods for identifying area 3b, area 1, and S2. A, On postmortem brain, the red square shows the oblique imaging field of view and the blue strip shows the placement of one sample coronal image slice. CS, Central sulcus; LS, lateral sulcus. B, The top oblique image (red square) shows fMRI activations (orange patches) to D3 stimulation in area 3b, area 1, and surface-projected S2 activation (orange patch with light blue circle). C, Corresponding blood vessel map shows the surface vessel pattern, the electrode penetration sites (small blue dots), and the classified digit representations (one color patch for one digit) in area 3b, area 1, and S2. The two purple color patches indicate the D3 representations. The blue line lateral to D1 representation (blue patch) indicates the hand–face border. Scale bar, 1 mm. D, The coronal T2-weighted structural image shows the placements of four oblique imaging slices (red, black, green, and black rectangle outlines) and the localization of S2 activation (oval light blue outline) on the top bank of LS. E, The deep (third slice) oblique image (green slice) slice shows the S2 activation (orange patch with light blue oval) and its spatial relationship with the validation coronal slice (blue strip). F, Left, The corresponding coronal brain slice with CO stain shows the electrode penetration tracks and the validation sites for S2 activation. High-magnification insert shows the end of the track (black arrow). Scale bar, 1 mm. Right, Anatomical reference for S2 location in new world monkeys (adapted from Jones and Burton, 1976 with permission). a, Anterior; l, lateral; m, medial; p, posterior.
fMRI data analysis.
The BOLD time courses of the EPI data were temporally smoothed with a low-pass filter with a 0.25 Hz cutoff frequency (fslmaths, FSL). No spatial smoothing was applied. Activation maps were created by voxelwise correlation analysis, using the Hemodynamic Response Function (HRF) convolved stimulus presentation paradigm (3dDeconvolve, AFNI). Voxels exhibiting significantly correlated BOLD signal changes (p < 0.0001, uncorrected, equal to p < 0.05 Bonferroni corrected) and organized in a minimum of five continuous voxels (upsampled 78 × 78 × 2000 mm2 voxel size) were defined as an activation cluster. Activation maps were registered and superimposed on corresponding T2-weighted anatomical images using a linear image registration tool (FLIRT, FSL), then displayed as statistical t-value maps, with warm color indicating high t-values (Figs. 1, 2, 3). Using these activation criteria, we quantified the percentage of detected activation (activated runs/total runs acquired × 100%) to indicate the activation detection rate for each area within each imaging session, before or after SCI.
Quantification of BOLD signal amplitude.
We extracted BOLD signal time courses from a single peak voxel (with a maximal t-value) in each of the areas (3b, 1, and S2) to quantify amplitudes and temporal profiles of BOLD responses to stimuli. BOLD signal time courses were averaged across runs within each session for individual areas in each monkey. To eliminate physiological noise-related signal variation, we applied a double gamma-variate fit (Zhang et al., 2007) to the averaged BOLD time courses to derive measures of peak, time to peak, and area under the curve.
Statistical analysis.
We performed different statistical analyses on different measures. For fMRI data, measures of peak, time to peak, and area under the curve from each animal were examined for statistical significance using a nonparametric Kruskal–Wallis one-way ANOVA followed by Dunn's method for multiple comparisons (see Fig. 6). Region of interest-based BOLD time course data are presented as the mean ± SEM unless stated otherwise. χ2 analysis (p < 0.05) was used to determine whether the percentages of BOLD signal change differed before lesion (prelesion) and after lesion (4 and 8 weeks postlesion) in areas 1 and 3b, and S2 (Table 1). We used an unpaired t-test with two-tailed p-value to examine the stability of the BOLD signal amplitude obtained from two different days (i.e., two groups of data; Fig. 2). One-way ANOVA with Tukey's post-test was also used to test the significances of interdigit and intradigit distances obtained before and after lesion (see Fig. 5). A p-value <0.05 was considered statistically significant.
Detection rate of BOLD activation at each area
Alignment of cross-session BOLD fMRI activation and electrophysiology maps.
To quantify the spatial reorganization of fMRI activation maps after spinal cord lesion and to correlate fMRI activation maps with digit representation maps defined by dense microelectrode recording, we have developed methods to register different types of images: structural MR images across imaging sessions (MRI–MRI); digital blood vessel images to structural MRI images; and histology slices to blood vessel images (Chen et al., 2007). For the first two types of registrations, we identified corresponding anatomical and blood vessel landmarks in each structural image, such as the visible surface vessels and transcortical veins; these coordinates were then entered into a point-based registration algorithm (implemented in MATLAB; for details, see Chen et al., 2007). The registration transformation between these two sets of coordinates was then applied to the fMRI images, thereby coregistering the fMRI activation map to the corresponding aligned structural MR image (Hill et al., 1991; Zhang et al., 2007; Zhang et al., 2010; Lecoeur et al., 2011). The same principles were applied to MRI–blood vessel coregistration. These landmarks in both structural MRI and blood vessel images were selected without a priori knowledge of the locations of functional activations. Landmarks of surface blood vessel patterns, transcortical venous patterns, and electrical lesion sites on blood vessel maps were used to align electrophysiology maps to histological sections stained with different markers (Fig. 1). To quantify spatial fMRI activation shifts within S2 after dorsal column lesion, we aligned images across sessions by projecting S2 activations (Fig. 3D), which were located on the deeper third slice, onto the top slice (Fig. 3G) where blood vessel patterns were visible.
Quantification of fMRI activation center shift.
To assess the spatial reorganization caused by the lesion, we measured spatial shifts of single-digit representations by quantifying the distance (in millimeters) between the activation centers of the same digit obtained before and after the lesion. If two or more activation foci were detected in one area (mostly in S2) at the threshold of p = 0.0001, we measured the distances among all possible pairs of prelesion and postlesion activation foci. To maintain the highest spatial resolution possible and retain the unique activation pattern in each animal, we did not coregister activations across animals. ImageJ (National Institutes of Health) was used to locate the center of mass and to calculate distances between pairs of activation foci.
Localization of digit activations in cortical areas 3b and 1, and S2.
We used anatomical, electrophysiological, and histological information obtained in each animal to localize fMRI activations to areas 3b and 1, and S2. The identification of fMRI activation in areas 3b and 1 was usually straightforward after alignments of electrophysiology and fMRI activation maps. Localization of activation to S2, however, took several steps. For the first step, we examined the fMRI activation detected on the deeper slice 3 (Fig. 1E, yellow patch) on two different imaging planes: oblique sagittal (Fig. 1A,B) and coronal (Fig. 1D). The top bank of the lateral sulcus (indicated by the light blue circle on Fig. 1D) was used as a landmark for the location of S2 (Burton and Jones, 1976; Burton et al., 1995). In the second step, we projected the S2 activation pattern onto the top slice of the MRI image (Fig. 1B,E) to guide our subsequent electrophysiological recordings. The rich and unique pattern of surface and transcortical blood vessels in each animal provided landmarks for coregistering maps obtained with electrophysiology and MRI (Fig. 1, compare B, C). By using the blood vessel map as a reference, we then compared activations in S2 across sessions and across activations in areas 3b and 1. The third step was to relate fMRI and electrophysiological mapping results to the histological locations of the recording sites. We used electrolytic microlesions to mark sites along the trajectory of the microelectrode tracks and to locate the track (Fig. 1F). As shown by cytochrome oxidase (CO) staining of a coronal slice of one animal brain, the microelectrode recording tracks were visible (Fig. 1F). The end of the recording track was clearly located on the top bank of the lateral sulcus, where S2 is located. The site of S2 activation was in the location of the hand representation in the S2–PV (parietal ventral area) region with direct inputs from the digit cortex of area 3 in squirrel monkeys (Liao et al., 2013).
The last key validation of fMRI activation in areas 3b and 1, and S2 was derived from electrophysiological microelectrode mapping and recording studies (Fig. 1C, penetrations are shown by blue dots) in each animal. Information about neuronal response properties of receptive field sizes, preferred stimuli, and somatotopic organization (Fig. 1C, color patches) were used to determine the locations of areas 3b and 1, and S2, as well as inter-areal borders. S2 neurons typically exhibited large receptive fields, such as the entire hand, and typically responded to brushing or tapping of the skin or movement of the fingers (Friedman et al., 1980; Burton and Carlson, 1986; Krubitzer et al., 1995; Disbrow et al., 2000; Coq et al., 2004). The S2 digit representation region was small and exhibited crude digit somatotopy (Fig. 1C, red patch, hand; white patch, arm). Histological evaluation of the recording site and penetration track (Fig. 1F) further confirmed that recordings were taken from the top bank of the lateral sulcus. Because only a limited number of electrode penetrations were placed in the S2 complex, we cannot determine the subfield localization [e.g., PV, S2, and VS (ventral somatosensory area)] of the fMRI activations. Therefore, we classified this activation as a general “S2 region” activation. The territories of the hand representations in areas 3b and 1 were identified by microelectrode mapping methods and related to cortical architecture, as described in detail in our previous publications (Qi et al., 2011; Chen et al., 2012).
Spinal cord section.
Dorsal column section of the cervical spinal cord was performed under surgical-level isoflurane anesthesia (1–3%). Under aseptic conditions, a portion of the cervical spinal cord was exposed, and the dorsal columns were sectioned on one side with a fine pair of surgical scissors at cervical level C4–C6. The dura was replaced with Gelfilm and covered with Gelfoam. Additional details about surgical and postsurgical procedures can be found in our previous publications (Qi et al., 2011; Chen et al., 2012). The level and extent of the lesion were later determined by a histological evaluation of the spinal cord tissue sections. We also quantified the percentage of afferents disrupted for each monkey by measuring and comparing the cholera toxin B subunit-labeled terminals in the dorsal column nuclei on the lesion versus nonlesion side (for a detailed description, see Qi et al., 2011).
Behavioral assessment on a food-reaching and retrieval task.
Monkeys in their home cages were trained preoperatively for ∼2 weeks to use their dominant hand to retrieve a 45 mg dustless, precision, banana-flavored pellet (catalog #F0021, Bioserve) from a well (1.14 cm in diameter and 0.38 cm in depth) carved on a modified Klüver board (15.2 × 9.9 cm2). The board was placed on the top of the food bin in front of the cage. At the beginning of each trial, a sugar pellet was placed in the well. The monkey was then allowed to reach and retrieve the pellet. A total of 20 trials were administered each day. A success of reach was affirmed when the food was grasped and transferred into the mouth by the designated hand. The rate of success was calculated using the following formula: percentage of total success = (number of pellets retrieved/20) × 100. Baseline measures of successful pellet retrieval rates were calculated from 20 trials/d across 3 different days before the placement of a dorsal column lesion. The time of a successful retrieval was not included in the measure of success rate. Starting from day 3 after the dorsal column lesion, we evaluated performance on the sugar pellet retrieval task three times a week (every 2–3 d) for up to 12 weeks until performance recovered to baseline levels. The success rate was calculated each week. Using the prelesion measure of success rate as the baseline (e.g., 99%), we quantified the duration (e.g., 5 weeks) and degree (e.g., 5% drop from 99% to 94%) of impairment for each monkey, and then used the sum of these values (5 weeks + 5% decrease = 10) to index behavioral deficits. This index was plotted against the measurements of cortical reorganization to indicate the relationship between the degree of behavioral deficits and the extent of cortical plasticity (see Fig. 7).
Results
This is the fourth report in the same series of studies (Qi et al., 2011; Chen et al., 2012; Wang et al., 2013), but it includes additional control animals. We characterize lesion-induced cortical plastic changes in the spatial reorganization of digit representations (by measuring intradigit and interdigit distances) and changes in BOLD signals (amplitudes, area under the curve, and time to peak), and we examine differences among areas 3b and 1, and S2. The term “S2′” is used to indicate the secondary somatosensory region. We first present single animal data (Figs. 2, 3, 4), then group quantification (Figs. 5, 6, Table 1). To understand the factors contributing to cortical plasticity after spinal cord lesions, we assess the relationships among the extents of afferent disruption, behavioral deficits, and cortical plasticity measures across animals (Fig. 7). Finally, we summarize our findings in one schematic model (Fig. 8).

Cross-day reproducibility of BOLD activation and percentage signal change in one representative monkey (SM-C). A, Similar fMRI BOLD activation patterns to D4 stimulation are obtained from two different days (top, day 1; bottom, day 2) in areas 3b and 1 (left two images on the top oblique imaging slices) and S2 (right two images on the third oblique imaging slices), respectively. Color bar indicates the t value range. Scale bar, 1 mm. B, Single-trial BOLD time courses derived from the S2 activation clusters, which are indicated by white stars in the left two images in A. Red boxcar lines along the x-axis indicate the repeated 30 s tactile stimulation on/off cycles. C, Comparison of the cross-day peaks of percentage BOLD signal changes (mean ± SEM) in S2 for D4 (top) or all digits (D1–D4, bottom). The percentage of BOLD signal changes are calculated from all voxels within the S2 cluster, whose correlation strengths reach the statistical threshold of p ≤ 0.0001.

Parallel dynamic reorganizations of digit representation in area 3b, area 1, and S2 after unilateral partial dorsal column lesion in monkey SM-D. A–C, D1 activation in areas 3b and 1 obtained before (normal, A), 4 weeks after (B), and 8 weeks after (C) lesion. D–F, D1 S2 activations obtained before (normal, D), 4 weeks after (E), and 8 weeks after (F) lesion. G–I, The top slices show the superimposed and color-outlined area 3b, area 1, and S2 D1 activations. J, The corresponding brain surface blood vessel map shows the microelectrode penetration sites (black dots and crosses) obtained at 8 weeks postlesion and representations of the determined digits. Light blue patches show the D1 representations in areas 3b and 1, and green and yellow patches indicate the hand and arm representations in S2. Gray outlines are representations of other digits. K, Extracted and superimposed D1 fMRI activation detected in different areas prelesion (normal animals; color patches), 4 weeks postlesion (green and brown outlines), and 8 weeks postlesion (red and orange outlines), and their spatial relationship with the postlesion digits electrophysiologically defined digit map (gray outlines and light blue patches). Color dots indicate the centers of fMRI activations. Scale bars, 1 mm. a, Anterior; l, lateral; m, medial; p, posterior.

Spatial dynamic reorganization of S2 digit activations after dorsal column lesion in three other monkeys (SM-D, SM-O, and SM-C). A–G, The surface-projected and composite S2 fMRI activations obtained before and after dorsal column lesion and their spatial relationships with the digit representation map obtained at postlesion week 8. A, Composite D1–D4 prelesion activations in S2 (color outlines) overlaid on postlesion electrophysiology map of D1–D4 in area 3b, and hand and arm in S2 (color patches). Color outlines illustrate the projected location and size of fMRI activations of each individual digit (see B for digit color codes) in S2, whereas color patches present the location and size of the neuronal response, and receptive fields of neurons (hand or arm). Black curve line represents the hand–face border. B, C, Spatial relationships among all digit activations (D1–D4, color-coded outlines) at 4 weeks postlesion (B) and 8 weeks postlesion (C) with the postlesion electrophysiology map of the S2 hand region (green patches). D–G, Spatial comparison of individual digit activations (D1–D4) prelesion (pre), postlesion (post-les) 1 (4w), and postlesion 2 (8w). Scale bar, 1 mm. a, Anterior; l, lateral; m, medial; p, posterior.

Group quantifications of intradigit and interdigit fMRI activation center shifts and changes in activation sizes in S2, area 3b, and area 1 postlesion. A–C, Boxcar summary plots of intradigit activation center shifts from prelesion activation sites (prelesion) in S2 (A), area 3b (B), and area 1 (C) at postlesion week 4 (Pre-post4W) and week 8 (Pre-post8W). The horizontal lines in the box indicate the mean, whereas the top and bottom lines indicate the 75th and 25th percentiles of the value distribution. Error bars indicate the maximum and minimum values. D–F, Boxcar summary plots of interdigit distances of all digit activation centers at prelesion (Pre) and postlesion (Post4W and Post8W) conditions in S2 (D), area 3b (E), and area 1 (F). G–I, Mean activation sizes of single digit at prelesion and postlesion time points in S2 (G), area 3b (H), and area 1 (I). *p < 0.05, **p < 0.01, ***p < 0.001, ****p < 0.0001 (one-way ANOVA with Tukey's post-test).

Dynamic changes of BOLD signals amplitude in S2, area 3b, and area 1 after dorsal column lesion. A–C, Mean tactile stimulation-evoked BOLD time courses obtained before lesion (prelesion, blue curves) and after lesion (Post4W and Post8W, green and red curves) time points in area 3b (A), area 1 (B), and S2 (C). Error bars represent the SEM. D–F, Two-gamma fittings (solid lines) of the mean BOLD time courses (dotted lines). G–I, Group means (mean ± SEM) of three parameters derived from the following fittings: peak (G), area under the curve (H), and time to peak (I). Different columns represent the parameters for prelesion (black), 4 week postlesion (gray), and 8 weeks postlesion (white) conditions. *p < 0.05, **p < 0.01, ***p < 0.001, ****p < 0.0001 (Kruskal–Wallis one-way ANOVA with Dunn's post-test).

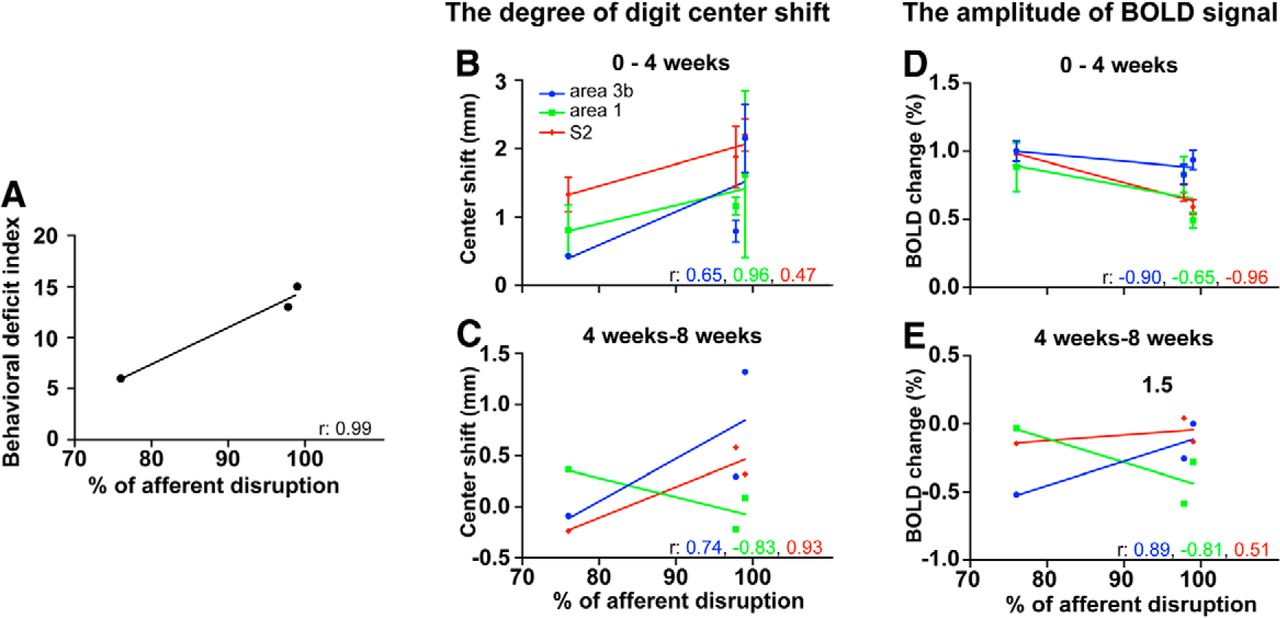
Cross-subject correlations among the behavioral deficits, the extent of afferent disruption, the degree of digit center shift, and the amplitude of BOLD signal during postlesion periods of 0–4 and 4–8 weeks in area 3b, area 1, and S2. A, Strong correlation (r = 0.99) between the extent of afferent disruption and the degree of behavioral deficit. B, C, Correlations between the extent of afferent disruption and the degree of intradigit center shifts during early (postlesion weeks 0–4; B) and late (postlesion weeks 4–8; C) periods after lesion in area 3b (blue lines), area 1 (green lines), and S2 (red lines). The corresponding color-coded number in each graph indicates the strength of the correlation (r value) for each fit (color lines). D, E, Correlations between the extent of afferent disruption and the BOLD signal amplitudes.

Schematic summary of dynamic functional reorganization of digit representations in area 3b, area 1, and S2 following dorsal column section. We summarized reorganization from both spatial and signal amplitude perspectives. Different color patches indicate the locations and relative sizes of fMRI activations to tactile stimulation of distal finger pads prelesion (left column), 4 weeks postlesion (left middle column), and 8 weeks postlesion (right middle column). The darkness of the color for each patch indicates the magnitude of the signal strength, prelesion > 4 weeks postlesion > 8 weeks postlesion. Red dots indicate the centers of prelesion digit activation centers. Dotted black lines indicate the centerline of digit activations before lesion. Solid black arrows represent the trends of activation shifts of each digit, while the dotted black arrow lines represent the trend of activation center shifts between digits. Orange patches (right column) show the digit representation regions identified with neuronal firing properties. Black dots indicate the microelectrode penetration sites. The heights of the arches indicate the amplitudes of the fMRI responses (see “A” in prelesion column).
Stable digit fMRI activation maps and BOLD signal changes in areas 3b and 1, and S2 in normal animals
We first examined the stability of BOLD activation maps in normal animals by comparing measures obtained across different days (1 month apart) from the same animal. Figure 2 shows that D4 tactile stimulation-evoked fMRI activation at the same locations in areas 3b and 1 (Fig. 2A, two left images), and S2 (Fig. 2A, two right images) on 2 imaging days (Fig. 2A, day 1, top two panels; day 2, bottom two panels). The temporal (2 weeks apart) shifts of D4 digit activation centers in areas 3b and 1, and S2 were 0.35, 0.40, and 0.38 mm, respectively. These results are consistent with our previous report of shifts across days for area 3b (Zhang et al., 2007). The sizes of the activations also were quite stable (thresholded at p = 0.0001). Single-trial BOLD time courses extracted from S2 activation voxels showed robust stimulus-related changes (Fig. 2B). Peak BOLD signal changes remained stable across days (Fig. 2C, black and gray columns) and across areas (Fig. 2C, left, middle, and right columns), regardless of digits (D4 alone vs D1–D4; Fig. 2C, compare bottom, top).
Spatial shifts of single-digit BOLD activations in areas 3b and 1, and S2 after dorsal column lesion
In strong contrast to the stable digit activations in normal animals, we observed dynamic shifts of activation centers in areas 3b and 1, and S2 several weeks after dorsal column lesion in all animals. Figure 3 shows data from one representative lesion monkey (SM-D), in which 76% of dorsal column afferents were disrupted (Qi et al., 2011; Chen et al., 2012). In areas 3b and 1, D1 activations showed a posterior shift at 4 and 8 weeks postlesion (Fig. 3, compare A, B, C, yellow-orange patches). Directions of activation shifts are best visualized on the overlaid composite map of fMRI activation and electrophysiology (Fig. 3K). In Figure 3K, prelesion D1 activations are shown as blue patches in areas 3b (left field of view) and 1 (right field of view), and the centers of activation are indicated by the white-blue dots. At 4 weeks postlesion, D1 activations in areas 3b and 1 (green outlines) showed a posterior shift with the area 3b activation moved toward the area 3b–area 1 border (compare green and red outlines and dots with blue patches and dots). At 8 weeks postlesion, D1 activation centers (red outlines and dots) appeared to shift back toward prelesion locations (Fig. 3K, compare red dots, blue dots). All these fMRI activation size and location changes occurred in the somatotopically appropriate D1 representation regions in areas 3b and 1, as indicated by light gray patches in Figure 3K. Corresponding D1 representations, as determined by dense microelectrode mapping at 9 weeks postlesion (over 120 penetration sites; Fig. 3J, black dots and crosses), are indicated by light blue patches. The dynamic spatial postlesion reorganization of digit representations in area 3b was reported previously (Chen et al., 2012). Here, we focused on comparisons across areas.
We also observed dynamic activation changes in S2 after dorsal column lesions (Fig. 3D–F). For quantification and comparison, BOLD fMRI activations of S2 (Fig. 3D–F) were projected onto the top slice (Fig. 3G–I). Before the lesion, D1 activations occurred in three patches (magenta color patches in Fig. 3K). At 4 weeks postlesion, activations broke down into small clusters and showed a posterior shift (brown outlines). At week 8, one activation cluster shifted back to the prelesion location, while another cluster remained at its week 4 postlesion location. These S2 fMRI activations occurred at somatotopically appropriate regions, which were deeper (∼3500 μm below the surface) and appeared to be lateral to the hand-face border region on the brain surface (Fig. 3J,K, dotted gray lines running horizontally). The limited number of electrode penetrations that targeted this region identified neurons responding to stimulation of the arm (Fig. 3J,K, yellow patch) and hand (Fig. 3J,K, green patch) at 9 weeks after lesion. Because of the limited number of penetrations placed in the S2 region in this animal, the green-yellow patches represent only the areas mapped in cortex. This does not exclude the possibility of a larger hand representation extending into the surrounding cortical region.
Dynamic spatial reorganization of S2 activations after dorsal column lesions in other animals
The S2 reorganizations described above also occurred in the other two lesioned monkeys. To simplify the comparison, we overlapped activation maps at prelesion and 4 and 8 weeks postlesion in each monkey for all digits and for individual digits (Fig. 4). Careful examination of these maps revealed several unique features. First, in normal prelesion conditions, single-digit activations in S2 were relatively focal (∼1.5 mm in diameter), but were overlapping and showed no clear digit somatotopy. Second, in postlesion conditions, S2 activations often exhibited multiple foci (Fig. 4D, D1 activations) with irregular shapes, and small and variable sizes (Fig. 4C, for monkey SM-O). For example, before lesion, tactile stimulation of individual distal finger pads of D1–D4 evoked robust and mainly overlapping activations in S2 in monkeys SM-D and SM-O (Fig. 4A, D1, blue outlines; D2, light blue outlines; D3, purple outlines; D4, yellow outlines). After the lesion, however, the digit activation, when detected, showed multiple foci (Fig. 4B,C, blue outlines, monkey SM-D). Third, while most of the S2 fMRI activations were located in the somatotopically appropriate S2 region, the total cortical territories occupied by those S2 activations (Fig. 4, color outlines) were much larger than reported previously in S2 of New World monkeys (Coq et al., 2004). Finally, in contrast to the generally weakened neural activity in areas 3b and 1, S2 neurons responded strongly to stimuli. Because we only identified one hand-arm representation area without a complete body surface map, we could not determine its subregion (e.g., S2, PV, or VS) or whether other S2 areas exhibited similar levels of responsiveness to stimuli. It is possible that the multiple activation foci originated from activations of different areas within the S2 region.
Comparison of spatial shifts of activations in areas 3b and 1, and S2 after dorsal column lesions
The pattern of spatial reorganization observed in different areas in individual animals was also apparent when data were analyzed at the group level. Using prelesion single-digit activations as baseline locations, we measured the following in areas 3b and 1, and S2: (1) the intradigit distances between activation centers to reflect the degree of center shifts for each digit; (2) the interdigit distances to reflect the degree of cortical expansion or contraction of digit representation; and (3) the sizes of activations before and after lesion.
Shifts in the centers of activation for digits
Regardless of the specific digit, the extent of S2 activation center shifts at 4 and 8 weeks postlesion (1.86 ± 0.19 and 1.50 ± 0.12 mm, respectively) was similar to that observed in normal animals (1.78 ± 0.14 mm; Fig. 5A). In contrast, the digit activation center shift in area 3b at 4 weeks postlesion (1.17 ± 0.19 mm) was significantly larger than that in normal animals (0.50 ± 0.12 mm), as we previously reported (Chen et al., 2012). Similarly, shifts in area 1 at 4 and 8 weeks postlesion (1.16 ± 0.14 and 1.27 ± 0.13 mm, respectively) were significantly larger than in normal animals (0.76 ± 0.06 mm; Fig. 5C). Shifts at 4 and 8 weeks did not differ. In summary, significant intradigit activation shifts in digit activation centers occurred after dorsal column lesions in areas 3b and 1, but not in S2.
Interdigit activation shifts
To determine whether the digit representation territory expanded after the lesion, we quantified interdigit (pairwise) distances among activation centers of all four digits for all three areas at prelesion and 4 and 8 weeks postlesion (Fig. 5D–F). Interestingly, we only observed significantly increased interdigit distances in S2 (Fig. 5D), but not in areas 3b (Fig. 5E) or 1 (Fig. 5F). At 4 weeks postlesion, the mean (±SD) interdigit distance for S2 (1.88 ± 0.28 mm) was significantly larger than that at prelesion (1.02 ± 0.11 mm) or 8 weeks postlesion (0.99 ± 0.07 mm; Fig. 5D), when it returned to prelesion levels. Although a similar (Lecoeur et al., 2011) trend was observed in area 3b (Fig. 5E), the increase at 4 weeks postlesion was not statistically significant. In area 1, the interdigit distance appeared to be decreased at both 4 and 8 weeks postlesion, but this was not statistically significant (Fig. 5F). In summary, the spatial distribution of all digit activations in S2 was expanded at 4 weeks postlesion and then contracted to prelesion levels at 8 weeks postlesion.
Size of activation
We also compared the mean size of single-digit activation before and after lesion in all three areas (Fig. 5G–I). Before the lesion, the order of activation size from smallest to largest was area 3b, area 1, and S2 [(mean ± SD) 1.07 ± 0.18, 1.36 ± 0.31, and 2.06 ± 0.35 mm2, respectively]. The ∼1 mm size of the single-digit activation in area 3b was consistent with previous measures by fMRI and intrinsic optical-imaging methods (Chen et al., 2003, 2005, 2007). After the lesion, the activation size change over the 8 week period varied across areas. While activation sizes in area 1 and S2 decreased (Fig. 5G,I), the size in area 3b increased (Fig. 5H). For both area 3b and S2, postlesion activation sizes varied dramatically, as evidenced by large SDs. Possibly due to these large variations, changes in activation size after the lesion were not statistically significant in all three areas. Alternatively, there may have been large variability, but, statistically, there were no changes in activation size. Future studies with large sample size are needed to address these different possibilities.
Reduced BOLD signal amplitudes in areas 3b and 1, and S2 after dorsal column lesions
We next examined how lesion-induced deafferentations affected cortical responsiveness by measuring BOLD signal amplitudes across cortical areas. Figure 6A–F shows the mean stimulation-evoked BOLD time courses obtained before and after lesion in both raw and fitted formats. Regardless of the specific area, the BOLD signal amplitudes, which peaked at 0.8–1% in normal cortex (blue curves), were significantly reduced after lesion [Fig. 6A–C, green and red curves, raw time courses, D–F, fitted time courses]. From 4 to 8 weeks postlesion, BOLD signal amplitudes recovered slightly in all three areas (Fig. 6A–F, compare red curves, green curves), but remained smaller than normal responses (blue curves).
Three parameters, which were derived from two-gamma fitting, were used to quantify the following lesion-induced BOLD time course changes: peak, area under the curve, and time to peak (Fig. 6G–I). The reductions in the peak percentage BOLD signal amplitude at both 4 and 8 weeks postlesion, and the recoveries from 4 to 8 weeks postlesion were significant for all three areas (3b, 1, and S2; Fig. 6G). Specifically, in area 3b (Fig. 6G, left column groups), the peak BOLD signal amplitude declined from 1.42 ± 0.06% prelesion (black columns) to 0.87 ± 0.05% at 4 weeks postlesion (gray columns; p < 0.0001, Kruskal–Wallis one-way ANOVA with Dunn's post-test), and then recovered slightly to 1.04 ± 0.04% at 8 weeks postlesion (white columns, p < 0.01). Similar changes occurred in area 1 and S2. In area 1 (Fig. 6G, middle column groups), the prelesion BOLD amplitude was 1.36 ± 0.08%, which decreased to 0.68 ± 0.05% at 4 weeks postlesion (p < 0.0001), that then recovered to 0.84 ± 0.05% at 8 weeks postlesion (p < 0.05). In S2 (Fig. 6G, right column groups), the prelesion BOLD signal amplitude was 1.27 ± 0.06%, which reduced to 0.67 ± 0.03% at 4 weeks postlesion (p < 0.0001), which then recovered to 0.87 ± 0.05% at 8 weeks postlesion (p < 0.001).
Measures of area under the curve (Fig. 6H) showed similar lesion-induced changes, which were characterized by significant reductions at 4 and 8 weeks postlesion (Kruskal–Wallis one-way ANOVA with Dunn's post-test; Fig. 6H). Recovery at 8 weeks postlesion, however, was not statistically significant in all areas. Measures of time to peak did not change after lesions (Fig. 6I). In summary, we observed similar postlesion patterns of reduction and recovery on peak measures of BOLD time courses across areas 3b and 1, and S2. Furthermore, the degree of change was similar across areas.
Decreased detection of fMRI activation after lesion
Finally, to understand the effects of the lesion on detection of the fMRI signal, we quantified detection rates of single-digit fMRI activations in normal and lesion conditions for each area (Table 1). In the present study, we collected a total of 38 runs of single-digit tactile stimulation in normal cortex before a lesion, 48 runs at 4 weeks postlesion (postlesion 1) and 44 runs at 8 weeks postlesion (postlesion 2). Using the same determination criteria for activation detection (BOLD signal change of p < 0.0001 and a cluster of at least five voxels), activation to single-digit stimulation in normal cortex was detected in 31 of 38 runs (81.5%) in area 3b, 26 of 38 runs (68.4%) in area 1, and 28 of 38 runs (73.6%) in S2 (Table 1). The percentage of activated runs was calculated (activated/total runs × 100%) as the “activation detection rate” to compare across areas over time after the lesion (see Table 1). Compared with normal cortex, at 4 weeks postlesion, activation detection rates dropped significantly (p < 0.0001) across all three areas (37.5% for area 3b, 18.7% for area 1, and 33.3% for S2), but rates did not differ across areas (χ2 test, p = 0.108). At 8 weeks postlesion, regardless of the specific area, detection rates recovered slightly from 4 weeks to 50% in area 3b, 36.3% in area 1, and 40.9% in S2, but remained significantly lower than in normal cortex (χ2 test, p < 0.0001). The largest difference in prelesion versus postlesion detection rate was observed in area 1 (41.3%), and the smallest was in S2 (36.7%). Our data indicate that the ability to detect BOLD signal changes to single-digit stimulation after lesion was significantly reduced by an average of 38.7% across all three areas. Once detected, the BOLD response magnitudes to the same digit stimuli were also significantly weaker after a lesion, as shown in Figure 6. Detection rate of fMRI activation can be used as an additional measure to indicate recovery at 8 weeks from 4 weeks postlesion, but it is a different measure compared with other plasticity measures, such as the percentage BOLD signal change.
Relationship of degree of afferent disruption with extent of behavioral deficit and cortical reorganization
We plotted the relationship between the degree of afferent disruption and (1) the severity of the behavioral deficit (Fig. 7A); (2) the extent of cortical reorganization, as indexed by intradigit activation shifts (Fig. 7B,C); and (3) BOLD signal amplitudes (Fig. 7D,E). The behavioral deficit index (see Materials and Methods for task and quantification) showed a strong correlation of 0.99 with the percentage of afferent disruption across animals (76% for monkey SM-D, 97.8% for monkey SM-C, and 99% for monkey SM-O; Fig. 7A). Relationships between afferent disruption and cortical plasticity (spatial shifts and BOLD amplitude change) varied during the early versus late recovery periods and across areas. During the early recovery period (0–4 weeks after lesion), intradigit activation shifts in all three areas correlated strongly with the percentage of afferent disruption (Fig. 7B; r = 0.65 for area 3b; r = 0.96 for area 1; and r = 0.47 for S2), indicating that greater afferent disruptions were associated with larger activation shifts. During the late recovery period (4–8 weeks after lesion), similar correlations remained for area 3b (blue line, r = 0.74) and S2 (red line, r = 0.93), but not for area 1 (Fig. 7C). In area 1, we observed a reverse correlation between the extent of activation center shifts and the percentage of afferent disruption (Fig. 7C, green lines; r = −0.83), indicating that greater afferent disruptions were associated with less cortical reorganization.
Similarly, the relationship between BOLD signal amplitude and the extent of afferent disruption varied in early versus late recovery phases and across areas. During the early phase of recovery (0–4 weeks after lesion), greater afferent disruption was associated with larger reductions in BOLD signal amplitude (∼1% signal amplitude difference) for area 1 and S2 (Fig. 7D, red and green dots and lines). For area 3b, the extent of afferent disruption had little effect on BOLD single amplitude (Fig. 7D, blue dot and line). During the late phase of recovery (4–8 weeks postlesion), BOLD signal amplitude changes were ∼0.5% across animals. Greater afferent disruption was associated with larger BOLD amplitude increases for area 3b and larger amplitude decreases for area 1 (Fig. 7E). For S2, the extent of afferent disruption had little effect on BOLD signal amplitude.
In summary, three main findings were derived from the correlation analysis across animals. First, the behavioral deficit correlated with the degree of afferent disruption. Second, during the early postlesion period (first 4 weeks), the severity of the afferent disruption correlated with cortical reorganizations in areas 3b and 1, and S2, and large reductions in BOLD signal amplitudes in area 1 and S2, but not area 3b. During the later postlesion period (4–8 weeks postlesion), the severity of afferent disruption remained correlated with cortical reorganization in area 3b and S2, but was inversely correlated in area 1. The severity of afferent disruption correlated with a greater BOLD signal recovery for area 3b and a greater signal reduction for area 1, but no change for S2. Third, these observations indicate that early-phase cortical reorganization in areas 3 and 1, and S2 are the most robust indicators for the severity of afferent deprivation. Late-phase cortical reorganizations in areas 3b and 1, and S2 had different relationships with the severity of afferent disruption, suggesting that different cortical areas are engaged at different times in mediating functional and behavioral recovery after deafferentation.
Schematic summary model
Extending previous observations from area 3b, here we report that dynamic cortical reorganization also occurred in two high-order somatosensory areas (area 1 and S2) within the 8 weeks after partial dorsal column lesion. Lesion-induced cortical reorganization in areas 3b and 1 are characterized spatially by an early shift and a later shift back, whereas reorganization in S2 is characterized by an early expansion and a later retraction. BOLD signal amplitudes were reduced significantly across all areas at 4 weeks postlesion, but recovered by ∼50% at 8 weeks postlesion. These changes are represented in Figure 8, an updated version of the cortical reorganization model (for the original model, see Chen et al., 2012). Black arrows indicate the directionality of digit activation shifts, and cortical response amplitude is indicated by the color intensity of patches (lighter color represents a weaker response) and the height of the arch (Fig. 8). The only noticeable inter-areal difference appeared to be the inverse correlation between the degree of afferent disruption and the extents of activation center shifts and the percentage BOLD signal amplitude in area 1 versus area 3b/S2 at 4–8 weeks postlesion (Fig. 7). Dynamic changes within the first 4 weeks appeared to be consistent across areas. This observation is not reflected in the model.
Discussion
Parallel plastic changes in areas 3b and 1, and S2 weeks after lesion
This study provides the first evidence for parallel plastic changes in areas 3b and 1, and S2 weeks after partial dorsal column lesions. These plastic changes, however, appeared to be quite similar across areas. Specifically, as the lesion disrupted predominant thalamocortical driving inputs, areas 3b and 1, and S2 showed similar changes in digit somatotopy, representation size, and cortical response magnitude. First, spatially, the digit somatotopy underwent a dynamic reorganization, which was characterized by initial scattered and expanded responses at 4 weeks postlesion, then contracted responses at 8 weeks postlesion in all three areas. These changes were evidenced by initial increases in interdigit and intradigit distances at 4 weeks and then decreases at 8 weeks. The most robust reorganization was observed in area 3b, a finding we attribute to its large cortical territory and fine-scale functional organization of digit representation. Similarly, we believe that because the digit representation territory in are S2 is small and less somatotopically organized, interdigit distance has greater sensitivity to detect spatial reorganization occurring in S2. The observations of cortical reactivation and reorganization in area 3b (S1 in rodents) are consistent with those in previous reports (Kaas et al., 1983, 2008; Manger et al., 1996; Florence et al., 1998; Darian-Smith and Brown, 2000; Jones, 2000b; Graziano and Jones, 2009).
Second, contrary to the activation size increases in area 3b after deafferentation, the overall cortical territories of digit representations in area 1 and S2 were markedly reduced. This difference in activation size change may indicate that plasticity occurred independently in area 3b and in higher-order areas 1 and S2. Being different from area 3, area 1 is considered to be a higher-order somatosensory area. The most conclusive supporting evidence comes from the observation that ablations of areas 3a and 3b abolish cutaneous responsivity in area 1 (Garraghty et al., 1990), but not vice versa. Additional evidence includes the anatomical connections between areas 3b and 1 (Liao et al., 2013); complex receptive fields of neurons in area 1 (Iwamura et al., 1983, 1993, Iwamura, 1998); more overlapping fields that are responsive to stimuli in area 1 than in area 3b cortex in both humans and monkeys (Chen et al., 2005, Stringer et al., 2014); and differential patterns of inter-areal intrinsic connections between areas 3b and 1 (Négyessy et al., 2013; Ashaber et al., 2014). All these features support the idea that area 1 plays a more integrative role than area 3b. Technically, because detection rates of fMRI activation did not differ across areas, we do not believe that the BOLD signal variation contributed to the reduced activation sizes.
Third, the cortical response magnitudes, as quantified by the amplitude of BOLD signal changes, were significantly reduced in all three areas compared with prelesion response amplitudes. Of even greater interest, the dynamic patterns were remarkably similar across all three areas. This finding is significant because area 1 and S2 have been regarded as higher-order cortical areas that receive feedforward inputs from area 3b. This observation suggests that responsiveness changes in area 1 and S2 are merely reflections of changes in area 3b, at least in the processing of 8 Hz vibrotactile inputs. Our previous observations of significantly reduced spiking activities in both area 3b and S2 (Wang et al., 2013) support the finding of decreased BOLD signal amplitude at 8 weeks postlesion. One puzzling observation, however, is the slight, nonsignificant weakening of neuronal local field potential activity, despite significantly reduced BOLD signal amplitude. We speculate that our spiking activity-based sampling strategy, in which only strongly reactivated regions were recorded, may have contributed to this discrepancy (Wang et al., 2013). Additionally, the known contribution of subthreshold activity to BOLD signals may also play a role. These specific factors warrant further investigation by direct comparison of these measures in comparable settings. Due to the limited behavioral data collected from these animals, the behavioral relevance of these plastic changes remains to be determined in future experiments with more detailed and careful behavioral assessment (Darian-Smith and Ciferri, 2005).
Relationships among severity of spinal cord lesion, extent of cortical plastic reorganization, and recovery of behavior
From a clinical point of view, it is important to understand the driving forces for cortical plasticity, and which plasticity measures have prognostic value for predicating behavioral and functional outcomes after damage to the CNS, including the spinal cord (Stinear, 2010; Li et al., 2013). By conducting an analysis across animals of three measures of lesion severity extent of cortical plasticity, and degree and duration of behavioral deficit (Fig. 7), we have identified positive correlations among these measures. Our findings indicate that the extent of plasticity changes in the early somatosensory areas (areas 3b and 1, and S2) are related to the degree of deafferentation and the severity of behavioral deficits in simple hand use after spinal cord lesion. Due to the small number of animals and the limitations of correlation analysis, these data only suggest a general relationship. A future study with a larger sample size will generate more quantitative predictive measures for behavioral outcomes. Nevertheless, the quite robust and consistent findings obtained from these three lesioned animals indicate the potential of this approach and the power of longitudinal high-resolution fMRI.
Weaker and scattered BOLD responses after deafferentation: implication for quantifying BOLD response in similar pathological conditions in humans
fMRI measures have been routinely used to probe brain plasticity in various pathological conditions in human patients. Our observations of weakened and more diffuse fMRI responses in the primate spinal cord lesion model have general implications for the design of fMRI experiments and for the interpretation of negative findings in human patients with similar pathology, such as deafferentation. For example, the significantly reduced fMRI activation detection rate and signal amplitude indicate that signals in deafferented cortex are ∼50% of those of normal cortex, making them more difficult to detect. This condition should be taken into account when power and sample size are calculated for studies investigating differences between patients and normal control subjects. The similar temporal features of BOLD signal changes observed in both normal and deafferented cortex, however, suggest that the same HRF model might be effective in detecting BOLD signal changes, at least for block design experiments. In summary, our data showed that deafferentation alters several aspects of cortical processing. This compromises fMRI signal changes, suggesting more cautious interpretation when no stimulus-related fMRI activations are detected in cortical areas where deafferentation is suspected, such as in chronic central pain conditions.
Conclusions
By taking advantage of high-resolution and high BOLD signal-to-noise ratio in a strong field (9.4 T), we observed dynamic cortical plastic changes in spatial organization and response magnitude in all three somatosensory areas (areas 3b and 1, and S2) within 8 weeks after dorsal column lesion. These plastic changes were characterized by shifted, scattered, and weakened BOLD responses at 4 weeks postlesion, and then a return and recovery of BOLD responses toward the prelesion state at 8 weeks postlesion. At this time point, however, BOLD responses were not normal across all measures. The extent of cortical plasticity was positively correlated with the severity of the lesion, and the degree and duration of behavioral deficits in a food retrieval task. Across areas, the most robust differences between areas were observed on reductions of activation size and altered activation centers and signal amplitudes during the recovery period from 4 to 8 weeks postlesion. In conclusion, the fMRI results reveal dynamic changes in the cortical activation pattern in multiple cortical areas during cortical recoveries that were previously unknown, and correlate with behavioral recovery. Potentially, similar fMRI scans in humans can be used to predict levels of behavioral recovery.
Footnotes
This study is supported by a Dana Foundation grant, and by National Institutes of Health Grants R01 NS069909 to L.M.C., RO1 NS067017 to H.X.Q., and RO1 NS16446 to J.H.K. We thank Dr. Feng Wang for her assistance on the optimization and some collections of the fMRI data. We also thank Chaohui Tang for her assistance on histology, fMRI, and electrophysiology experiments.
- Correspondence should be addressed to Dr. Li Min Chen, Assistant Professor, Department of Radiology and Radiological Sciences, Institute of Imaging Science, Vanderbilt University Medical Center, 1161 21st Avenue South, 1105 MCN, Nashville, TN 37233. limin.chen{at}vanderbilt.edu


