Frontal cortex selects representations of the talker’s mouth to aid in speech perception
- Baylor College of Medicine, United States
- Michael E. DeBakey Veterans Affairs Medical Center, United States
Abstract
Human faces contain multiple sources of information. During speech perception, visual information from the talker’s mouth is integrated with auditory information from the talker's voice. By directly recording neural responses from small populations of neurons in patients implanted with subdural electrodes, we found enhanced visual cortex responses to speech when auditory speech was absent (rendering visual speech especially relevant). Receptive field mapping demonstrated that this enhancement was specific to regions of the visual cortex with retinotopic representations of the mouth of the talker. Connectivity between frontal cortex and other brain regions was measured with trial-by-trial power correlations. Strong connectivity was observed between frontal cortex and mouth regions of visual cortex; connectivity was weaker between frontal cortex and non-mouth regions of visual cortex or auditory cortex. These results suggest that top-down selection of visual information from the talker’s mouth by frontal cortex plays an important role in audiovisual speech perception.
https://doi.org/10.7554/eLife.30387.001Introduction
Speech perception is multisensory: humans combine visual information from the talker’s face with auditory information from the talker’s voice to aid in perception. The contribution of visual information to speech perception is influenced by two factors. First, if the auditory information is noisy or absent, visual speech is more important than if the auditory speech is clear. Current models of speech perception assume that top-down processes serve to incorporate this factor into multisensory speech perception. For instance, visual cortex shows enhanced responses to audiovisual speech containing a noisy or entirely absent auditory component (Schepers et al., 2015) raising an obvious question: since visual cortex presumably cannot assess the quality of auditory speech on its own, what is the origin of the top-down modulation that enhances visual speech processing ? Neuroimaging studies have shown that speech reading (perception of visual-only speech) leads to strong responses in frontal regions including the inferior frontal gyrus, premotor cortex, frontal eye fields and dorsolateral prefrontal cortex (Callan et al., 2014; Calvert and Campbell, 2003; Hall et al., 2005; Lee and Noppeney, 2011; Okada and Hickok, 2009). We predicted that these frontal regions serve as the source of a control signal, which enhances activity in visual cortex when auditory speech is noisy or absent.
Second, visual information about the content of speech is not distributed equally throughout the visual field. Some regions of the talker’s face are more informative about speech content, with the mouth of the talker carrying the most information (Vatikiotis-Bateson et al., 1998; Yi et al., 2013). If frontal cortex enhances visual responses during audiovisual speech perception, one should expect this enhancement to occur preferentially in regions of visual cortex which represent the mouth of the talker’s face.
Results
Responses to three types of speech—audiovisual (AV), visual-only (Vis) and auditory-only (Aud) (Figure 1A) —were measured in 73 electrodes implanted over visual cortex (Figure 1B). Neural activity was assessed using the broadband response amplitude (Crone et al., 2001; Canolty et al., 2007; Flinker et al., 2015; Mesgarani et al., 2014). The response to AV and Vis was identical early in the trial, rising quickly after stimulus onset and peaking at about 160% of baseline (Figure 1C); there was no response to Aud speech. The talker’s mouth began moving at 200 ms after stimulus onset, with the onset of auditory speech in the AV condition occurring at 283 ms. Shortly thereafter (at 400 ms) the responses to AV and Vis diverged, with significantly greater responses to Vis than AV. Examining individual electrodes revealed large variability in the amount of Vis enhancement, ranging from −16 to 78% (Figure 1D).
Figure 1
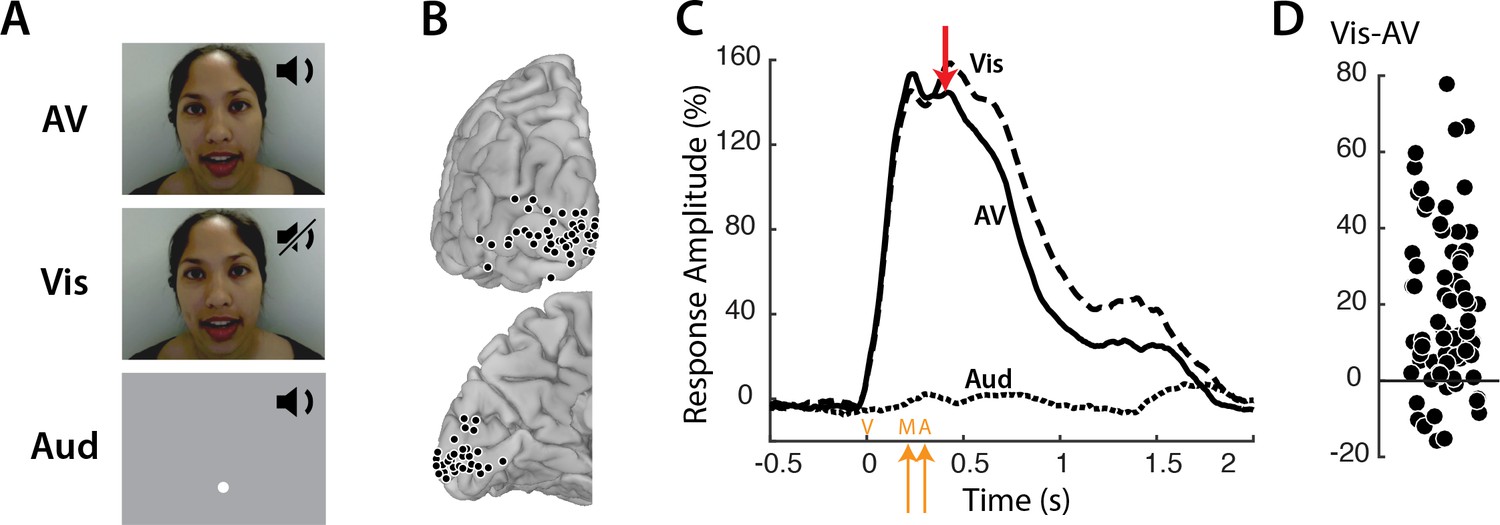
Visual cortex responses to speech.
(A) The speech stimuli consisted of audiovisual recordings of a female talker speaking words (AV) edited so that only the visual portion of the recording was presented (Vis) or only the auditory portion of the recording was presented (Aud). Subjects were instructed to fixate the talker’s mouth (AV and Vis conditions) or a fixation point presented at the same screen location as the talker’s mouth (Aud condition). (B) In eight subjects, a total of 73 responsive occipital electrodes were identified. Electrode locations (black circles) are shown on a posterior view (top) and a medial view (bottom) of the left hemisphere of a template brain. (C) Broadband responses (70–150 Hz) to AV (solid line), Vis (dashed line) and Aud (dotted line) speech averaged across electrodes. The red arrow indicates the first time point (400 ms) at which the response to Vis speech was significantly greater than the response to AV speech. On the x-axis, time zero corresponds to the onset of the video (V) followed by the onset of the talker’s mouth movements (M) at 200 ms and onset of auditory speech (A) at 283 ms (orange arrows). (D) The broadband response enhancement (Vis – AV) measured from 200 to 1500 ms. One symbol per electrode (symbols jittered along x-axis for improved visibility).
Enhanced visual cortex responses to Vis speech may reflect the increased importance of visual speech for comprehension when auditory speech is not available. However, visual speech information is not evenly distributed across the face: the mouth of the talker contains most of the information about speech content. We predicted that mouth representations in visual cortex should show greater enhancement than non-mouth representations. To test this prediction, we measured the receptive field of the neurons underlying each electrode by presenting small checkerboards at different visual field locations and determining the location with the maximum evoked response (Figure 2A). As expected, electrodes located near the occipital pole had receptive fields near the center of the visual field, while electrodes located more anteriorly along the calcarine sulcus had receptive fields in the visual periphery (Figure 2B). In the speech stimulus, the mouth subtended approximately 5 degrees of visual angle. Electrodes with receptive fields of less than five degrees eccentricity were assumed to carry information about the mouth region of the talker’s face and were classified as ‘mouth electrodes’ (N = 49). Electrodes with more peripheral receptive fields were classified as ‘non-mouth electrodes’ (N = 24). We compared the response in each group of electrodes using a linear mixed-effects (LME) model with the response amplitude as the dependent measure; the electrode type (mouth or non-mouth) and stimulus condition (AV, Vis or Aud) as fixed factors; electrode as a random factor; and the response in mouth electrodes to AV speech as the baseline (see Table 1 for all LME results).
Figure 2

Retinotopic organization of speech responses in the visual cortex.
(A) Medial view of a cortical surface model of the left hemisphere brain of a single subject (anonymized subject ID YAI). Posterior electrode e81 (red circle) was located superior to the calcarine sulcus on the occipital pole (red circle) while anterior electrode e65 (blue circle) was located inferior to the calcarine on the medial wall of the hemisphere. The receptive field mapping stimulus consisted of a small checkerboard presented at random screen locations while subjects performed a letter detection task at fixation (not shown). (B) The responses evoked by the mapping stimulus in electrodes e81 (left panel) and e65 (right panel). Color scales corresponds to the amplitude of the visual evoked response at each location in the visual field, with the crosshairs showing the center of the visual field and the red and blue circles showing the center of a two-dimensional Gaussian fitted to the response. Electrode e81 had a central receptive field (eccentricity at RF center of 2.5°) while electrode e65 had a peripheral receptive field (eccentricity 10.9°). (C) The receptive field location for the two sample electrodes, e81 (red circle) and e65 (blue circle) are shown on the speech stimulus. Subjects were instructed to fixate the talker’s mouth and electrodes were classified as representing the mouth region of the talker’s face (red circles; less than 5° from the center of the mouth, white dashed line) or as non-mouth (blue circles;>5°). Electrode locations of mouth (red) and non-mouth (blue) electrodes shown on posterior and medial brain views. Response enhancement (Vis-AV) for each individual electrode; inset bar graph shows mean values (±standard error). (D) In a control speech experiment, a white fixation crosshair was presented on the talker’s shoulder, moving the mouth of the talker’s face to the visual periphery. Electrodes were classified as representing the mouth of the talker (red circles; less than 5° from the the center of the mouth, white dashed line) or non-mouth (blue circles;>5°). Mouth electrodes were in the periphery of the visual field (mean eccentricity of 9.5°). Response enhancement (Vis-AV) for each individual electrode; inset bar graph shows mean values (±standard error).
Table 1
LME for Amplitude in Visual Cortex
https://doi.org/10.7554/eLife.30387.004| Fixed effects: | Estimate | Std. error | DF | t-value | p-value |
|---|---|---|---|---|---|
| Baseline | 98 | 8.7 | 90.5 | 11.2 | 10−16 |
| A Speech | −83 | 5.9 | 134.5 | −14.2 | 10−16 |
| A Speech x Peripheral RF | 47 | 9.7 | 133.5 | 4.9 | 10−6 |
| V Speech | 26 | 5.4 | 132.9 | 4.8 | 10−6 |
| Peripheral RF | −65 | 15.2 | 90.5 | −4.3 | 10−5 |
| V Speech x Peripheral RF | −24 | 9.4 | 132.9 | −2.6 | 0.01 |
The model found a significant main effect of stimulus condition, driven by greater responses to Vis (95% vs. 77%, Vis vs. AV; p=10−6) and weaker responses to Aud (12% vs. 77%, Aud vs. AV; p=10−16). Critically, there was also a significant interaction between stimulus condition and electrode type. Mouth electrodes showed a large difference between the responses to Vis and AV speech while non-mouth electrodes showed almost no difference (26% vs. 2%, mouth vs. non-mouth Vis – AV; p=0.01; Figure 2C).
An alternative interpretation of this results is raised by the task design, in which subjects were instructed to fixate the mouth of the talker. Therefore, the enhancement could be specific to electrodes with receptive fields near the center of gaze (central vs. peripheral) rather than to the mouth of the talker’s face (mouth vs. non-mouth).
To distinguish these two possibilities, we performed a control experiment in which the task instructions were to fixate the shoulder of the talker, rather than the mouth, aided by a fixation crosshair superimposed on the talker’s shoulder (Figure 2D). With this manipulation, the center of the mouth was located at 10 degrees eccentricity. Electrodes with receptive field centers near the mouth were classified as mouth electrodes (N = 19); otherwise, they were classified as non-mouth electrodes (N = 13). This dissociated visual field location from mouth location: mouth electrodes had receptive fields located peripherally (mean eccentricity = 9.5 degrees). If the enhancement during Vis speech was restricted to the center of gaze, we would predict no enhancement for mouth electrodes in this control experiment due to their peripheral receptive fields. Contrary to this prediction, the LME showed a significant interaction between electrode type and stimulus condition (Table 2). Mouth electrodes (all with peripheral receptive fields) showed a large difference between the responses to Vis and AV speech while non-mouth electrodes showed little difference (50% vs. 9%, mouth vs. non-mouth Vis – AV; p=10−3).
Table 2
LME for Amplitude in Visual Cortex (Control Experiment)
https://doi.org/10.7554/eLife.30387.005| Fixed effects: | Estimate | Std. error | DF | t-value | p-value |
|---|---|---|---|---|---|
| Baseline | 357 | 35 | 32.7 | 10.1 | 10−11 |
| V Speech | 50 | 7 | 32 | 6.7 | 10−7 |
| Non-mouth RF | −287 | 55 | 32.7 | -5 | 10−5 |
| V Speech x Non-mouth RF | −41 | 12 | 32 | −3.5 | 10−3 |
Both experiments demonstrated a large enhancement for Vis compared with AV speech in visual cortex electrodes representing the mouth of the talker. However, the visual stimulus in the Vis and AV conditions was identical. Therefore, a control signal sensitive to the absence of auditory speech must trigger the enhanced visual responses. We investigated responses in frontal cortex as a possible source of top-down control signals (Corbetta and Shulman, 2002; Gunduz et al., 2011; Kastner and Ungerleider, 2000; Miller and Buschman, 2013).
Figure 3A shows the responses during Vis speech for a frontal electrode located at the intersection of the precentral gyrus and middle frontal gyrus (Talairach co-ordinates: x = −56, y = −8, z = 33) and a visual electrode located on the occipital pole with a receptive field located in the mouth region of the talker’s face (1.8° eccentricity). Functional connectivity was measured with a Spearman rank correlation of the trial-by-trial response power within each pair. This pair of electrodes showed strong correlation (ρ = 0.57, p=10−6): on trials in which the frontal electrode responded strongly, the visual electrode did as well.
Figure 3
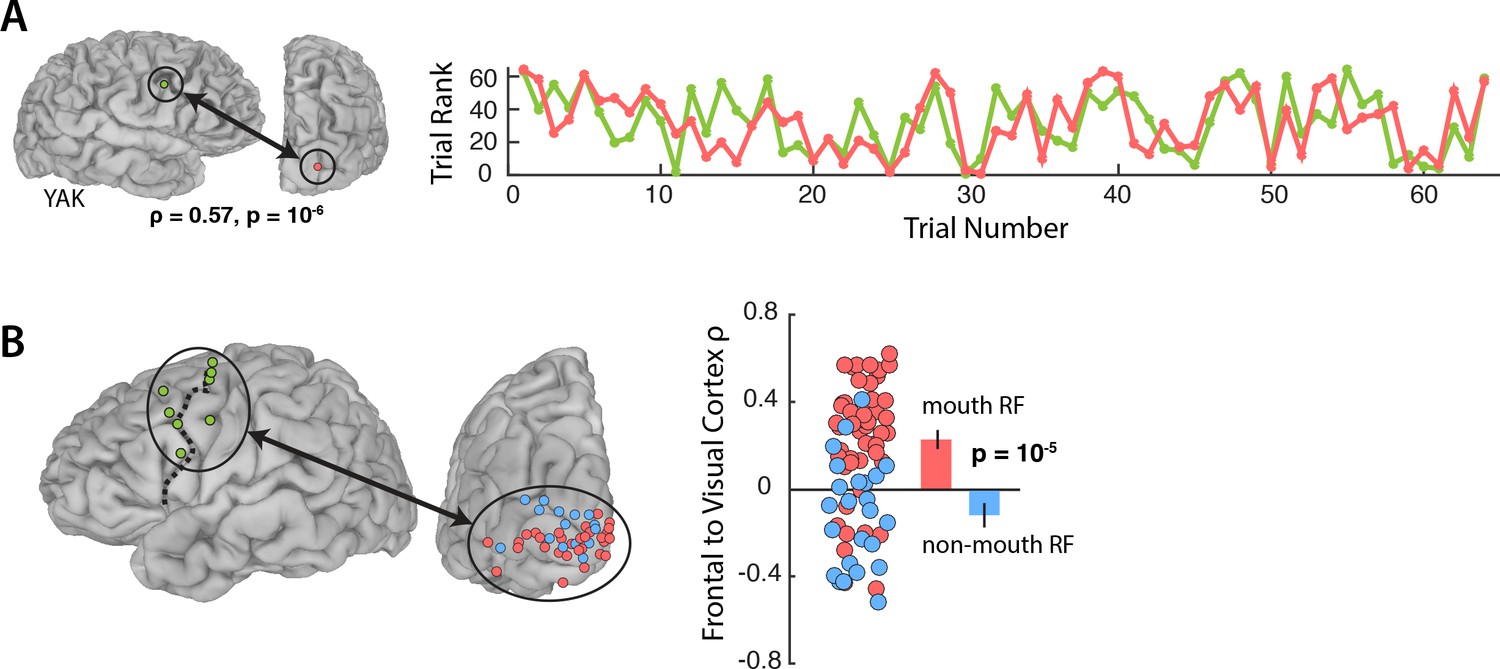
Functional connectivity with the frontal cortex.
(A) Average broadband responses for each Vis speech trial (200–1500 ms, 70–150 Hz) measured simultaneously in a single frontal (green) and a single visual cortex (red) electrode. Trials were ranked based on their response amplitudes (y axis) and shown with respect to their presentation orders (x axis). The Spearman rank correlation between the amplitude time series of the two electrodes was high (ρ = 0.57). (B) Left hemisphere of a template brain showing all frontal (green circles), visual cortex mouth (red) and non-mouth (blue) electrodes. Frontal electrodes were located near the precentral sulcus (dashed line). Plot shows Spearman rank correlation between each frontal-visual electrode pair; inset bar graph shows mean values (±standard error).
We predicted that connectivity should be greater for mouth electrodes than non-mouth electrodes. In each subject, we selected the single frontal electrode with the strongest response to AV speech (Figure 3B; average Talairach co-ordinates of the frontal electrode: x = 49, y = −2, z = 42) and measured the connectivity between the frontal electrode and all visual electrodes in that subject (Figure 3B).
An LME model (Table 3) was fit with the Spearman rank correlation (ρ) between each frontal-visual electrode pair as the dependent measure; the visual electrode type (mouth vs. non-mouth) and stimulus condition (AV, Vis or Aud) as fixed factors; electrode as a random factor; and connectivity of mouth electrodes during AV speech as the baseline. The largest effect in the model was a main effect of electrode type, driven by strong frontal-visual connectivity in mouth electrodes and weak connectivity in non-mouth electrodes (0.2 vs. −0.02; p=10−5). There was significantly weaker frontal-visual connectivity during the Aud condition in which no visual speech was presented (p=0.01).
Table 3
LME for Frontal-Visual Cortex Connectivity
https://doi.org/10.7554/eLife.30387.007| Fixed effects: | Estimate | Std. error | DF | t-value | p-value |
|---|---|---|---|---|---|
| Baseline | 0.23 | 0.03 | 179.1 | 7.4 | 10−12 |
| Peripheral RF | −0.24 | 0.05 | 179.1 | −4.5 | 10−5 |
| A Speech | −0.1 | 0.04 | 141.1 | −2.5 | 0.01 |
| A Speech x Peripheral RF | 0.16 | 0.07 | 136.5 | 2.4 | 0.02 |
| V Speech x Peripheral RF | −0.1 | 0.06 | 134 | −1.6 | 0.1 |
| V Speech | 0.0003 | 0.04 | 134 | −0.007 | 1 |
Our results suggest a model in which frontal cortex modulates mouth regions of visual cortex in a task-specific fashion. Since top-down modulation is an active process that occurs when visual speech is most relevant, this model predicts that frontal cortex should be more active during the perception of Vis speech. To test this prediction, we compared the response to the different speech conditions in frontal cortex (Figure 4A). Frontal electrodes responded strongly to all three speech conditions, with a peak amplitude of 109% at 470 ms after stimulus onset. Following the onset of auditory speech (283 ms after stimulus onset), the responses diverged, with a larger response to Vis than AV or Aud speech (53% vs. 33%, Vis vs. AV; p=0.001; Table 6). Greater responses to Vis speech were consistent across frontal electrodes (Figure 4B).
Figure 4

Frontal cortex responses.
(A) Broadband responses to AV (solid line), Vis (dashed line) and Aud (dotted line) speech averaged across frontal electrodes (locations shown on inset brain). (B) Scatter plot showing average responses (from 200 to 1500 ms) to Vis and AV speech for all frontal electrodes (green circles). Black diagonal line indicates the line of equality. (C) Broadband responses to AV (solid line) and Vis (dashed line) speech in a single frontal (green trace) and visual cortex (red trace) electrode. Dashed black lines depicts the onset of mouth movements and the onset of auditory speech (note expanded scale on x-axis compared with A). Vertical green line indicates the first time point at which the frontal response to Vis speech was enhanced relative to AV speech. Red line indicates the same for visual cortex. Black arrow highlights latency difference. (D) Enhancement latency for all frontal (green circles) and visual (red circles) electrodes. Letter codes along y-axis show different subjects. Vertical green and red lines indicate the average enhancement latency across all frontal and visual electrodes respectively.
Both frontal and visual cortex showed enhanced responses to Vis speech. If frontal cortex was the source of top-down modulation that resulted in visual cortex enhancements, one might expect frontal response differences to precede visual cortex response differences. To test this idea, we examined the time courses of the response to speech in a sample frontal-visual electrode pair (Figure 4C). The increased response to Vis speech occurred earlier in the frontal electrode, beginning at 247 ms after auditory onset versus 457 ms for the visual electrode. To test whether the earlier divergence between Vis and AV speech in frontal compared with visual cortex was consistent across electrodes, for each electrode we calculated the first time point at which the Vis response was significantly larger than the AV response (Figure 4D). 27 out of 29 visual electrodes showed Vis response enhancement after their corresponding frontal electrode, with an average latency difference of 230 ms (frontal vs. visual: 257 ± 150 ms vs. 487 ± 110 ms vs. with respect to auditory speech onset, t34 = 4, p=10−4).
While our primary focus was on frontal modulation of visual cortex, auditory cortex was analyzed for comparison. 44 electrodes located on the superior temporal gyrus responded to AV speech (Figure 5A). As expected, these electrodes showed little response to Vis speech but a strong response to Aud speech, with a maximal response amplitude of 148% at 67 ms after auditory speech onset. While visual cortex showed a greater response to Vis speech than to AV speech, there was no significant difference in the response of auditory cortex to Aud and AV speech, as confirmed by the LME model (p=0.8, Table 4). Next, we analyzed the connectivity between frontal cortex and auditory electrodes. The LME revealed a significant effect of stimulus, driven by weaker connectivity in the Vis condition in which no auditory speech was presented (p=0.02; Table 5). Overall, the connectivity between frontal cortex and auditory cortex was weaker than the connectivity between frontal cortex and visual cortex (0.04 for frontal-auditory vs. 0.23 for frontal-visual mouth electrodes; p=0.001, unpaired t-test).
Figure 5

Auditory cortex responses and connectivity.
(A) Broadband responses to AV (solid line), Vis (dashed line) and Aud (dotted line) speech across auditory electrodes located on the STG (purple circles on inset brain). (B) The broadband response enhancement (Aud – AV) with one symbol per electrode (symbols jittered along x-axis for improved visibility). Electrodes were divided into two groups, those showing a large (>=10%) enhancement (orange circles) and those showing little or no enhancement (yellow circles). (C) Anatomical distribution of STG electrodes by Aud – AV amplitude. (D) Frontal connectivity of STG electrodes by Aud – AV amplitude.
Table 4
LME for Amplitude in Auditory Cortex
https://doi.org/10.7554/eLife.30387.010| Fixed effects: | Estimate | Std. error | DF | t-value | p-value |
|---|---|---|---|---|---|
| Baseline | 41 | 4.9 | 88.3 | 8.4 | 10−12 |
| V Speech | −32 | 5 | 83.2 | −6.4 | 10−8 |
| A Speech | 1 | 5.1 | 84.1 | 0.2 | 0.8 |
Table 5
LME for Frontal-Auditory Cortex Connectivity
https://doi.org/10.7554/eLife.30387.011| Fixed effects: | Estimate | Std. error | DF | t-value | p-value |
|---|---|---|---|---|---|
| Baseline | 0.04 | 0.04 | 83.6 | 1.1 | 0.3 |
| V Speech | −0.1 | 0.04 | 83.6 | −2.3 | 0.02 |
| A Speech | 0.02 | 0.04 | 84.4 | 0.4 | 0.7 |
Table 6
LME for Amplitude in Frontal Cortex
https://doi.org/10.7554/eLife.30387.012| Fixed effects: | Estimate | Std. error | DF | t-value | p-value |
|---|---|---|---|---|---|
| Baseline | 33 | 6.7 | 12.1 | 5 | 10−4 |
| V Speech | 20 | 5.2 | 14.1 | 3.9 | 10−3 |
| A Speech | -7 | 5.8 | 14.4 | −1.1 | 0.3 |
In visual cortex, a subset of electrodes (those representing the mouth) showed a greater response in the Vis-AV contrast and greater connectivity with frontal cortex. To determine if the same was true in auditory cortex, we selected the STG electrodes with the strongest response in the Aud-AV contrast (Figure 5B). Unlike in visual cortex, in which there was anatomical localization of mouth-representing electrodes on the occipital pole, auditory electrodes with the strongest response in the Aud-AV contrast did not show clear anatomical clustering (Figure 5C). Electrodes with the electrodes with the strongest response in the Aud-AV contrast had equivalent connectivity with frontal cortex as other STG electrodes (ρ = −0.04 vs. roh = 0.06, unpaired t-test = 0.9, p=0.3). This was the opposite of the pattern observed in visual cortex. In order to ensure that signal amplitude was not the main determinant of connectivity, we selected the STG electrodes with the highest signal-to-noise ratio in the AV condition. These electrodes had equivalent connectivity with frontal cortex as other STG electrodes (ρ = −0.002 vs. ρ = 0.05, unpaired t-test = 0.4, p=0.7).
Discussion
Taken together, these results support a model in which control regions of lateral frontal cortex located near the precentral sulcus selectively modulate visual cortex, enhancing activity with both spatial selectivity—only mouth regions of the face are enhanced —and context selectivity—enhancement is greater when visual speech is more important due to the absence of auditory speech.
Our results link two distinct strands of research. First, fMRI studies of speech perception frequently observe activity in frontal cortex, especially during perception of a visual-only speech, a task sometimes referred to as speech reading (Callan et al., 2014; Calvert and Campbell, 2003; Hall et al., 2005; Lee and Noppeney, 2011; Okada and Hickok, 2009). However, the precise role of this frontal activity has been difficult to determine given the relatively slow time resolution of fMRI.
Second, it is well known that frontal regions in an around the frontal eye fields in the precentral sulcus modulate visual cortex activity during tasks that require voluntary control of spatial or featural attention (Corbetta and Shulman, 2002; Gregoriou et al., 2012; Gunduz et al., 2011; Kastner and Ungerleider, 2000; Miller and Buschman, 2013; Popov et al., 2017). However, it has not been clear how these attentional networks function during other important cognitive tasks, such as speech perception.
We suggest that frontal-visual attentional control circuits are automatically engaged during speech perception in the service of increasing perceptual accuracy for the processing of this very important class of stimuli. This allows for precise, time-varying control: as the quality of auditory information fluctuates as auditory noise in the environment increases or decreases, frontal cortex can up or down-regulate activity in visual cortex accordingly. It also allows for precise spatial control: as the mouth of the talker contains the most speech information, frontal cortex can selectively enhance visual cortex activity that is relevant for speech perception by enhancing activity in subregions of visual cortex that represent the talker’s mouth. A possible anatomical linkage supporting this processing is the inferior fronto-occipital fasciculus connecting frontal and occipital regions, found in human but not non-human primates (Catani and Mesulam, 2008). Most models of speech perception focus on auditory cortex inputs into parietal and frontal cortex (Hickok and Poeppel, 2004; Rauschecker and Scott, 2009). Our findings suggest that visual cortex should also be considered an important component of the speech perception network, as it is selectively and rapidly modulated during audiovisual speech perception.
The analysis of auditory cortex responses provides an illuminating contrast with the visual cortex results. While removing auditory speech increased visual cortex response amplitudes and frontal-visual connectivity, removing visual speech did not change auditory cortex response amplitudes or connectivity. A simple explanation for this is that auditory speech is easily intelligible without visual speech, so that no attentional modulation is required. In contrast, perceiving visual-only speech requires speechreading, a difficult task that demands attentional engagement. An interesting test of this idea would be to present auditory speech with added noise. Under these circumstances, attentional engagement would be expected in order to enhance the intelligibility of the noisy auditory speech, with a neural manifestation of increased response amplitudes in auditory cortex and increased connectivity with frontal cortex. The interaction of stimulus and task also provides an explanation for the frontal activations in response to the speech stimuli. The human frontal eye fields show rapid sensory-driven responses, with latencies as short as 24 ms to auditory stimuli and 45 ms to visual stimuli (Kirchner et al., 2009). Following initial sensory activation, task demands modulate frontal function, with demanding tasks such as processing visual-only or noisy auditory speech or resulting in enhanced activity (Cheung et al., 2016; Cope et al., 2017).
Materials and methods
Subject information
Request a detailed protocolAll experimental procedures were approved by the Institutional Review Board of Baylor College of Medicine. Eight human subjects provided written informed consent prior to participating in the research protocol. The subjects (5F, mean age 36, 6L hemisphere) suffered from refractory epilepsy and were implanted with subdural electrodes guided by clinical requirements. Following surgery, subjects were tested while resting comfortably in their hospital bed in the epilepsy monitoring unit.
Experiment setup
Request a detailed protocolVisual stimuli were presented on an LCD monitor (Viewsonic VP150, 1024 × 768 pixels) positioned at 57 cm distance from the subject, resulting in a display size of 30.5° x 22.9°.
Receptive field mapping procedures
Request a detailed protocolMapping stimulus consisted of a square checkerboard pattern (3° x 3° size) briefly flashed (rate of 2 Hz and a duty cycle of 25%) in different positions on the display monitor to fill a grid over the region of interest in the visual field (63 positions, 7 × 9 grid). 12–30 trials for each position were recorded.
Subjects fixated at the center of the screen and performed a letter detection task to ensure that they were not fixating on the mapping stimulus. Different letters were randomly presented at the center of the screen (2° in size presented at a rate of 1–4 Hz) and subjects were required to press a mouse button whenever the letter ‘X’ appeared. The mean accuracy was 88 ± 14% with a false alarm rate of 8 ± 14% (mean across subjects ± SD; responses were not recorded for one subject).
Speech experiment procedures
Request a detailed protocolFour video clips of a female talker pronouncing the single syllable words ‘drive’, ‘known’, ‘last’ and ‘meant’ were presented under audiovisual (AV), visual (Vis) and auditory (Aud) conditions. Visual stimuli were presented using the same monitor used for receptive field mapping, with the face of the talker subtending approximately 13 degrees horizontally and 21 degrees vertically. Speech sounds were played through loudspeakers positioned next to the subject’s bed. The average duration of the video clips was ~1500 ms (drive: 1670 ms, known: 1300 ms, last: 1500 ms, meant: 1400 ms). In AV and Vis trials, mouth movements started at ~200 ms after the video onset on average (drive: 200 ms, known: 233 ms, last: 200 ms, meant: 200 ms). In AV trials, auditory vocalizations started at ~283 ms (drive: 267 ms, known: 233 ms, last: 300 ms, meant: 333 ms). Vocalization duration was ~480 ms on average (drive: 500 ms, known: 400 ms, last: 530 ms, meant: 500 ms).
The three different conditions were randomly intermixed, separated by interstimulus intervals of 2.5 s. 32–64 repetitions for each condition was presented. Subjects were instructed to fixate either the mouth of the talker (during Vis and AV trials) or a white fixation dot presented at the same location as the mouth of the talker on a gray background (during Aud trials and the interstimulus intervals). To ensure attention to the stimuli, subjects were instructed to press a mouse button 20% of trials in which a catch stimulus was presented, consisting of the AV word ‘PRESS’. The mean accuracy was 88 ± 18%, with a false alarm rate of 3 ± 6% (mean across subjects ± SD; for one subject, button presses were not recorded).
Control speech experiment procedures
Request a detailed protocolIn a control experiment (one subject, 32 electrodes) identical procedures were used except that the subject fixated crosshairs placed on the shoulder of the talker (Figure 2D).
Electrode localization and recording
Request a detailed protocolBefore surgery, T1-weighted structural magnetic resonance imaging scans were used to create cortical surface models with FreeSurfer, RRID:SCR_001847 (Dale et al., 1999; Fischl et al., 1999) and visualized using SUMA (Argall et al., 2006) within the Analysis of Functional Neuroimages package, RRID:SCR_005927 (Cox, 1996). Subjects underwent a whole-head CT after the electrode implantation surgery. The post-surgical CT scan and pre-surgical MR scan were aligned using and all electrode positions were marked manually on the structural MR images. Electrode positions were then projected to the nearest node on the cortical surface model using the AFNI program SurfaceMetrics. Resulting electrode positions on the cortical surface model were confirmed by comparing them with the photographs taken during the implantation surgery.
A 128-channel Cerebus amplifier (Blackrock Microsystems, Salt Lake City, UT) was used to record from subdural electrodes (Ad-Tech Corporation, Racine, WI) that consisted of platinum alloy discs embedded in a flexible silicon sheet. Two types of electrodes were implanted, containing an exposed surface of either 2.3 mm or 0.5 mm; an initial analysis did not suggest any difference in the responses recorded from the two types of electrodes, so they were grouped together for further analysis. An inactive intracranial electrode implanted facing the skull was used as a reference for recording. Signals were amplified, filtered (low-pass: 500 Hz, fourth-order Butterworth filter; high-pass: 0.3 Hz, first-order Butterworth) and digitized at 2 kHz. Data files were converted from Blackrock format to MATLAB 8.5.0 (MathWorks Inc. Natick, MA) and the continuous data stream was epoched into trials. All analyses were conducted separately for each electrode.
Receptive field mapping analysis: Evoked potentials
Request a detailed protocolThe voltage signal in each trial (consisting of the presentation of a single checkerboard at a single spatial location) was filtered using a Savitzky-Golay polynomial filter (‘‘sgolayfilt’’ function in Matlab) with polynomial order set to five and frame size set to 11. If the raw voltage exceeded a threshold of 3 standard deviations from the mean voltage, suggesting noise or amplifier saturation, the trial was discarded; <1 trial per electrode discarded on average. The filtered voltage response at each spatial location was averaged, first across trials and then across time-points (from 100 to 300 ms post-stimulus) resulting in a single value for response amplitude; these values were then plotted on a grid corresponding to the visual field (Figure 1A). A two-dimensional Gaussian function was fit to the responses to approximate the average receptive field of the neurons underlying the electrode. The center of the fitted Gaussian was used as the estimate of the RF center of the neurons underlying the electrode. A high correlation between the fitted Gaussian and the raw evoked potentials indicated an electrode with a high-amplitude, focal receptive field. A threshold of r > 0.7 was used to select only these electrodes for further consideration (Yoshor et al., 2007).
Speech stimuli analysis: Broadband power
Request a detailed protocolWhile for the RF mapping analysis, we used raw voltage as our measure of neural response, speech stimuli evoke a long-lasting response not measurable with evoked potentials. Therefore, our primary measure of neural activity was the broadband (non-synchronous) response in the high-gamma frequency band, ranging from 70 to 150 Hz. This response is thought to reflect action potentials in nearby neurons (Jacques et al., 2016; Mukamel et al., 2005; Nir et al., 2007; Ray and Maunsell, 2011). To calculate broadband power, the average signal across all electrodes was subtracted from each individual electrode’s signal (common average referencing), line noise at 60, 120, 180 Hz was filtered and the data was transformed to time–frequency space using the multitaper method available in the FieldTrip toolbox (Oostenveld et al., 2011) with 3 Slepian tapers; frequency window from 10 to 200 Hz; frequency steps of 2 Hz; time steps of 10 ms; temporal smoothing of 200 ms; frequency smoothing of ±10 Hz.
The broadband response at each time point following stimulus onset was measured as the percent change from baseline, with the baseline calculated over all trials and all experimental conditions in a time window from −500 to −100 ms before stimulus onset. To reject outliers, if at any point following stimulus onset the response was greater than ten standard deviations from the mean calculated across the rest of the trials, the entire trial was discarded (average of 10 trials were discarded per electrode, range from 1 to 16).
Visual cortex electrode selection
Request a detailed protocolAcross eight subjects, we recorded from 154 occipital lobe electrodes. These were winnowed using two criteria. First, a well-demarcated spatial receptive field (see Receptive Field Mapping Analysis section, above). Second, a significant (q < 0.01, false-discovery rate corrected) broadband response to AV speech; because only the response to AV trials was used to select electrodes, we could measure the response to the Aud and Vis conditions without bias. Out of 154 total occipital lobe electrodes, 73 electrodes met both criteria.
Auditory cortex electrode selection
Request a detailed protocolWe recorded from 102 electrodes located on the superior temporal gyrus. 44 out of 102 electrodes showed a significant (q < 0.01, false-discovery rate corrected) broadband response to AV speech.
Frontal cortex electrode selection
Request a detailed protocolWe recorded from 179 electrodes located in lateral frontal cortex, defined as the lateral convexity of the hemisphere anterior to the central sulcus. 44 out of 179 electrodes showed a significant (q < 0.01, false-discovery rate corrected) broadband response to AV speech. In each of the eight subjects, we selected the single frontal electrode that showed the largest broadband response to AV speech, measured as the signal-to-noise ratio (μ/σ).
Linear mixed effects modeling
Request a detailed protocolWe used the lme4 package, RRID:SCR_015654 (Bates et al., 2014) for the R Project for Statistical Computing, RRID:SCR_001905 to perform linear mixed effect (LME) analyses. Complete details of each analysis shown in Tables. Similar to an ANOVA (but allowing for missing data), the LME estimated the effect of each factor in units of the dependent variable (equivalent to beta weights in a linear regression) relative to an arbitrary baseline condition (defined in our analysis as the response to AV speech) and a standard error.
Functional connectivity analysis
Request a detailed protocolThe average high-gamma power in the 200–1500 milliseconds was calculated for each trial, corresponding to this time in which mouth movements occur in the speech stimuli. After calculating the average broadband (70–150 Hz) power for each trial, functional connectivity between the 73 frontal-visual cortex as well as 44 frontal-auditory electrode pairs was measured by calculating the trial-by-trial Spearman rank correlation across trials of the same speech condition (AV, Vis or Aud) (Foster et al., 2015; Hipp et al., 2012).
Time point of enhancement onset analysis
Request a detailed protocolThe average response showed a long-lasting enhancement for visual speech (Figure 1C). In order to measure the time at which this occurred in individual electrodes, we compared the time course of the response to Vis and AV condition. The onset of enhancement was defined as the first time point in which there was a long-lasting (>=200 ms) significantly greater response (p<0.05 using a running t-test) to Vis compared with AV speech. Using these criteria, we were able to measure the enhancement onset time in 7 frontal and 29 visual electrodes (Figure 4D).
References
-
Simplified intersubject averaging on the cortical surface using SUMAHuman Brain Mapping 27:14–27.https://doi.org/10.1002/hbm.20158
-
Reading speech from still and moving faces: the neural substrates of visible speechJournal of Cognitive Neuroscience 15:57–70.https://doi.org/10.1162/089892903321107828
-
Spatiotemporal dynamics of word processing in the human brainFrontiers in Neuroscience 1:185–196.https://doi.org/10.3389/neuro.01.1.1.014.2007
-
Control of goal-directed and stimulus-driven attention in the brainNature Reviews Neuroscience 3:201–215.https://doi.org/10.1038/nrn755
-
AFNI: software for analysis and visualization of functional magnetic resonance neuroimagesComputers and Biomedical Research 29:162–173.https://doi.org/10.1006/cbmr.1996.0014
-
Induced electrocorticographic gamma activity during auditory perceptionClinical Neurophysiology 112:565–582.https://doi.org/10.1016/S1388-2457(00)00545-9
-
Neural correlates of visual?spatial attention in electrocorticographic signals in humansFrontiers in Human Neuroscience 5:89.https://doi.org/10.3389/fnhum.2011.00089
-
Reading fluent speech from talking faces: typical brain networks and individual differencesJournal of Cognitive Neuroscience 17:939–953.https://doi.org/10.1162/0898929054021175
-
Large-scale cortical correlation structure of spontaneous oscillatory activityNature Neuroscience 15:884–890.https://doi.org/10.1038/nn.3101
-
Mechanisms of visual attention in the human cortexAnnual Review of Neuroscience 23:315–341.https://doi.org/10.1146/annurev.neuro.23.1.315
-
Ultra-rapid sensory responses in the human frontal eye field regionJournal of Neuroscience 29:7599–7606.https://doi.org/10.1523/JNEUROSCI.1233-09.2009
-
Cortical circuits for the control of attentionCurrent Opinion in Neurobiology 23:216–222.https://doi.org/10.1016/j.conb.2012.11.011
-
FieldTrip: Open source software for advanced analysis of MEG, EEG, and invasive electrophysiological dataComputational Intelligence and Neuroscience 2011:1–9.https://doi.org/10.1155/2011/156869
-
FEF-controlled alpha delay activity precedes stimulus-induced gamma-band activity in visual cortexThe Journal of Neuroscience 37:4117–4127.https://doi.org/10.1523/JNEUROSCI.3015-16.2017
-
Eye movement of perceivers during audiovisual speech perceptionPerception & Psychophysics 60:926–940.https://doi.org/10.3758/BF03211929
-
Gaze patterns and audiovisual speech enhancementJournal of Speech Language and Hearing Research 56:471–480.https://doi.org/10.1044/1092-4388(2012/10-0288)
-
Receptive fields in human visual cortex mapped with surface electrodesCerebral Cortex 17:2293–2302.https://doi.org/10.1093/cercor/bhl138
Article and author information
Author details
Michael S Beauchamp

Funding
Veterans Administration Clinical Science Research and Development (Merit Award Number 1I01CX000325)
- Daniel Yoshor
National Institutes of Health (R01NS065395)
- Michael S Beauchamp
National Institutes of Health (U01NS098976)
- Michael S Beauchamp
The funders had no role in study design, data collection and interpretation, or the decision to submit the work for publication.
Acknowledgements
This research was funded by Veterans Administration Clinical Science Research and Development Merit Award Number 1I01C × 000325–01A1, NIH R01NS065395 U01NS098976.
Ethics
Human subjects: All experimental procedures were approved by the Institutional Review Board of Baylor College of Medicine. Eight human subjects provided written informed consent prior to participating in the research protocol. The experimenter who recorded the stimuli used in the experiments gave written authorization for her likeness to be used for illustrating the stimuli in Figures 1 and 2 of the manuscript.
Version history
- Received: July 13, 2017
- Accepted: February 18, 2018
- Version of Record published: February 27, 2018 (version 1)
Copyright
This is an open-access article, free of all copyright, and may be freely reproduced, distributed, transmitted, modified, built upon, or otherwise used by anyone for any lawful purpose. The work is made available under the Creative Commons CC0 public domain dedication.
Metrics
-
- 1,356
- views
-
- 184
- downloads
-
- 15
- citations
Views, downloads and citations are aggregated across all versions of this paper published by eLife.
Download links
A two-part list of links to download the article, or parts of the article, in various formats.
Downloads (link to download the article as PDF)
Open citations (links to open the citations from this article in various online reference manager services)
Cite this article (links to download the citations from this article in formats compatible with various reference manager tools)
Frontal cortex selects representations of the talker’s mouth to aid in speech perception
eLife 7:e30387.
https://doi.org/10.7554/eLife.30387
Further reading
-
- Neuroscience
Mechanosensory neurons located across the body surface respond to tactile stimuli and elicit diverse behavioral responses, from relatively simple stimulus location-aimed movements to complex movement sequences. How mechanosensory neurons and their postsynaptic circuits influence such diverse behaviors remains unclear. We previously discovered that Drosophila perform a body location-prioritized grooming sequence when mechanosensory neurons at different locations on the head and body are simultaneously stimulated by dust (Hampel et al., 2017; Seeds et al., 2014). Here, we identify nearly all mechanosensory neurons on the Drosophila head that individually elicit aimed grooming of specific head locations, while collectively eliciting a whole head grooming sequence. Different tracing methods were used to reconstruct the projections of these neurons from different locations on the head to their distinct arborizations in the brain. This provides the first synaptic resolution somatotopic map of a head, and defines the parallel-projecting mechanosensory pathways that elicit head grooming.
-
- Neuroscience
Cortical folding is an important feature of primate brains that plays a crucial role in various cognitive and behavioral processes. Extensive research has revealed both similarities and differences in folding morphology and brain function among primates including macaque and human. The folding morphology is the basis of brain function, making cross-species studies on folding morphology important for understanding brain function and species evolution. However, prior studies on cross-species folding morphology mainly focused on partial regions of the cortex instead of the entire brain. Previously, our research defined a whole-brain landmark based on folding morphology: the gyral peak. It was found to exist stably across individuals and ages in both human and macaque brains. Shared and unique gyral peaks in human and macaque are identified in this study, and their similarities and differences in spatial distribution, anatomical morphology, and functional connectivity were also dicussed.


