Human Brain Basis of Musical Rhythm Perception: Common and Distinct Neural Substrates for Meter, Tempo, and Pattern

Abstract
:1. Introduction
2. Experimental Section
2.1. Subjects
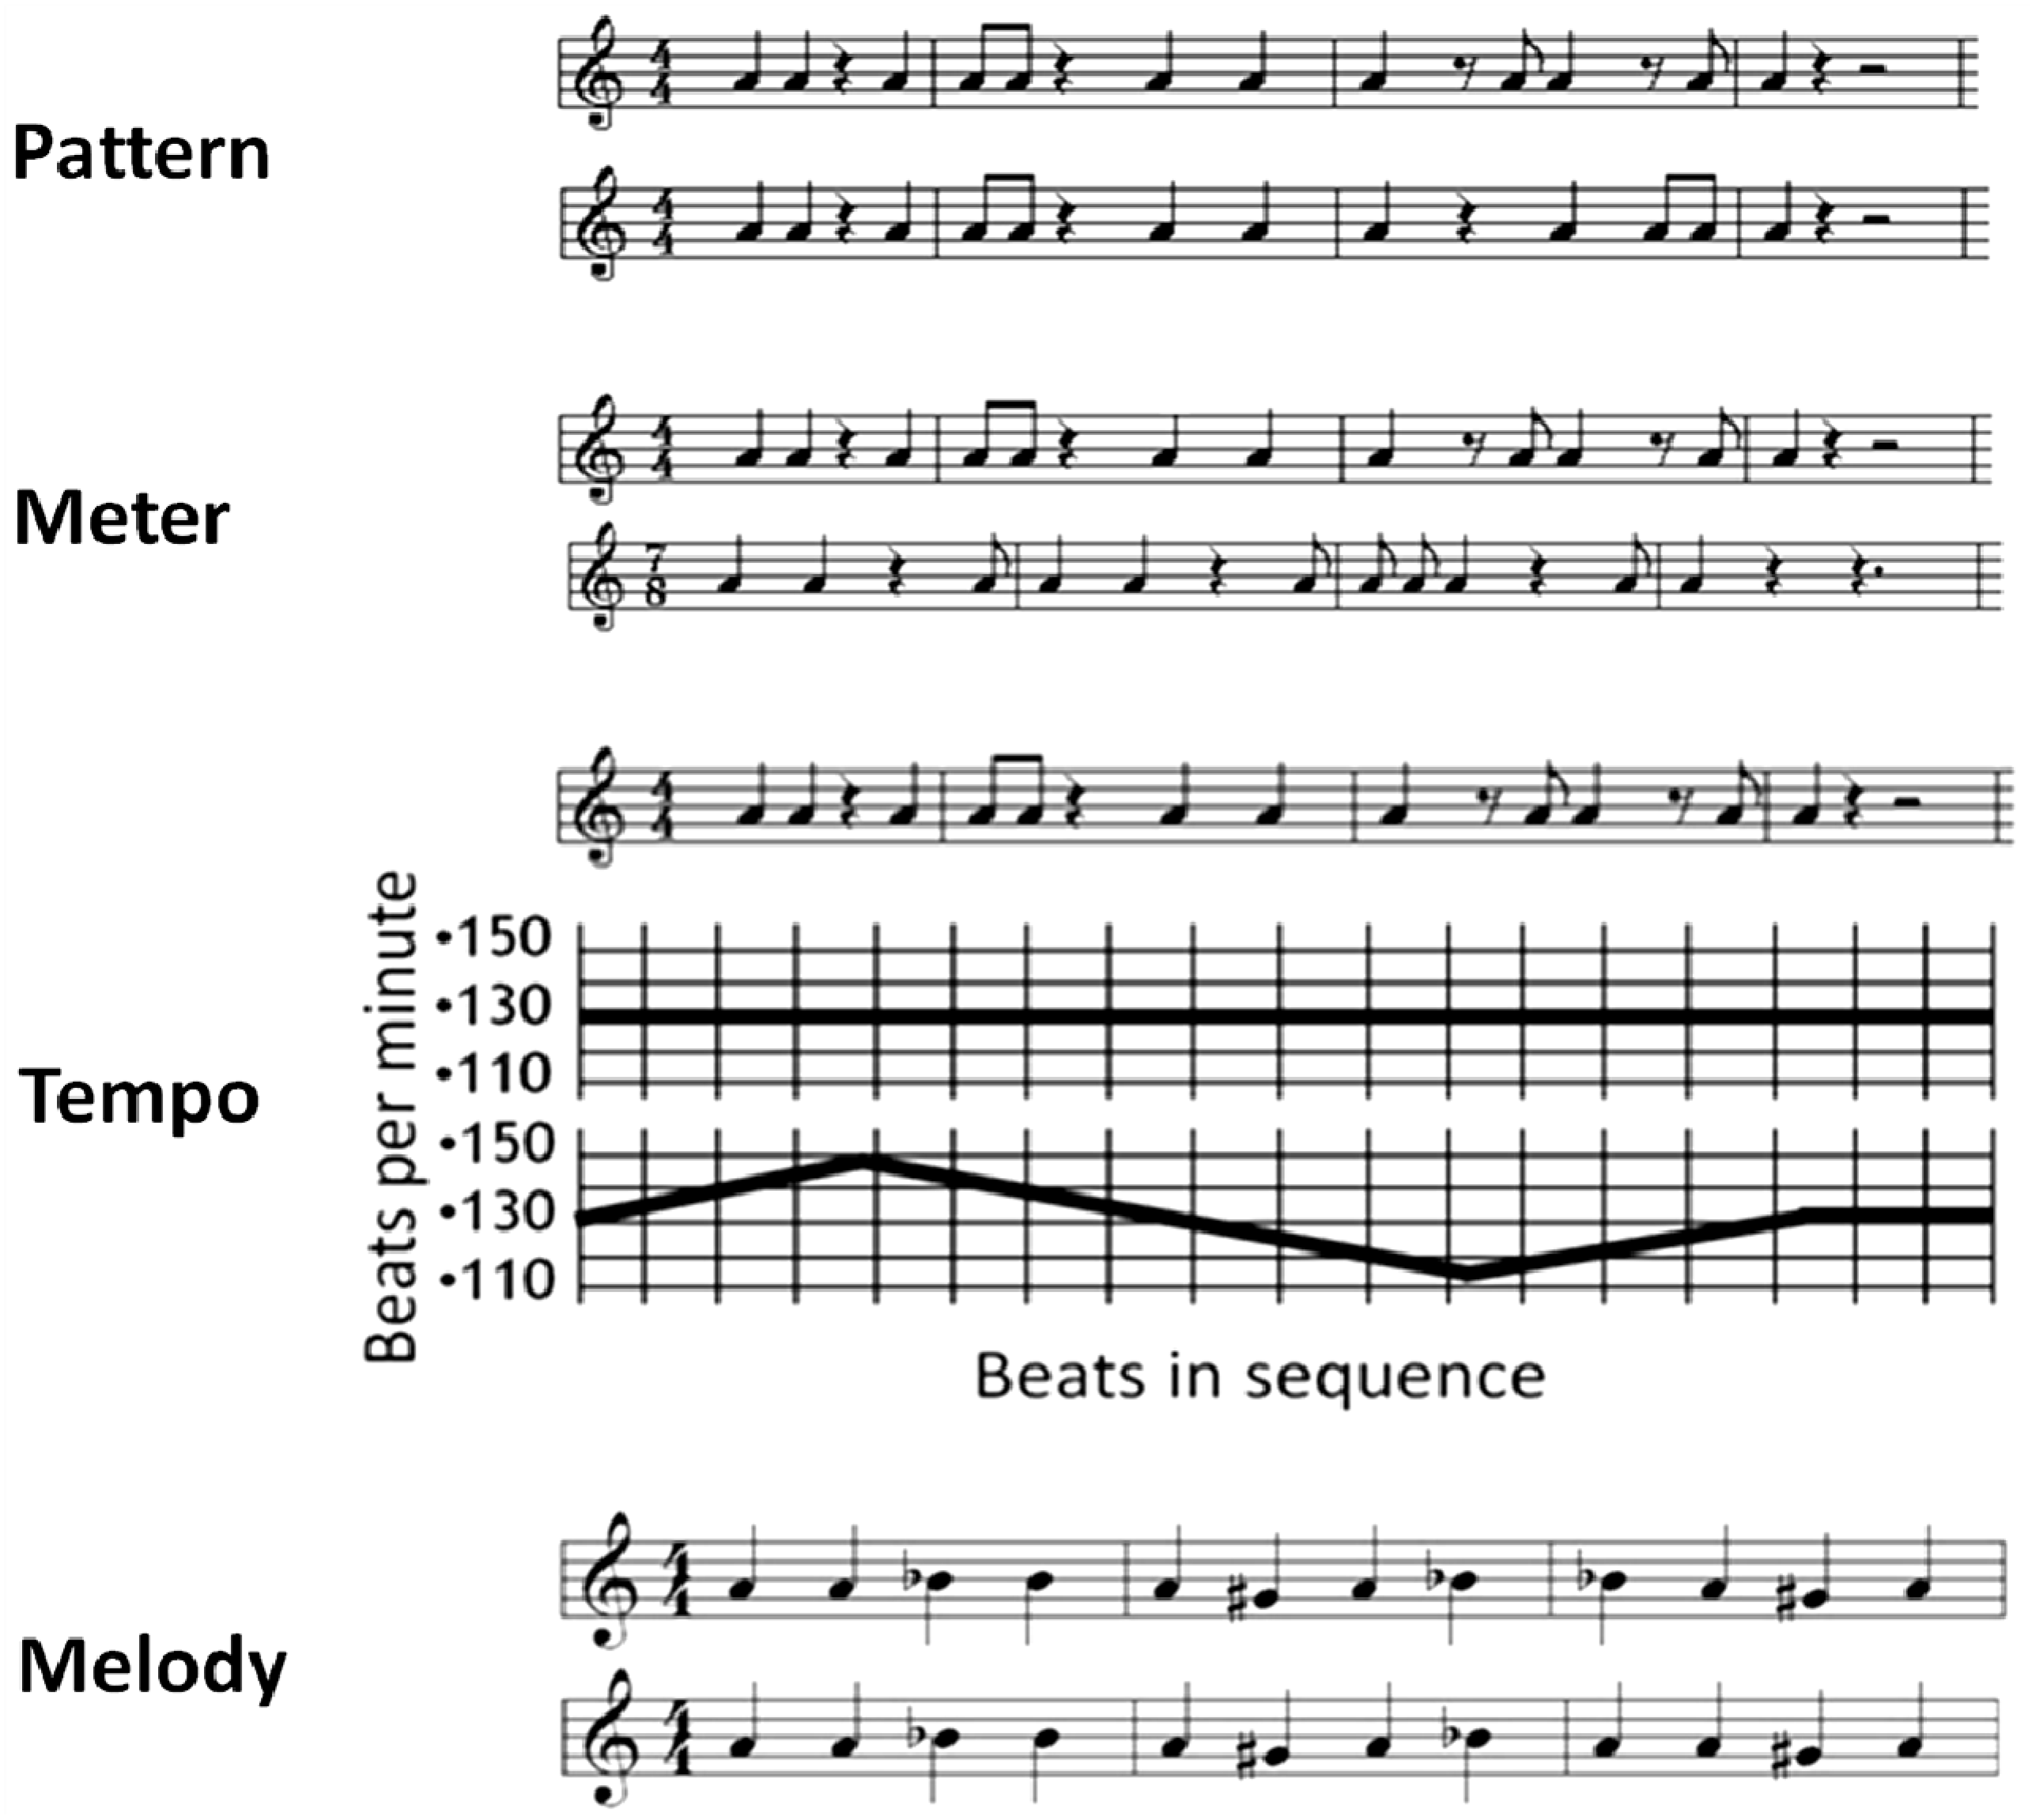
2.2. Stimuli and Task

2.3. Procedure
2.4. Image Acquisition
2.5. Imaging Analyses
3. Results
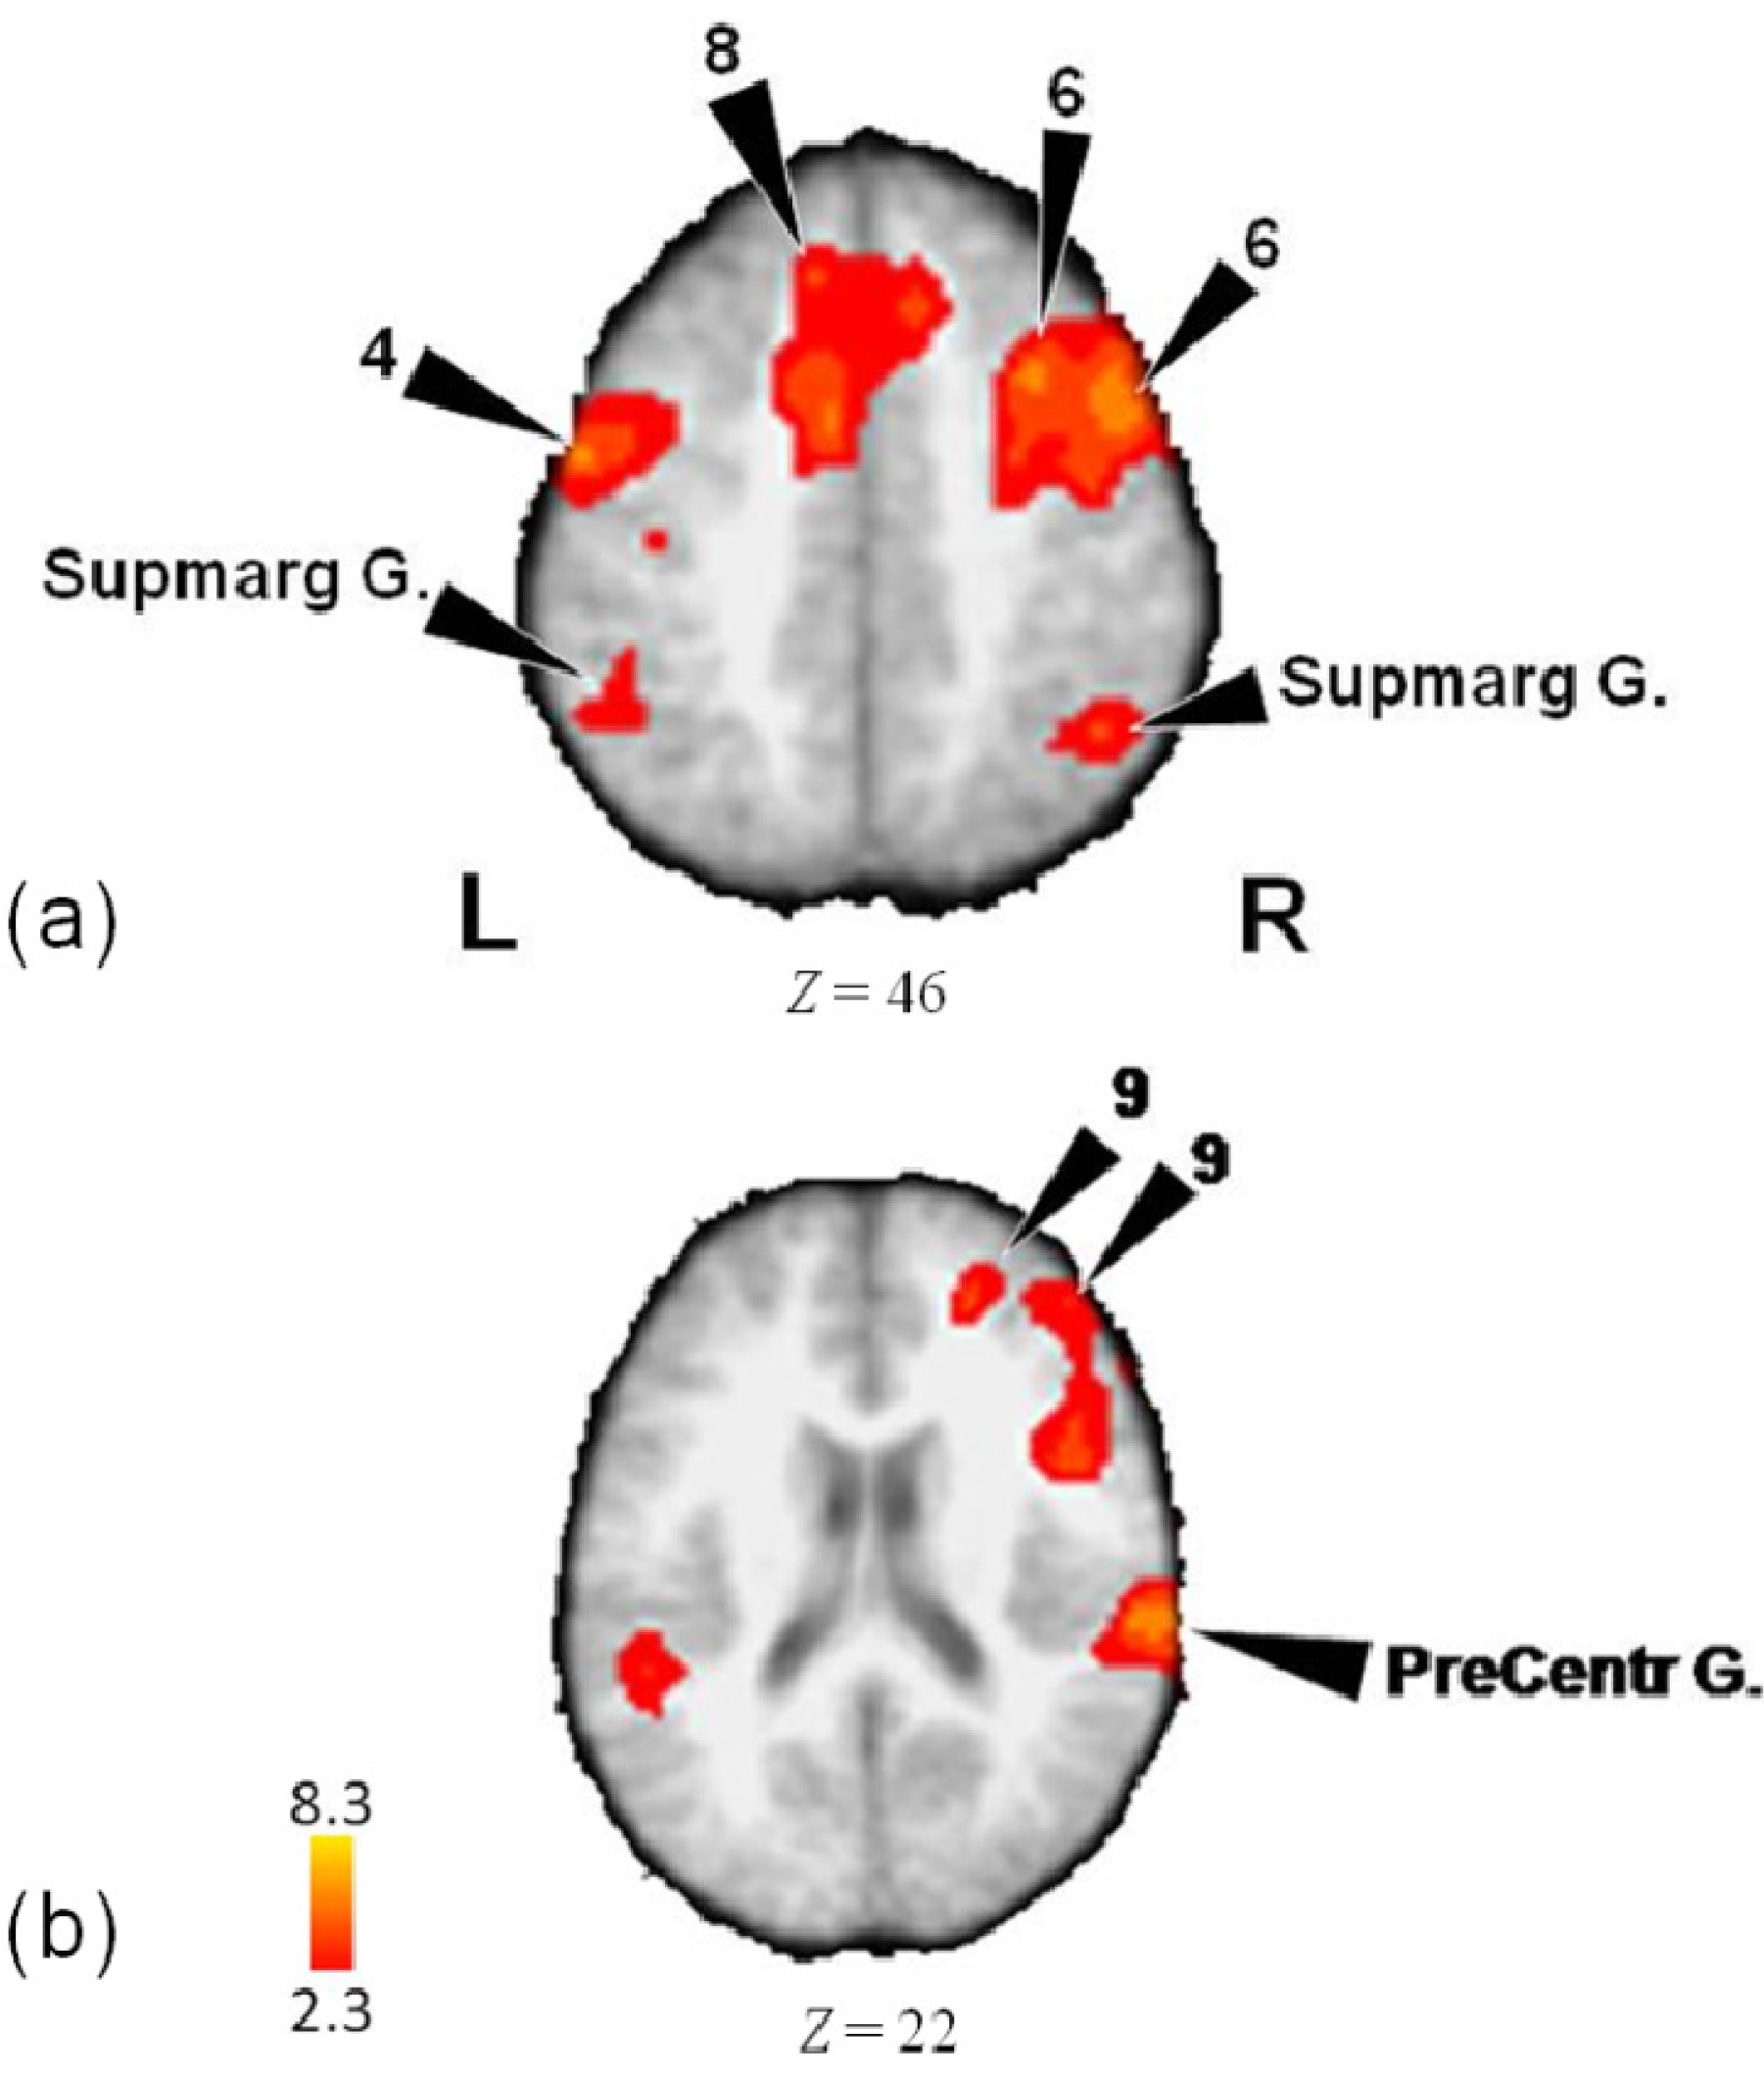
3.1. Activity for Tempo, Meter and Pattern Combined


| Lobe | Region | Z-Score | x | y | z | BA |
|---|---|---|---|---|---|---|
| Frontal | ||||||
| L | Medial Frontal Gyrus | 3.82 | 0 | 30 | 46 | 8 |
| Medial Frontal Gyrus | 3.67 | −8 | 32 | 48 | 8 | |
| Precentral Gyrus | 5.23 | −56 | −8 | 42 | 4 | |
| Precentral Gyrus | 5.17 | −54 | −4 | 48 | 4 | |
| Precentral Gyrus | 3.43 | −64 | 4 | 42 | 6 | |
| R | Inferior Frontal Gyrus | 4.18 | 48 | 6 | 24 | 9 |
| Inferior Frontal Gyrus | 2.98 | 46 | 24 | 0 | 45 | |
| Anterior Insula | 5.09 | 46 | 14 | 12 | 13 | |
| Medial Frontal Gyrus | 4.22 | 24 | 46 | 22 | 9 | |
| Medial Frontal Gyrus | 3.86 | 10 | 26 | 46 | 8 | |
| Middle Frontal Gyrus | 6.03 | 48 | 10 | 44 | 6 | |
| Middle Frontal Gyrus | 5.59 | 34 | 14 | 52 | 6 | |
| Middle Frontal Gyrus | 3.97 | 30 | −2 | 54 | 6 | |
| Middle Frontal Gyrus | 3.94 | 30 | −2 | 50 | 6 | |
| Middle Frontal Gyrus | 3.02 | 50 | 28 | 48 | 8 | |
| Middle Frontal Gyrus | 3.6 | 46 | 44 | 20 | 10 | |
| Middle Frontal Gyrus | 3.5 | 50 | 38 | 24 | 9 | |
| Precentral Gyrus | 4.72 | 44 | −10 | 46 | 4 | |
| Limbic | ||||||
| L | Anterior Cingulate Gyrus | 5.01 | −6 | 2 | 48 | 24 |
| R | Anterior Cingulate Gyrus | 3.77 | 10 | 26 | 42 | 32 |
| Parietal | ||||||
| L | Supramarginal Gyrus | 4.85 | −54 | −50 | 32 | 40 |
| Supramarginal Gyrus | 4.52 | −70 | −48 | 34 | 40 | |
| R | Postcentral Gyrus | 5.52 | 64 | −28 | 20 | 40 |
| Precuneus | 5.11 | 24 | −64 | 30 | 7 | |
| Supramarginal Gyrus | 6.65 | 50 | −38 | 34 | 40 | |
| Supramarginal Gyrus | 5.03 | 52 | −38 | 38 | 40 | |
| Temporal | ||||||
| L | Superior Temporal Gyrus | 5.85 | −54 | −44 | 14 | 22 |
| Superior Temporal Gyrus | 5.71 | −78 | −24 | 8 | 42 | |
| Superior Temporal Gyrus | 5.46 | −44 | −26 | 6 | 22 | |
| Superior Temporal Gyrus | 5.24 | −54 | −40 | 14 | 22 | |
| R | Superior Temporal Gyrus | 5.1 | 50 | −20 | 6 | 13 |
| Cerebellum | ||||||
| R | Crus I | 4.95 | 42 | −64 | −34 | |
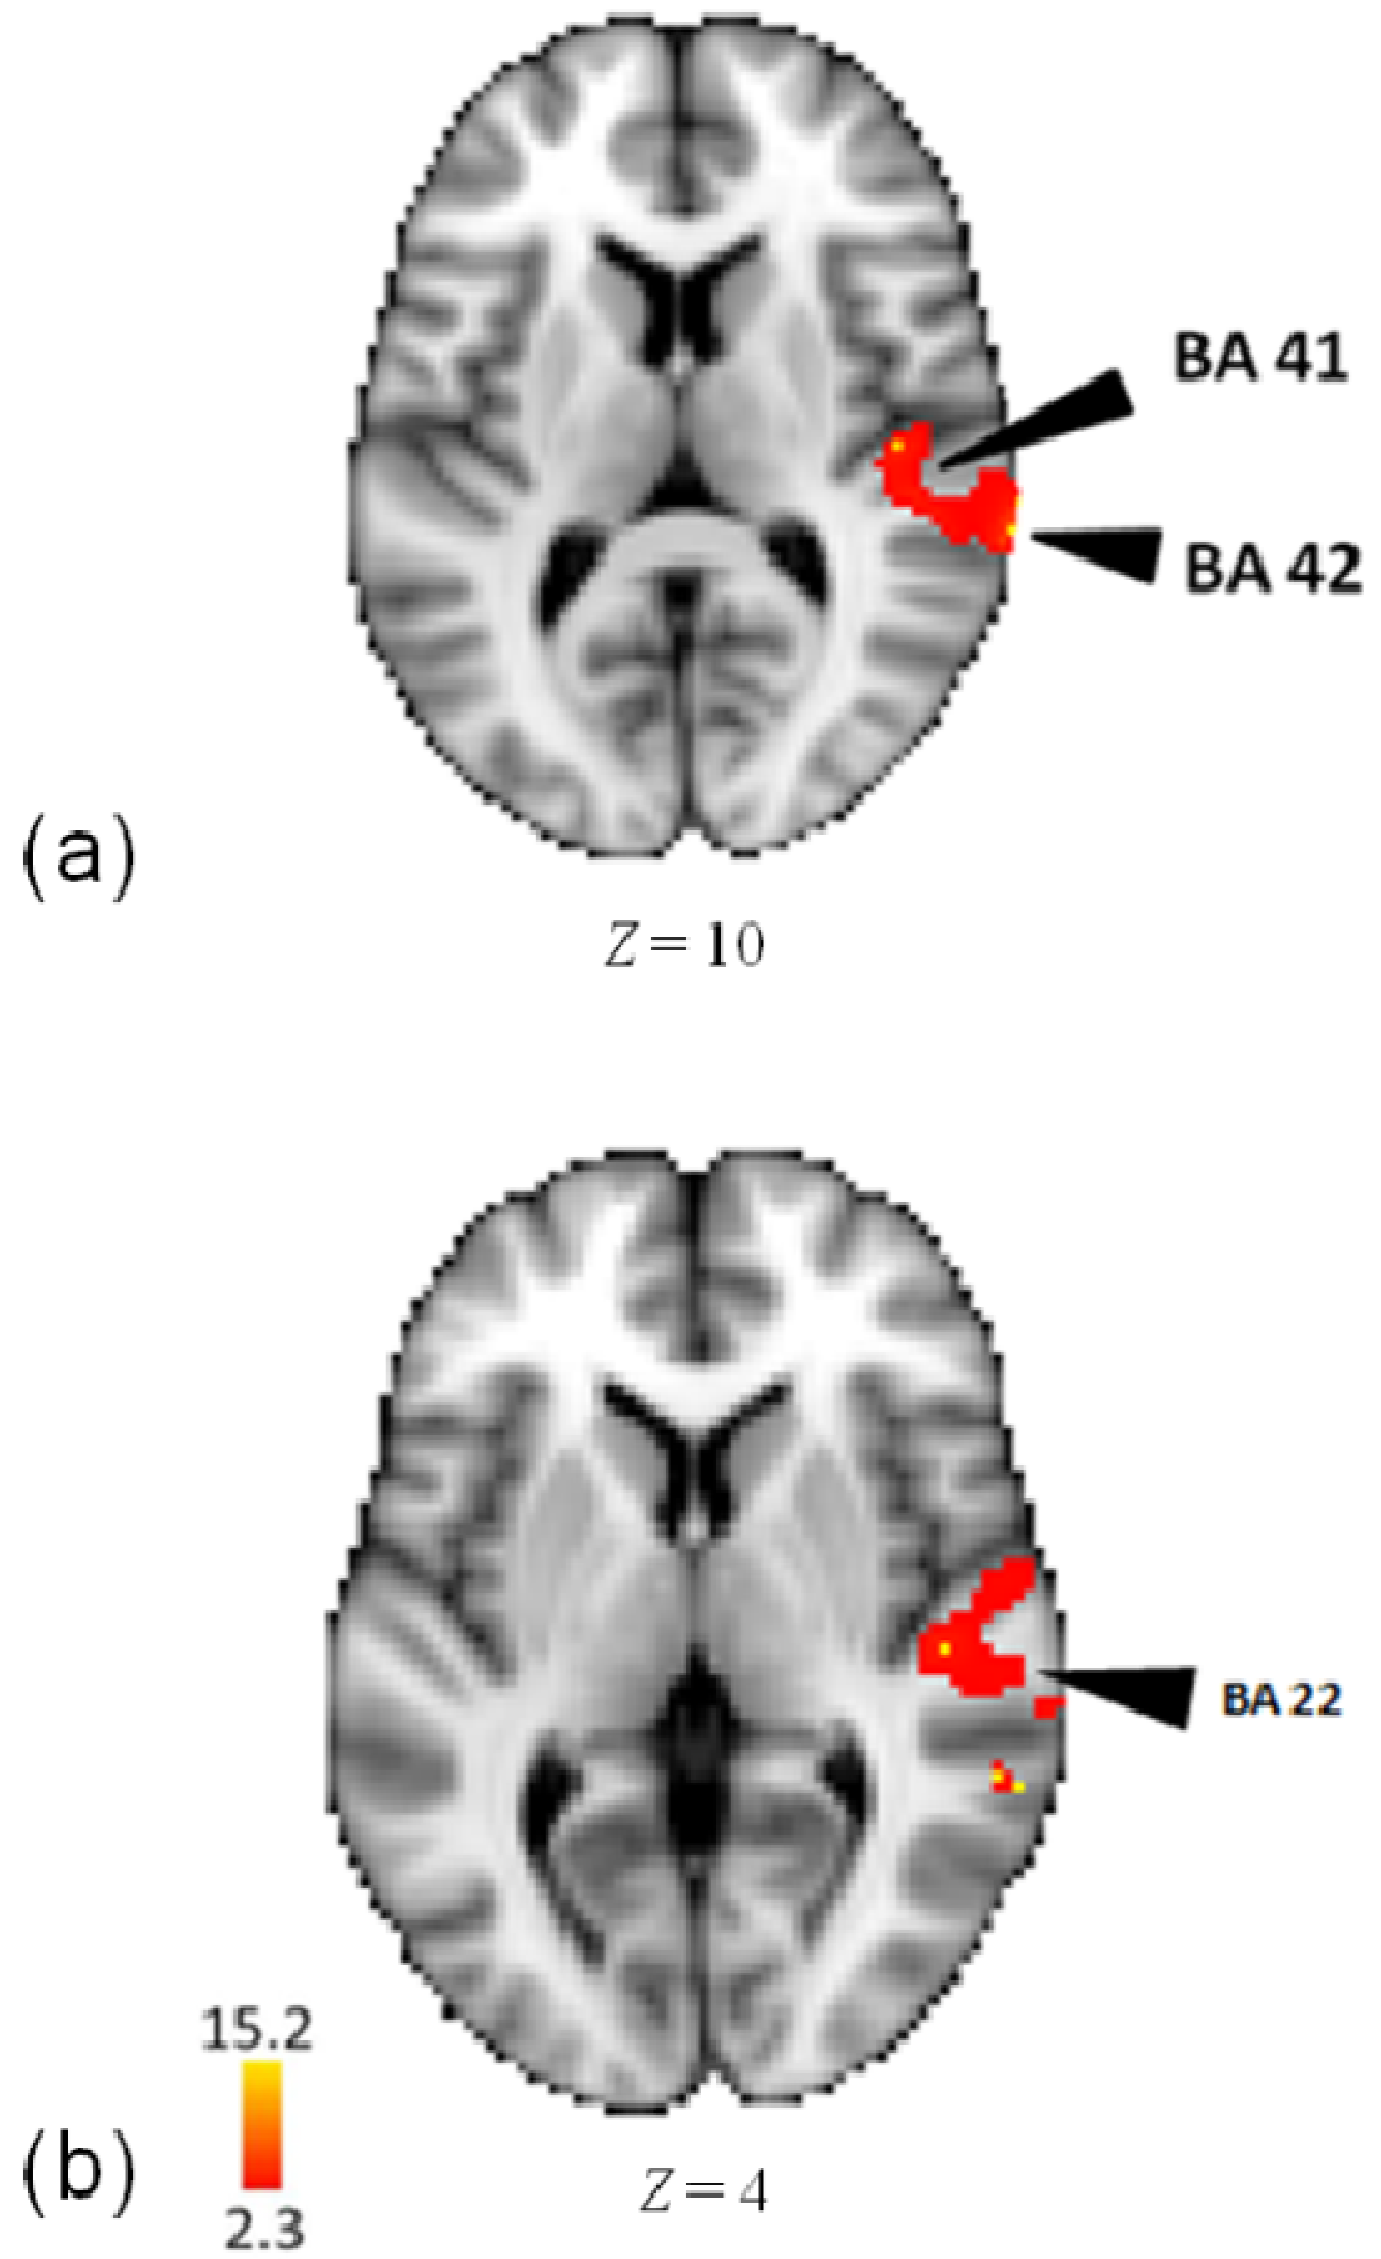
3.2. Activity for Pattern

| Lobe | Region | Z-Score | x | y | z | BA |
|---|---|---|---|---|---|---|
| Pattern-Rest | ||||||
| Temporal | Middle Temporal Gyrus | 14.7 | 62 | −46 | 4 | 22 |
| R | Middle Temporal Gyrus | 14.6 | 60 | −38 | 6 | 22 |
| Superior Temporal Gyrus | 15.3 | 72 | −30 | 10 | 42 | |
| Superior Temporal Gyrus | 14.9 | 66 | −34 | 6 | 22 | |
| Superior Temporal Gyrus | 14.8 | 48 | −30 | 14 | 41 | |
| Transverse Temporal Gyrus | 15.1 | 70 | −6 | 10 | 42 | |
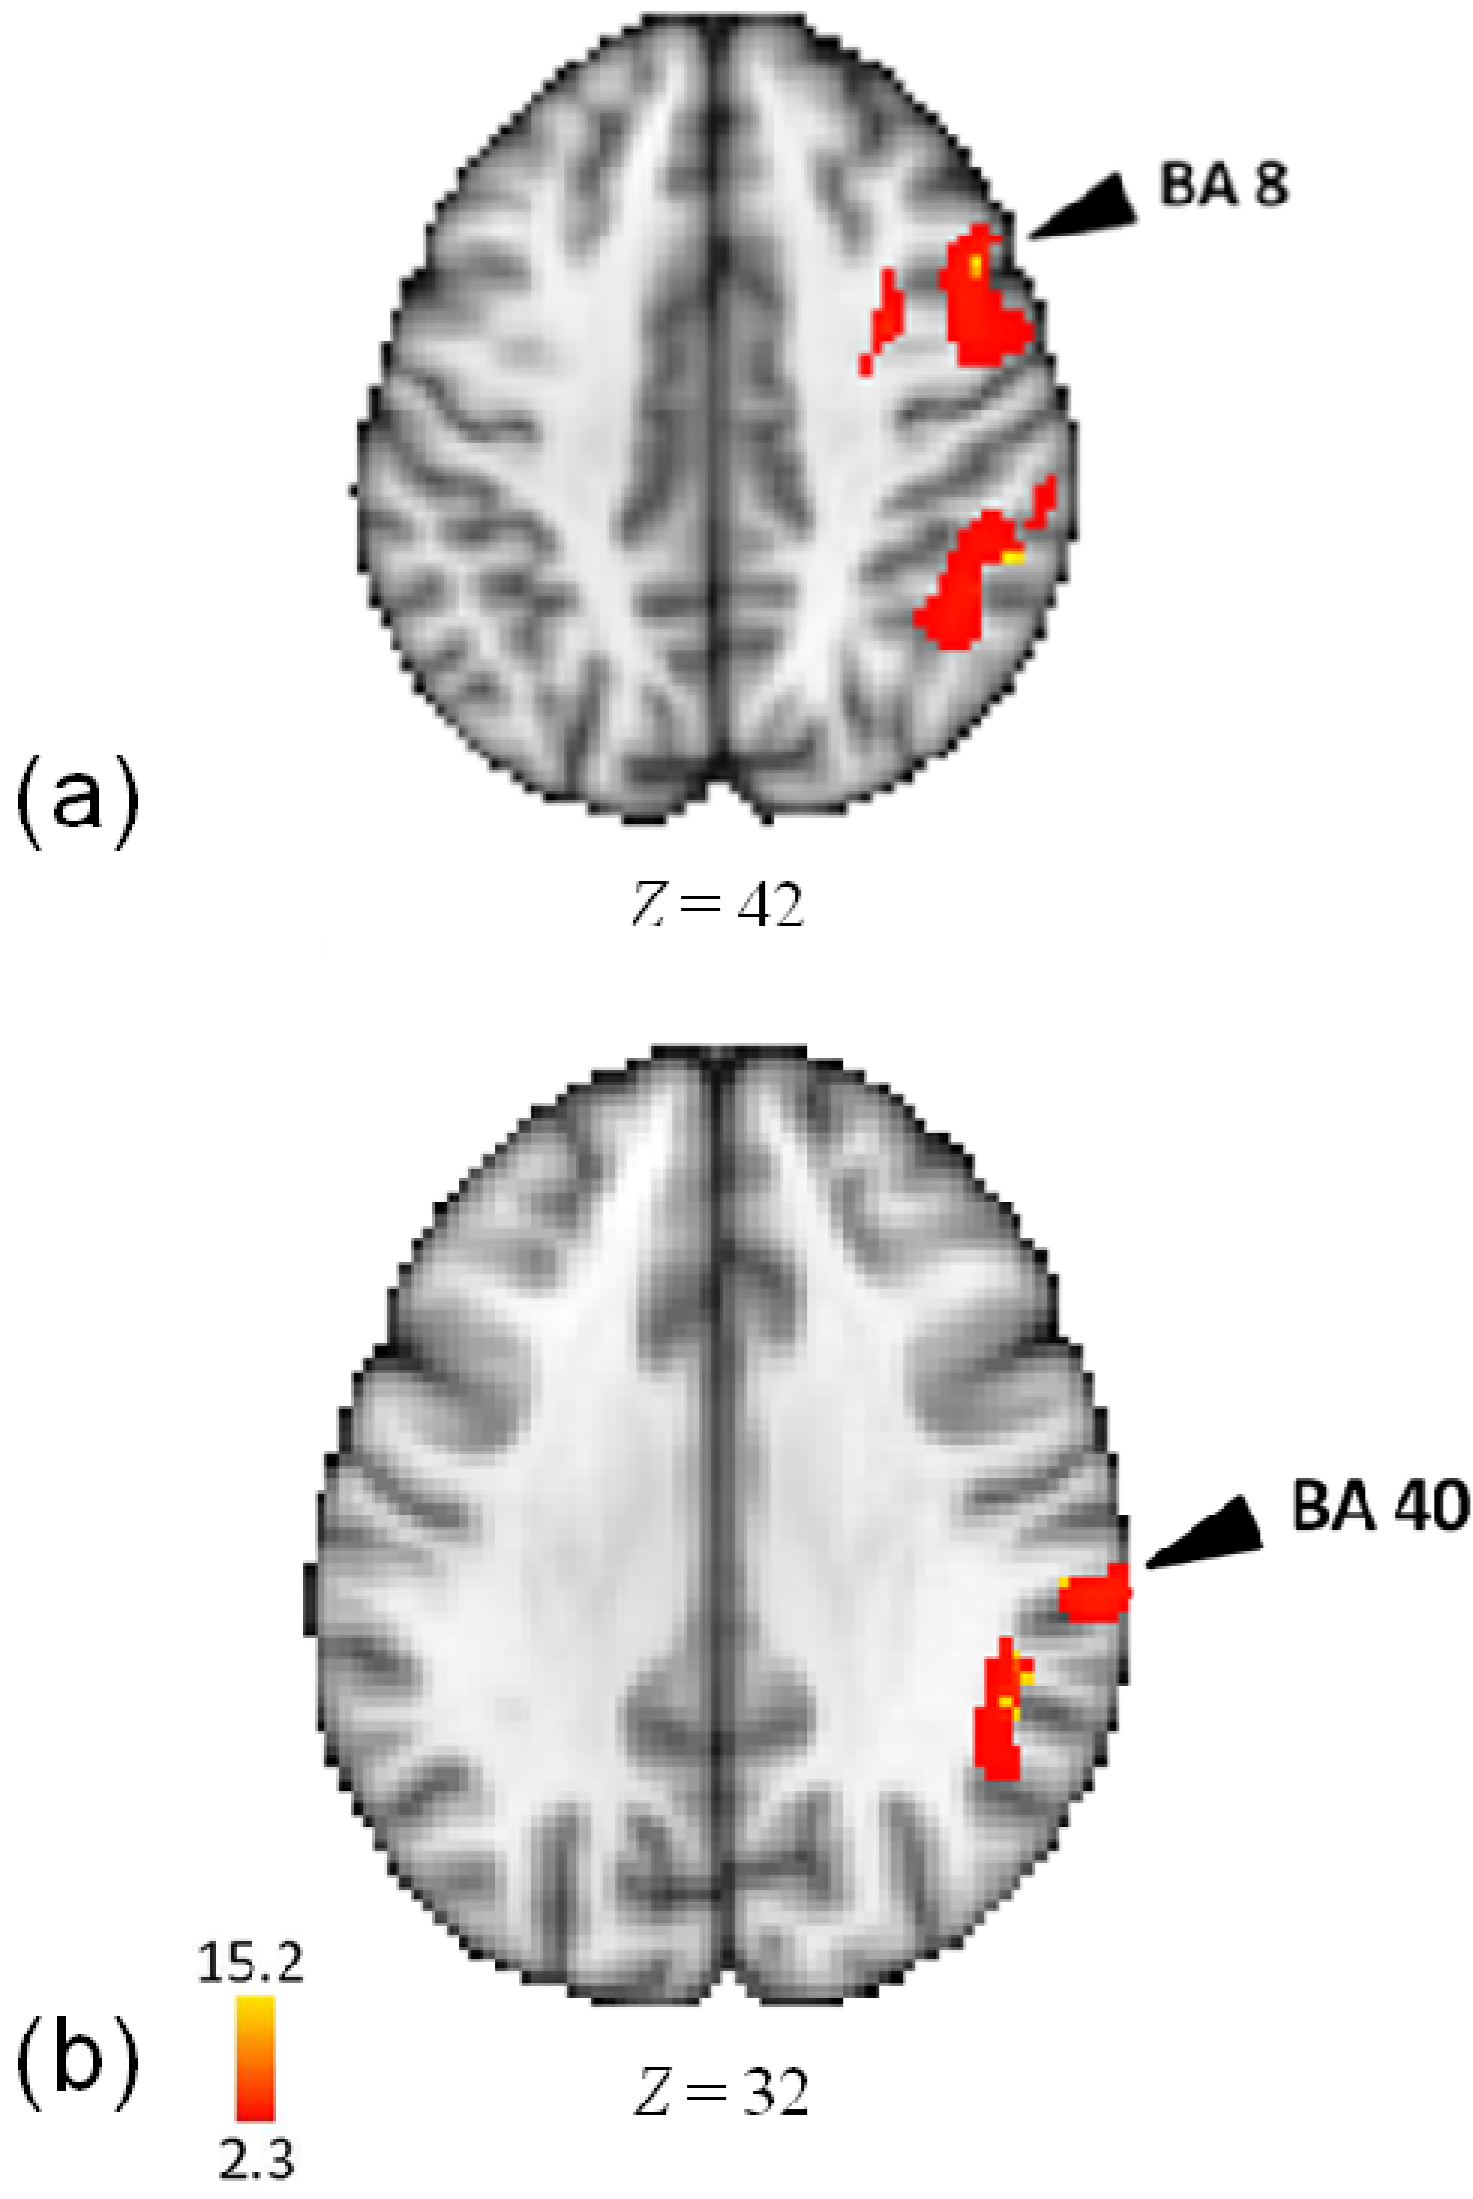
3.3. Activity for Meter

| Lobe | Region | Z-Score | x | y | z | BA |
|---|---|---|---|---|---|---|
| Meter-Rest | ||||||
| Frontal | ||||||
| R | Inferior Frontal Gyrus | 10.2 | 60 | 26 | 20 | 9 |
| Inferior Frontal Gyrus | 10.1 | 60 | 20 | 14 | 44 | |
| Inferior Frontal Gyrus | 9.61 | 56 | 20 | 14 | 44 | |
| Middle Frontal Gyrus | 6.72 | 42 | 34 | 10 | 46 | |
| Precentral Gyrus | 11 | 56 | 18 | 4 | 44 | |
| Precentral Gyrus | 6.82 | 48 | 4 | 24 | 6 | |
3.4. Activity for Tempo

| Lobe | Region | Z-Score | x | y | z | BA |
|---|---|---|---|---|---|---|
| Tempo-Rest | ||||||
| Frontal | ||||||
| R | Middle Frontal Gyrus | 15.2 | 30 | 0 | 46 | 6 |
| Precentral Gyrus | 15.2 | 36 | −6 | 50 | 6 | |
| Middle Frontal Gyrus | 15.1 | 34 | 0 | 54 | 6 | |
| Middle Frontal Gyrus | 14.9 | 48 | 12 | 40 | 8 | |
| Middle Frontal Gyrus | 14.8 | 34 | 12 | 54 | 6 | |
| Middle Frontal Gyrus | 14.7 | 46 | 2 | 46 | 6 | |
| Posterior Insula | 14.6 | 52 | −38 | 28 | 13 | |
| Parietal | ||||||
| R | Inferior Parietal Lobule | 14.9 | 62 | −26 | 30 | 40 |
| Inferior Parietal Lobule | 14.8 | 54 | −42 | 40 | 40 | |
| Supramarginal Gyrus | 14.6 | 48 | −44 | 34 | 40 | |
| Temporal | ||||||
| R | Superior Temporal Gyrus | 15.1 | 64 | −10 | 2 | 22 |
| Superior Temporal Gyrus | 14.8 | 78 | −28 | 20 | 42 | |
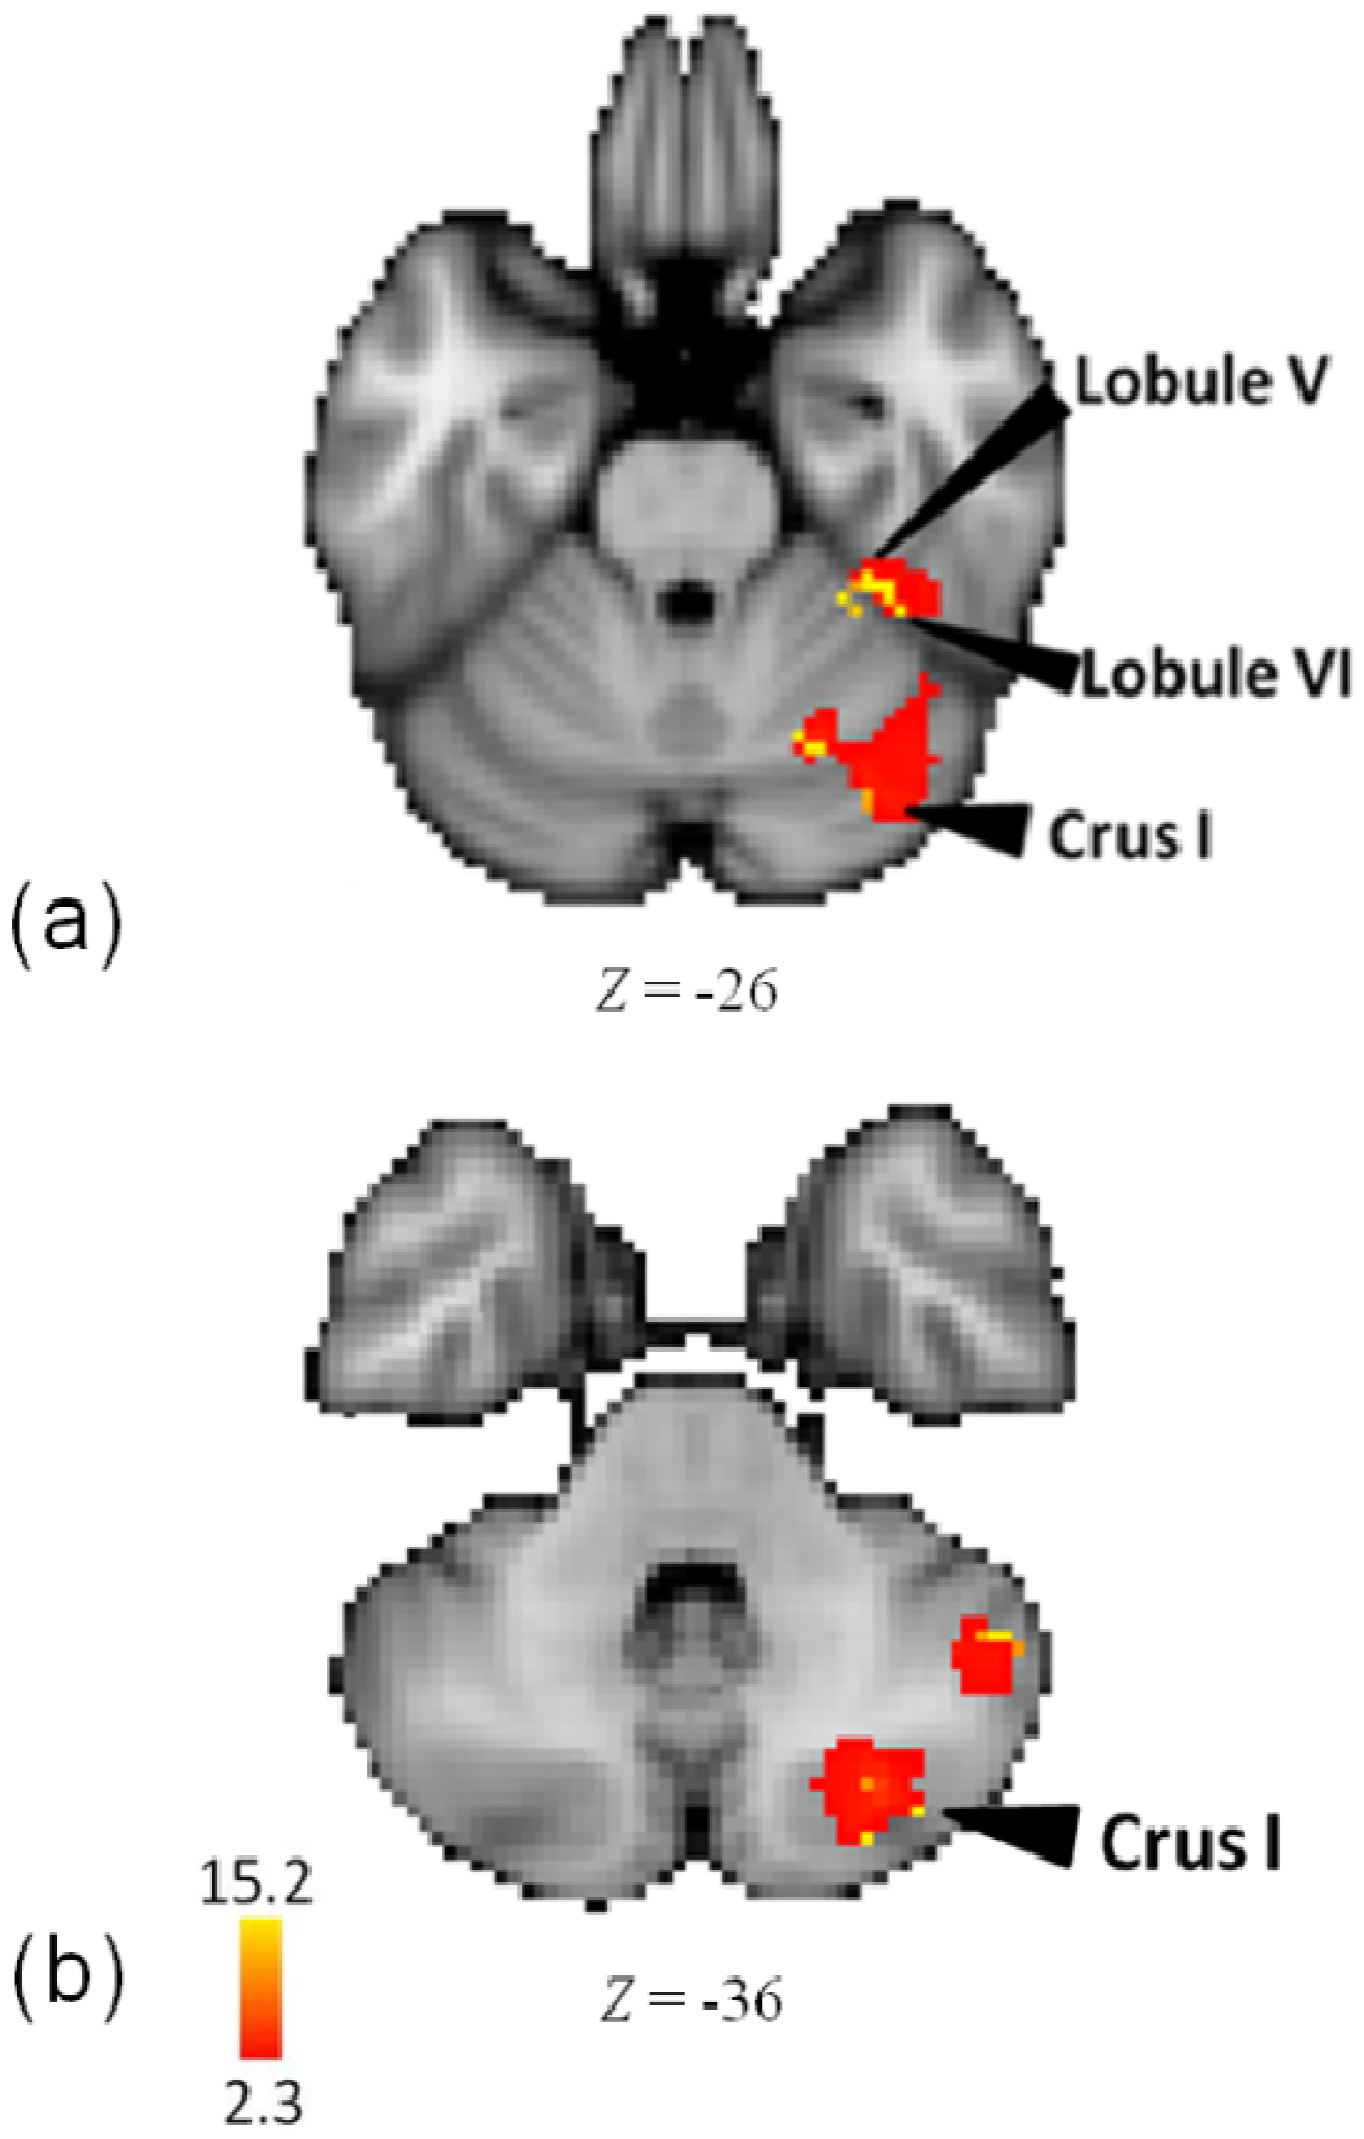
3.5. Melody

| Lobe | Region | Z-Score | x | y | z | BA |
|---|---|---|---|---|---|---|
| Frontal | ||||||
| R | Insula | 15.2 | 46 | −14 | 8 | 13 |
| Insula | 14.1 | 42 | −12 | 10 | 13 | |
| Parietal | ||||||
| R | Postcentral Gyrus | 14.1 | 60 | −20 | 20 | 40 |
| Postcentral Gyrus | 13.9 | 58 | −24 | 22 | 40 | |
| Sub-cortical | ||||||
| R | Claustrum | 14.2 | 42 | −12 | 6 | - |
| Temporal | ||||||
| R | Superior Temporal Gyrus | 15 | 70 | −28 | 22 | 42 |
| Cerebellum | ||||||
| R | Lobule V | 15.3 | 34 | −38 | −26 | - |
| Lobule VI | 14.8 | 38 | −42 | −26 | - | |
| Crus I | 15.1 | 36 | −78 | −36 | - | |
| Lobule VI | 14.9 | 24 | −64 | −30 | - | |
| Crus I | 14.9 | 36 | −74 | −28 | - | |
| Crus I | 14.8 | 30 | −76 | −38 | - | |
3.6. Comparing Musicians vs. Non-Musicians
4. Discussion
4.1. Common Mechanisms for Pattern, Meter, and Tempo
4.2. Distinct Mechanisms for Pattern, Meter, and Tempo
4.2.1. Pattern
4.2.2. Meter
4.2.3. Tempo
4.3. Specific Mechanisms for Melody
4.4. General Discussion
4.5. Motor-Sensory Representations
4.6. Cerebellum
5. Conclusions
Acknowledgments
Author Contributions
Conflicts of Interest
References
- Koelsch, S. Toward a neural basis of music perception—A review and updated model. Front. Psychol. 2011, 2, 110. [Google Scholar] [CrossRef]
- McDermott, J.; Hauser, M. The Origins of Music: Innateness, Uniqueness, and Evolution. Music Perception 2005, 23, 29–59. [Google Scholar] [CrossRef]
- Desain, P.; Windsor, L. Rhythm: Perception and Production; Swets & Zeitlinger: Lisse, The Netherlands, 2000. [Google Scholar]
- Hallam, S.; Cross, I.; Thaut, M. Oxford Handbook of Music Psychology; Oxford University Press: Oxford, UK, 2009. [Google Scholar]
- Alluri, V.; Toivianinen, P.; Jaaskelainen, I.P.; Glerean, E.; Sams, M.; Brattico, E. Large—Scale brain networks emerge from dynamic processing of musical timbre, key, and rhythm. NeuroImage 2012, 59, 3677–3689. [Google Scholar] [CrossRef]
- Fujisawa, T.X.; Cook, N.D. The perception of harmonic triads: An fMRI study. Brain Imaging Behav. 2011, 5, 109–125. [Google Scholar] [CrossRef]
- Garza Villarreal, E.A.; Brattico, E.; Leino, S.; Ostergaard, L.; Vuust, P. Distinct neural responses to chord violations: A multiple source analysis study. Brain Res. 2011, 1389, 103–114. [Google Scholar]
- Klein, M.E.; Zatorre, R.J. A role for the right superior temporal sulcus in categorical perception of musical chords. Neuropsychologia 2011, 49, 878–887. [Google Scholar] [CrossRef]
- Lee, Y.S.; Janata, P.; Frost, C.; Hanke, M.; Granger, R. Investigation of melodic contour processing in the brain using multivariate pattern-based fMRI. NeuroImage 2011, 57, 293–300. [Google Scholar] [CrossRef]
- Parsons, L.M.; Petacchi, A.; Schmahmann, J.D.; Bower, J.M. Pitch discrimination in cerebellar patients: Evidence for a sensory deficit. Brain Res. 2009, 1303, 84–96. [Google Scholar] [CrossRef]
- Kohlmetz, C.; Muller, S.V.; Nager, W.; Munte, T.F.; Altenmuller, E. Selective loss of timbre perception for keyboard and percussion instruments following a right temporal lesion. Neurocase 2003, 9, 86–93. [Google Scholar] [CrossRef]
- Peretz, I.; Zatorre, R.J. Brain organisation for music processing. Annu. Rev. Psychol. 2005, 56, 89–114. [Google Scholar] [CrossRef]
- Stewart, L.; von Kriegstein, K.; Warren, J.D.; Griffiths, T.D. Music and the brain: Disorders of musical listening. Brain 2006, 129, 2533–2553. [Google Scholar] [CrossRef]
- Grube, M.; Cooper, F.E.; Chinnery, P.F.; Griffiths, T.D. Dissociation of duration-based and beat-based auditory timing in cerebellar degeneration. Proc. Natl. Acad. Sci. USA 2010, 107, 11597–11601. [Google Scholar] [CrossRef]
- Teki, S.; Grube, M.; Kumar, S.; Griffiths, T.D. Distinct neural substrates of duration-based and beat-based auditory timing. J. Neurosci. 2011, 31, 3805–3812. [Google Scholar] [CrossRef]
- Yeston, M. The Stratification of Musical Rhythm; Yale University Press: New Haven, CT, USA, 1976. [Google Scholar]
- Fitch, W.T. Rhythmic cognition in humans and animals: Distinguishing meter and pulse perception. Front. Syst. Neurosci. 2013, 7, 68. [Google Scholar] [CrossRef]
- White, J.D. The Analysis of Music; Prentice Hall: Upper saddle River, NJ, USA, 1976. [Google Scholar]
- Platel, H.; Price, C.; Baron, J.; Wise, R.; Lambert, J.; Frackowiak, R.S.J.; Lechevalier, B.; Eustache, F. The structural components of music perception. A functional anatomical study. Brain 1997, 120, 229–243. [Google Scholar] [CrossRef]
- Chen, J.L.; Penhune, V.B.; Zatorre, R.J. Listening to Musical Rhythms Recruits Motor Regions of the Brain. Cereb. Cortex 2008, 18, 2844–2854. [Google Scholar] [CrossRef]
- Bengtsson, S.L.; Ullén, F.; Ehrsson, H.H.; Hashimoto, T.; Kito, T.; Naito, E.; Forssberg, H.; Sadato, N. Listening to rhythms activates motor and pre-motor cortex. Cortex 2009, 45, 62–71. [Google Scholar] [CrossRef]
- Kornysheva, K.; von Cramon, D.Y.; Jacobsen, T.; Schubotz, R.I. Tuning-in to the Beat: Aesthetic Appreciation of Musical Rhythms Correlates with a Premotor Activity Boost. Hum. Brain Mapp. 2010, 31, 48–64. [Google Scholar]
- Grahn, J.A.; McAuley, J.D. Neural bases of individual differences in beat perception. NeuroImage 2009, 47, 1894–1903. [Google Scholar] [CrossRef]
- Limb, C.J.; Kemeny, S.; Ortgoza, E.; Rouhani, S.; Braun, A.R. Left hemispheric lateralization of brain activity during passive rhythm perception in musicians. Anat. Rec. A Discov. Mol. Cell. Evol. Biol. 2006, 288, 382–389. [Google Scholar]
- Chapin, H.L.; Zanto, T.; Jantzen, K.J.; Kelso, S.; Steinberg, F.; Large, E.W. Neural responses to complex auditory rhythms: The role of attending. Front. Psychol. 2010, 1, 224. [Google Scholar] [CrossRef]
- Rao, S.M.; Mayer, A.R.; Harrington, D.L. The evolution of brain activation during temporal processing. Nat. Neurosci. 2001, 4, 317–323. [Google Scholar] [CrossRef]
- Grahn, J.A.; Rowe, J.B. Finding and feeling the musical beat: Striatal dissociations between detection and prediction of regularity. Cereb. Cortex 2013, 23, 913–921. [Google Scholar] [CrossRef]
- Seger, C.A.; Spiering, B.J.; Sares, A.G.; Quraini, S.I.; Alpeter, C.; David, J.; Thaut, M.H. Corticostriatal contributions to musical expectancy perception. J. Cogn. Neurosci. 2013, 25, 1062–1077. [Google Scholar] [CrossRef]
- Coull, J.T.; Nobre, A.C. Dissociating explicit timing from temporal expectation with fMRI. Curr. Opin. Neurobiol. 2008, 18, 137–144. [Google Scholar] [CrossRef]
- Coull, J.T. Neural substrates of mounting temporal expectation. PLoS Biol. 2009, 7, e1000166. [Google Scholar] [CrossRef]
- Lewis, P.; Miall, R. Brain activation patterns during measurement of sub- and supra-second intervals. Neuropsychologia 2003, 41, 1583–1592. [Google Scholar] [CrossRef]
- Smith, A.; Taylor, E.; Lidzba, K.; Rubia, K. A right hemispheric frontocerebellar network for time discrimination of several hundreds of milliseconds. NeuroImage 2003, 20, 344–350. [Google Scholar] [CrossRef]
- Tecchio, F.; Salustri, C.; Thaut, M.H.; Pasqualetti, P.; Rossini, P.M. Conscious and preconscious adaptation to rhythmic auditory stimuli: A magnetoencephalographic study of human brain responses. Exp. Brain Res. 2000, 135, 222–230. [Google Scholar]
- Peretz, I.; Kolinsky, R. Boundaries of separability between melody and rhythm in music discrimination: A neuropsychological perspective. Q. J. Exp. Psychol. A 1993, 46, 301–325. [Google Scholar] [CrossRef]
- Foxton, J.M.; Nandy, R.K.; Griffiths, T.D. Rhythm deficits in “tone deafness”. Brain Cogn. 2006, 62, 24–29. [Google Scholar] [CrossRef]
- Povel, D.J.; Essens, P. Perception of temporal patterns. Music Percept. 1985, 2, 411–440. [Google Scholar] [CrossRef]
- Peretz, I. Processing of local and global musical information by unilateral brain-damaged patients. Brain 1990, 113, 1185–1205. [Google Scholar] [CrossRef]
- Di Pietro, M.; Laganaro, M.; Leemann, B.; Schnider, A. Receptive amusia: Temporal auditory processing deficit in a professional musician following a left temporo-parietal lesion. Neuropsychologia 2004, 42, 868–877. [Google Scholar] [CrossRef]
- Liégeois-Chauvel, C.; Peretz, I.; Babai, M.; Laguitton, V.; Chauvel, P. Contribution of different cortical areas in the temporal lobes to music processing. Brain 1998, 121, 1853–1867. [Google Scholar] [CrossRef]
- Geiser, E.; Zieglera, E.; Janckea, L.; Meyer, M. Early electrophysiological correlates of meter and rhythm processing in music perception. Cortex 2009, 45, 93–102. [Google Scholar] [CrossRef]
- Grahn, J.A.; Brett, M. Impairment of beat-based rhythm discrimination in Parkinson’s disease. Cortex 2009, 45, 56–61. [Google Scholar]
- Merchant, H.; Luciana, M.; Hooper, C.; Majestic, S.; Tuite, P. Interval timing and Parkinson’s disease: Heterogeneity in temporal performance. Exp. Brain Res. 2008, 184, 233–248. [Google Scholar]
- Schwartze, M.; Keller, P.E.; Patel, A.D.; Kotz, S.A. The impact of basal ganglia lesions on sensorimotor synchronization, spontaneous motor tempo, and the detection of tempo changes. Behav. Brain Res. 2010, 216, 685–691. [Google Scholar] [CrossRef]
- Harrington, D.L.; Haaland, K.Y.; Knight, R.T. Cortical networks underlying mechanisms of time perception. J. Neurosci. 1998, 18, 1085–1095. [Google Scholar]
- Wencil, E.B.; Radoeva, P.; Chatterjee, A. Size isn’t all that matters: Noticing differences in size and temporal order. Front. Hum. Neurosci. 2010, 2009. [Google Scholar] [CrossRef]
- Ivry, R.B.; Spencer, R.M.; Zelaznik, H.N.; Diedrichsen, J. The cerebellum and event timing. Ann. N. Y. Acad. Sci. 2002, 978, 302–317. [Google Scholar] [CrossRef]
- Harrington, D.L.; Lee, R.R.; Boyd, L.A.; Rapcsak, S.Z.; Knight, R.T. Does the representation of time depend on the cerebellum: Effect of cerebellar stroke. Brain 2004, 127, 561–574. [Google Scholar]
- Harrington, D.L.; Lee, R.R.; Boyd, L.A.; Rapcsak, S.Z.; Knight, R.T. Reply to: Evaluating the role of the cerebellum in temporal processing: Beware of the null hypothesis. Brain 2004, 127, e14. [Google Scholar] [CrossRef]
- Honing, H. Structure and interpretation of rhythm and timing. Tijdschr. Muziektheorie 2002, 7, 227–232. [Google Scholar]
- Lester, J. The Rhythms of Tonal Music; Southern Illinois University Press: Carbondale, IL, USA, 1986. [Google Scholar]
- Gaab, N.; Schlaug, G. The effect of musicianship on pitch memory in performance matched groups. NeuroReport 2003, 14, 2291–2295. [Google Scholar] [CrossRef]
- Seashore, C.E. The Psychology of Music; McGraw-Hill: New York, NY, USA, 1938. [Google Scholar]
- Gordon, E.E. Musical Aptitude Profile; GIA Publications: Chicago, IL, USA, 1995. [Google Scholar]
- Jenkinson, M.; Bannister, P.R.; Brady, J.M.; Smith, S.M. Improved optimization for the robust and accurate linear registration and motion correction of brain images. NeuroImage 2002, 17, 825–841. [Google Scholar] [CrossRef]
- Smith, S.M. Fast robust automated brain extraction. Hum. Brain Mapp. 2002, 17, 143–155. [Google Scholar] [CrossRef]
- Woolrich, M.W.; Ripley, B.D.; Brady, J.M.; Smith, S.M. Temporal autocorrelation in univariate linear modelling of FMRI data. NeuroImage 2001, 14, 1370–1386. [Google Scholar] [CrossRef]
- Worsley, K.J.; Evans, A.C.; Marrett, S.; Neelin, A. A three dimensional statistical analysis for CBF activation studies in human brain. J. Cereb. Blood Flow Metab. 1992, 12, 900–918. [Google Scholar] [CrossRef]
- Ramnani, N.; Owen, A.M. Anterior prefrontal cortex: Insights into function from anatomy and neuroimaging. Nat. Rev. Neurosci. 2004, 5, 184–194. [Google Scholar]
- Tanaka, S.; Honda, M.; Sadato, N. Modality-Specific Cognitive Function of Medial and Lateral Human Brodmann Area 6. J. Neurosci. 2005, 25, 496–450. [Google Scholar] [CrossRef]
- Bengtsson, S.L.; Ullen, F. Dissociation between melodic and rhythmic processing during piano performance from musical scores. NeuroImage 2006, 30, 272–284. [Google Scholar] [CrossRef]
- Sakai, K.; Hikosaka, O.; Miyauchi, S.; Takino, R.; Tamada, T.; Iwata, N.K.; Nielsen, M. Neural representation of a rhythm depends on its interval ratio. J. Neurosci. 1999, 19, 10074–10081. [Google Scholar]
- Koechlin, E.; Basso, G.; Pietrini, P.; Panzer, S.; Grafman, J. The role of the anterior prefrontal cortex in human cognition. Nature 1999, 399, 148–151. [Google Scholar] [CrossRef]
- Van den Heuvel, O.H.; Groenewegen, H.J.; Barkhof, F.; Lazeron, R.H.; van Dyck, R.; Veltman, D.J. Frontostriatal system in planning complexity: A parametric functional magnetic resonance version of Tower of London task. NeuroImage 2003, 18, 367–374. [Google Scholar] [CrossRef]
- Carter, C.S.; Braver, T.S.; Barch, D.M.; Botvinick, M.M.; Noll, D.; Cohen, J.D. Anterior cingulate cortex, error detection, and the online monitoring of performance. Science 1998, 280, 747–749. [Google Scholar] [CrossRef]
- Brown, J.W.; Braver, T.S. Learned predictions of error likelihood in the anterior cingulate cortex. Science 2005, 307, 1118–1121. [Google Scholar] [CrossRef]
- Alain, C.; Shen, D.; Yu, H.; Grady, C. Dissociable memory- and response-related activity in parietal cortex during auditory spatial working memory. Front. Psychol. 2010, 1, 202. [Google Scholar] [CrossRef]
- Koenigs, M.; Barbey, A.K.; Postle, B.R.; Grafman, J. Superior Parietal Cortex Is Critical for the Manipulation of Information in Working Memory. J. Neurosci. 2009, 29, 14980–14986. [Google Scholar] [CrossRef]
- Craig, A.D. How do you feel—now? The anterior insula and human awareness. Nat. Rev. Neurosci. 2009, 10, 59–70. [Google Scholar] [CrossRef]
- Gu, X.; Liu, X.; Guise, K.G.; Naidich, T.P.; Hof, P.R.; Fan, J. Functional Dissociation of the Frontoinsular and Anterior Cingulate Cortices in Empathy for Pain. J. Neurosci. 2010, 30, 3739–3744. [Google Scholar] [CrossRef]
- Critchley, H.D.; Wiens, S.; Rotshtein, P.; Ohman, A.; Dolan, R.J. Neural systems supporting interoceptive awareness. Nat. Neurosci. 2004, 7, 189–195. [Google Scholar] [CrossRef]
- Blood, A.J.; Zatorre, R.J. Intensely pleasurable responses to music correlate with activity in brain regions implicated in reward and emotion. Proc. Natl. Acad. Sci. USA 2001, 98, 11818–11823. [Google Scholar] [CrossRef]
- Riecker, A.; Wildgruber, D.; Dogil, G.; Grodd, W.; Ackermann, H. Hemispheric lateralization effects of rhythm implementation during syllable repetitions: An fMRI study. NeuroImage 2002, 16, 169–176. [Google Scholar]
- Bamiou, D.E.; Musiek, F.E.; Stow, I.; Stevens, J.; Cipolotti, L.; Brown, M.M.; Luxon, L.M. Auditory temporal processing deficits in patients with insular stroke. Neurology 2006, 67, 614–619. [Google Scholar] [CrossRef]
- Petacchi, A.; Laird, A.R.; Fox, P.T.; Bower, J.M. Cerebellum and Auditory Function: An ALE Meta-Analysis of Functional Neuroimaging Studies. Hum. Brain Mapp. 2005, 25, 118–128. [Google Scholar] [CrossRef]
- Stoodley, C.J.; Schmahmann, J.D. Functional topography in the human cerebellum: A meta-analysis of neuroimaging studies. NeuroImage 2009, 44, 489–501. [Google Scholar] [CrossRef]
- Petacchi, A.; Kaernbach, C.; Ratnam, R.; Bower, J.M. Increased activation of the human cerebellum during pitch discrimination: A positron emission tomography (PET) study. Hear. Res. 2011, 28, 35–48. [Google Scholar]
- Groussard, M.; La Joie, R.; Rauchs, G.; Landeau, B.; Chételat, G.; Viader, F.; Desgranges, B.; Eustache, F.; Platel, H. When Music and Long-Term Memory Interact: Effects of Musical Expertise on Functional and Structural Plasticity in the Hippocampus. PLoS One 2010, 5, e13225. [Google Scholar] [CrossRef]
- Hoppin, R.H. Medieval Music; W.W. Norton & Co.: New York, NY, USA, 1978. [Google Scholar]
- Chong, J.J.T.; Cunnington, R.; Williams, M.A.; Kanwisher, N.; Mattingley, J.B. fMRI Adaptation Reveals Mirror Neurons in Human Inferior Parietal Cortex. Curr. Biol. 2008, 18, 1576–1580. [Google Scholar] [CrossRef]
- Volz, K.G.; Schubotz, R.I.; von Cramon, D.Y. Variants of uncertainty in decision-making and their neural correlates. Brain Res. Bull. 2005, 67, 403–412. [Google Scholar] [CrossRef]
- Stern, E.R.; Gonzalez, R.; Welsh, R.C.; Taylor, S.F. Updating Beliefs for a Decision: Neural Correlates of Uncertainty and Underconfidence. J. Neurosci. 2010, 30, 8032–8041. [Google Scholar] [CrossRef]
- Gaab, N.; Gaser, C.; Zaehle, L.; Jancke, L.; Schlaug, G. Functional anatomy of pitch memory—An fMRI study with sparse temporal sampling. NeuroImage 2003, 19, 1417–1426. [Google Scholar] [CrossRef]
- Fujioka, T.; Zendel, B.R.; Ross, B. Endogenous Neuromagnetic Activity for Mental Hierarchy of Timing. J. Neurosci. 2010, 30, 3458–3466. [Google Scholar] [CrossRef]
- Remedios, R.; Logothetis, N.K.; Kayser, C. Unimodal Responses Prevail within the Multisensory Claustrum. J. Neurosci. 2010, 30, 12902–12907. [Google Scholar] [CrossRef]
- Schmahmann, J.D. The Cerebellum and Cognition; Schmahmann, J.D., Ed.; Academic Press: New York, NY, USA, 1997. [Google Scholar]
- O’Reilly, J.X.; Beckmann, C.F.; Tomassini, V.; Ramnani, N.; Johansen-Berg, H. Distinct and overlapping functional zones in the cerebellum defined by resting state functional connectivity. Cereb. Cortex 2010, 20, 953–965. [Google Scholar] [CrossRef]
- Ivry, R.B.; Fiez, J.A. Cerebellar contributions to cognition and imagery. In The New Cognitive Neurosciences, 2nd ed.; Gazzaniga, M.S., Ed.; MIT Press: Cambridge, MA, USA, 2000; pp. 999–1011. [Google Scholar]
- Ivry, R.B.; Schlerf, J.E. Dedicated and intrinsic models of time perception. Trends Cogn. Sci. 2008, 12, 273–280. [Google Scholar] [CrossRef]
- Hallett, M.; Grafman, J. Executive function and motor skill learning. In The Cerebellum and Cognition; Schmahmann, J.D., Ed.; Academic Press: New York, NY, USA, 1997; pp. 297–324. [Google Scholar]
- Kalashnikova, L.A.; Zueva, Y.V.; Pugacheva, O.V.; Korsakova, N.K. Cognitive impairments in cerebellar infarcts. Neurosci. Behav. Psychol. 2005, 35, 773–779. [Google Scholar] [CrossRef]
- Molinari, M.; Leggio, M.G.; Filippini, V.; Gioia, M.C.; Cerasa, A.; Thaut, M.H. Sensorimotor transduction of time information is preserved in subjects with cerebellar damage. Brain Res. Bull. 2005, 67, 448–458. [Google Scholar] [CrossRef]
- Molinari, M.; Chiricozzi, F.; Clausi, S.; Tedesco, A.; De Lisa, M.; Leggio, M. Cerebellum and detection of sequences, from perception to cognition. Cerebellum 2008, 7, 611–615. [Google Scholar] [CrossRef]
- Miall, R.C. Sequences of sensory predictions. Behav. Brain Sci. 1997, 20, 258–259. [Google Scholar] [CrossRef]
- Garraux, G.; McKinney, C.; Wu, T.; Kansaku, K.; Nolte, G.; Hallett, M. Shared Brain Areas But Not Functional Connections Controlling Movement Timing and Order. J. Neurosci. 2005, 25, 5290–5297. [Google Scholar] [CrossRef]
- Turner, B.; Paradiso, S.; Marvel, C.; Pierson, R.; Ponto, L.B.; Hichwa, R.; Robinson, R. The cerebellum and emotional experience. Neuropsychologia 2007, 45, 1331–1341. [Google Scholar] [CrossRef]
- Schmahmann, J.D.; Sherman, J.C. The cerebellar cognitive affective syndrome. Brain 1998, 121, 561–579. [Google Scholar] [CrossRef]
- Krienen, F.N.; Buckner, R.L. Segregated Fronto-Cerebellar Circuits Revealed by Intrinsic Functional Connectivity. Cereb. Cortex 2009, 19, 2485–2497. [Google Scholar] [CrossRef]
- Habas, C.; Kamdar, N.; Nguyen, D.; Prater, K.; Beckmann, C.F.; Menon, V.; Greicius, M.D. Distinct Cerebellar Contributions to Intrinsic Connectivity Networks. J. Neurosci. 2009, 29, 8586–8594. [Google Scholar] [CrossRef]
© 2014 by the authors; licensee MDPI, Basel, Switzerland. This article is an open access article distributed under the terms and conditions of the Creative Commons Attribution license (http://creativecommons.org/licenses/by/3.0/).
Share and Cite
Thaut, M.H.; Trimarchi, P.D.; Parsons, L.M. Human Brain Basis of Musical Rhythm Perception: Common and Distinct Neural Substrates for Meter, Tempo, and Pattern. Brain Sci. 2014, 4, 428-452. https://doi.org/10.3390/brainsci4020428
Thaut MH, Trimarchi PD, Parsons LM. Human Brain Basis of Musical Rhythm Perception: Common and Distinct Neural Substrates for Meter, Tempo, and Pattern. Brain Sciences. 2014; 4(2):428-452. https://doi.org/10.3390/brainsci4020428
Chicago/Turabian StyleThaut, Michael H., Pietro Davide Trimarchi, and Lawrence M. Parsons. 2014. "Human Brain Basis of Musical Rhythm Perception: Common and Distinct Neural Substrates for Meter, Tempo, and Pattern" Brain Sciences 4, no. 2: 428-452. https://doi.org/10.3390/brainsci4020428