Division of Biology, Department of Earth System Science, Fukuoka University, Fukuoka, Japan
The afferents of the Johnston’s organ (JO) in the honeybee brain send their axons to three distinct areas, the dorsal lobe, the dorsal subesophageal ganglion (DL-dSEG), and the posterior protocerebral lobe (PPL), suggesting that vibratory signals detected by the JO are processed differentially in these primary sensory centers. The morphological and physiological characteristics of interneurons arborizing in these areas were studied by intracellular recording and staining. DL-Int-1 and DL-Int-2 have dense arborizations in the DL-dSEG and respond to vibratory stimulation applied to the JO in either tonic excitatory, on-off-phasic excitatory, or tonic inhibitory patterns. PPL-D-1 has dense arborizations in the PPL, sends axons into the ventral nerve cord (VNC), and responds to vibratory stimulation and olfactory stimulation simultaneously applied to the antennae in long-lasting excitatory pattern. These results show that there are at least two parallel pathways for vibration processing through the DL-dSEG and the PPL. In this study, Honeybee Standard Brain was used as the common reference, and the morphology of two types of interneurons (DL-Int-1 and DL-Int-2) and JO afferents was merged into the standard brain based on the boundary of several neuropiles, greatly supporting the understanding of the spatial relationship between these identified neurons and JO afferents. The visualization of the region where the JO afferents are closely appositioned to these DL interneurons demonstrated the difference in putative synaptic regions between the JO afferents and these DL interneurons (DL-Int-1 and DL-Int-2) in the DL. The neural circuits related to the vibration-processing interneurons are discussed.
Honeybees communicate with each other for the benefit of the whole society. One of the most intriguing forms of communication is the waggle dance: a dancing bee sends a message to other bees indicating the direction and distance from their hive to a site of nectar-bearing flowers. Karl von Frisch showed that bees are recruited by the waggle dance of their nestmates and that information encoded by the waggle dance guides them to a remote food source (Frisch, 1967
). This finding was recently proved directly by following the flight paths of recruited bees using harmonic radar recording (Riley et al., 2005
). Ethological studies on waggle-dance communication have suggested that the flower odor and airborne vibration generated by both abdomen waggling and wing vibration are important cues in dance communication (Michelsen et al., 1992
; Dreller and Kirchner, 1993a
; Michelsen, 2003
; Farina et al., 2005
). Behavioral experiments demonstrated that honeybees can detect air-particle movements with the Johnston’s organ (JO) located at the second segment (pedicel) of the antenna (Figure 1
; Towne and Kirchner, 1989
; Kirchner et al., 1991
; Dreller and Kirchner, 1993b
). Sensory neurons in the JO transduce mechanical vibration of the flagellum (the third antennal segment) into neural excitation. The antenna and sensory neurons in the JO are specialized for detecting vibrations with frequencies in the range of 250–300 Hz, which is the normal range of the main vibration frequencies generated by the waggle dance (Tsujiuchi et al., 2007
). The JO has also been suggested to play a role in detecting air current during flight (Srinivasan and Zhang, 2004
).
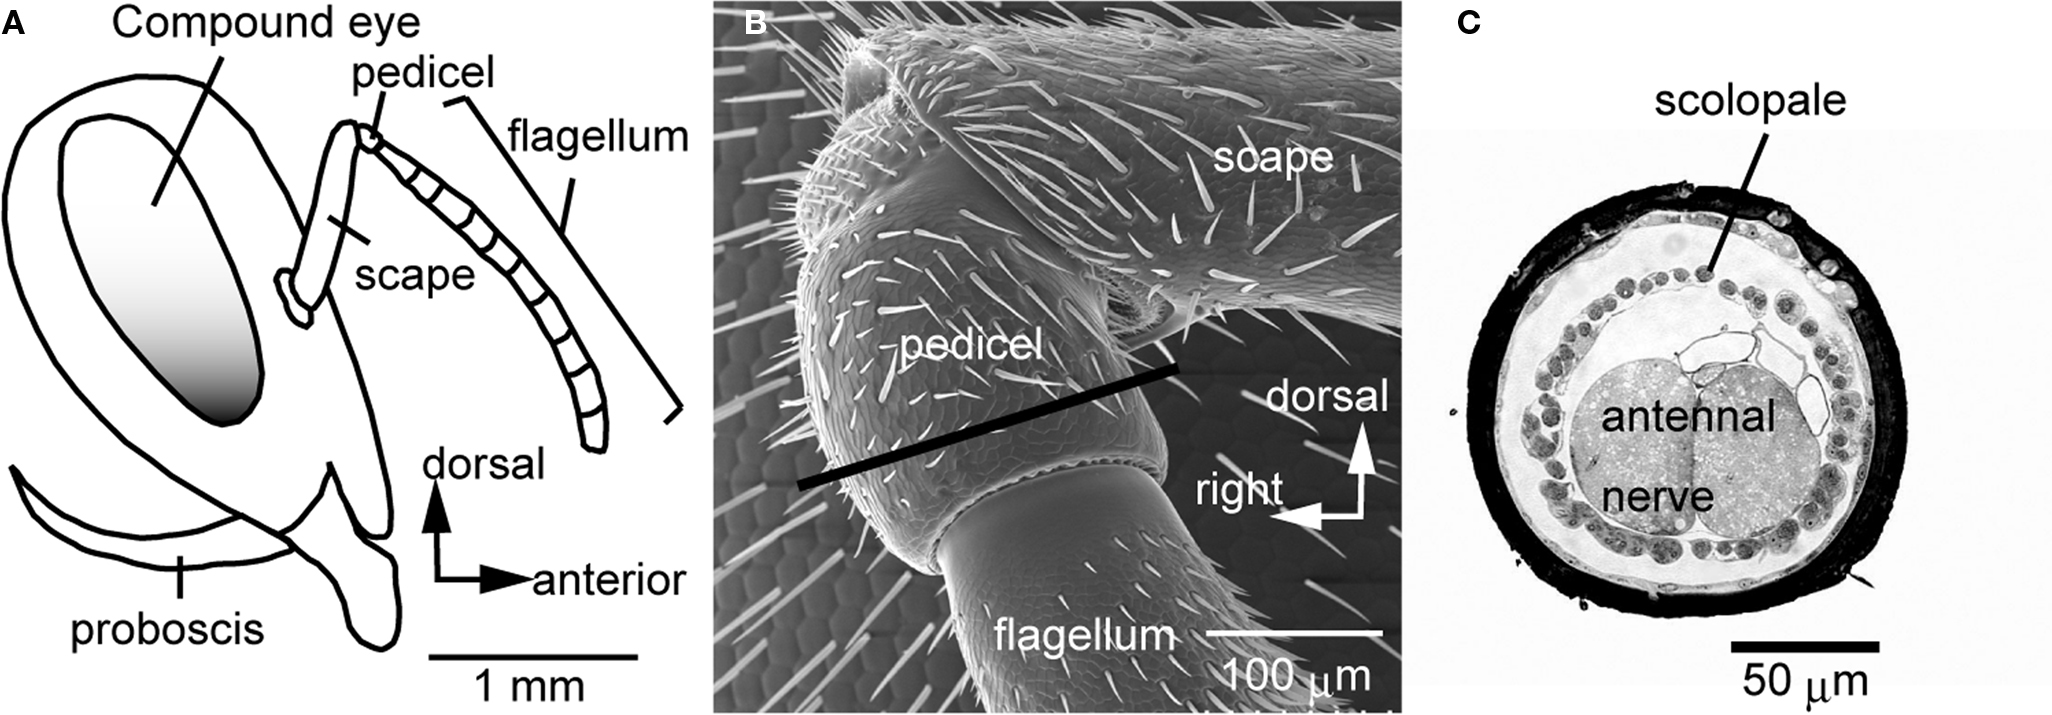
Figure 1. The Johnston’s organ of the honeybee. (A) A lateral view of the head of the honeybee. The antenna is composed of the scape, pedicel, and flagellum. The flagellum oscillates by air vibration. (B) Scanning electron microscopic image of the pedicel. (C) A transverse section of the pedicel at which the scolopales exist [at the region indicated by a line in (B)]. Each scolopale is a sensory unit of the Johnston’s organ. In the pedicel, scolopales are located around the antennal nerve. Modified from Ai et al. (2007)
.
On the other hand, three-dimensional visualization of the neurons, of the neuropile, and of the brain has been realized by confocal microscopic observation and visualization software, such as Amira (Mercury Computer Systems, San Diego, CA, USA). Evers et al. (2005)
developed the methods for making precise automatic geometric reconstruction of neuronal morphology from confocal image stacks. Moreover, Brandt et al. (2005)
produced the three-dimensional average-shape atlas of the honeybee brain. This Honeybee Standard Brain (HSB) permits an overview of the spatial relationship between the morphologies of different neurons in the brain. The neural correlates of vibratory stimuli have not been examined so far, and the neural pathways for encoding the vibratory message during dance communication have also remained elusive. In the present study, we successfully identified three types of interneurons that have dense arborizations in both the dorsal lobe (DL) and the dorsal subesophageal ganglion (dSEG) or the posterior protocerebral lobe (PPL) and that respond to vibratory stimulation applied to the JO in specific patterns. The response patterns suggest that there are at least two parallel pathways for the vibratory processing through the DL-dSEG and the PPL. The registration of our identified neurons into the HSB demonstrated the difference in putative synaptic regions between the JO afferents and these DL interneurons in the DL.
Preparation
Honeybees (Apis mellifera L.) were reared in hives placed on the Fukuoka University campus. Worker bees used in this study were caught at the hive entrance.
Anterograde Stainings of JO Afferents
To stain JO afferents specifically, a small region of the ventral cuticle of the pedicel (free from bristles, Figure 1
A) was removed with a razor blade. Then a small incision was made on cell bodies of JO, where a crystal of dextran-tetramethylrhodamine was placed. The preparations were kept for 48 h at 4°C. The success rate for obtaining complete staining of sensory afferents of interest was about 10%.
Intracellular Recording and Staining
The procedure followed is described in Ai et al. (2009)
. The bee was immobilized by cooling and mounted in an acrylic chamber. The bee in the chamber was fed with 1 M sucrose solution and kept overnight in the dark with high humidity at 20°C. The head of the bee was fixed with wax, and the frontal surface of the brain was exposed by cutting away a small rectangular window between the compound eyes. Then the glands and tracheal sheaths on top of the brain were removed. The mouthparts, including the mandibles, were cut off to expose the esophagus. Small droplets of bee physiological saline (in mM, 137 NaCl, 3 KCl, 1 CaCl2, 4 Na2HPO4, 2 KH2PO4, 100 sucrose, pH 6.7) were applied to wash away the residue in the esophagus and to enhance electrical contact with a platinum ground electrode placed in the head capsule next to the brain.
Borosilicate glass electrodes were pulled with a laser puller (P-2000, Sutter Instruments, Novato, CA, USA) and filled at the tip with 2% Alexa 568 hydrazide (Invitrogen, La Jolla, CA, USA; A10437) dissolved in 100 mM KCl, yielding DC resistances in the range of 150–300 MΩ. The electrode was inserted into the antennal lobe after the neural sheath and a small area of the brain’s neurilemma had been scratched. Electrical activities were recorded from neurons arborizing in either dSEG or DL. Electrical activities were amplified with an amplifier (MEZ 8301, Nihon Kohden, Tokyo, Japan) and displayed on an oscilloscope and a thermal-array recorder (RTA 1100M, Nihon Kohden, Tokyo, Japan). Data were stored on DAT tapes and then analyzed with a spike analyzer (Spike2, Cambridge Electronic Design, Cambridge, UK). Following recording of activities, the neurons were filled with Alexa 568 by applying a hyperpolarizing current (from 2 to 5 nA for 2–10 min). Thereafter, the brains were dissected out, immersed in 0.4% Lucifer yellow solution for 2 h, fixed in 4% paraformaldehyde for 4 h at room temperature, and then rinsed in phosphate buffer solution, dehydrated, and cleared in methyl salicylate for subsequent observation.
Confocal Microscopy
The cleared specimens containing backfilled or intracellularly stained neurons were viewed from the posterior side of the brain under a confocal laser-scanning microscope (LSM 510, Carl Zeiss, Jena, Germany) with a Zeiss Plan-Apochromat 10X/NA 0.45 dry lens objective (working distance, 2.1 mm) for low-magnified images or with a Zeiss Plan-Apochromat 20X/Na 0.8 dry lens objective (working distance, 0.55 mm) for high-magnified images. Both dextran-tetramethylrhodamine and Alexa 568 were excited by the 543-nm line of an HeNe laser, while Lucifer yellow was excited by the 488-nm line of an argon laser. Optical sections were made at 3 μm (in low-magnified image) or 1.5 μm (in high-magnified image) throughout the entire depth of each specimen. The image resolution was 1024 × 1024. Optical sections were reconstructed two dimensionally by using a software program provided by Zeiss. Adobe Illustrator was used to store and manipulate all photographs.
Three-Dimensional Reconstruction
The spatial relationship between the identified interneurons and JO afferents was examined using the following procedure. First, the neuronal profiles of stained JO afferents and interneurons DL-Int-1 and -II stemming from different preparations were reconstructed using the Amira 4.1 (Mercury Computer Systems, Inc, San Diego, CA, USA; Evers et al., 2005
). Subsequently, the neuropilar outlines were traced manually and segmented with the Amira 4.1 label field editor. These neuropilar label fields were used to register the segmented neurons in each preparation into the corresponding part of the HSB following the method described in Brandt et al. (2005)
. This registration process involves both affine transformations and elastic geometric deformations. The affine transformation matrixes and the deformations vector fields were applied to the segmented neurons, and thus these were fitted into the HSB. To identify possible synaptic regions between the JO afferents and each identified interneuron, Amira’s “surface distance” was used for calculating the distance of both neurons.
Sensory Stimulation
The experimental setup followed is described in Ai et al. (2009)
. First, both antennal scapes were fixed to the acrylic chamber with wax. For vibratory stimulation to the JO, the right antenna was inserted into a glass capillary (length, 10 mm; inner diameter of the tip, 200 μm) up to the second segment of the flagellum and then fixed to the tip of the capillary with wax. The opposite tip of the capillary was connected to the cone of a sound speaker (diameter of the cone, 60 mm). The sound speaker was driven by a wave generator (Multifunction generator 1945, NF Electronic Instruments, Yokohama, Japan). Continuous sine waves of frequency ranging from 10 to 400 Hz and vibration amplitude (peak to peak) ranging from 0 to 50 μm were applied.
For olfactory stimulations, fresh air was taken from outside through a diaphragm pump. The air was passed through a cotton filter, a charcoal filter, and then a silicon tube (inner diameter, 5 mm). The flow of air was controlled by a flow meter and kept at approximately 10 ml/s within the tube. The tube was then fed to a three-way solenoid valve that divided it into two tubes. One was used for a blank stimulus, and the other was further divided into five tubes, each of which was connected to a different cartridge so that five kinds of stimuli (orange oil, rose oil, citral, geraniol, and amyl acetate) could be applied separately. The cartridge for the blank stimulus and the five cartridges for odor stimuli converged onto the peripheral area of the air-delivery tube, which carried the continuous airflow over the antenna. One of the five odor stimuli was arbitrarily selected with a manually operated valve attached to each stimulus cartridge. The blank stimulus could be switched to one kind of olfactory stimulus by operating a solenoid-activated valve without changing the airflow. The tip of the air-delivery tube was positioned about 10 mm from the left antenna. The signals from the solenoid valve were stored on DAT tapes together with the simultaneously recorded neural activities. To keep the experimental environment clean, the air near the preparation was exhausted.
The light was turned off (less than 4 lux) during intracellular recording, except during visual stimulation. For visual stimulation, the light emitted from a halogen lamp of c.a. 500 lux with no filter was switched on and off by a self-made shutter.
Nomenclature
We referred to Mobbs (1982) and Milde (1988)
for the naming of neuropilar regions in the brain SEG complex. Orientation of neuronal structures is given according to the body axis.
Central Projections of JO Afferents
Axons originating from the JO project into the brain SEG through the sensory tracts T6I and T6II, and their projection areas are spatially segregated in the PPL and the DL and the dSEG (DL-dSEG), respectively (Ai et al., 2007
; Figures 2
A,B). JO afferents passing through T6I comprise thick axons with large varicosities in the PPL, while those passing through T6II comprise thin axons with small and diverse varicosities in both the DL-dSEG. These findings suggest that there are at least two parallel pathways for processing mechanosensory stimuli detected by the JO.
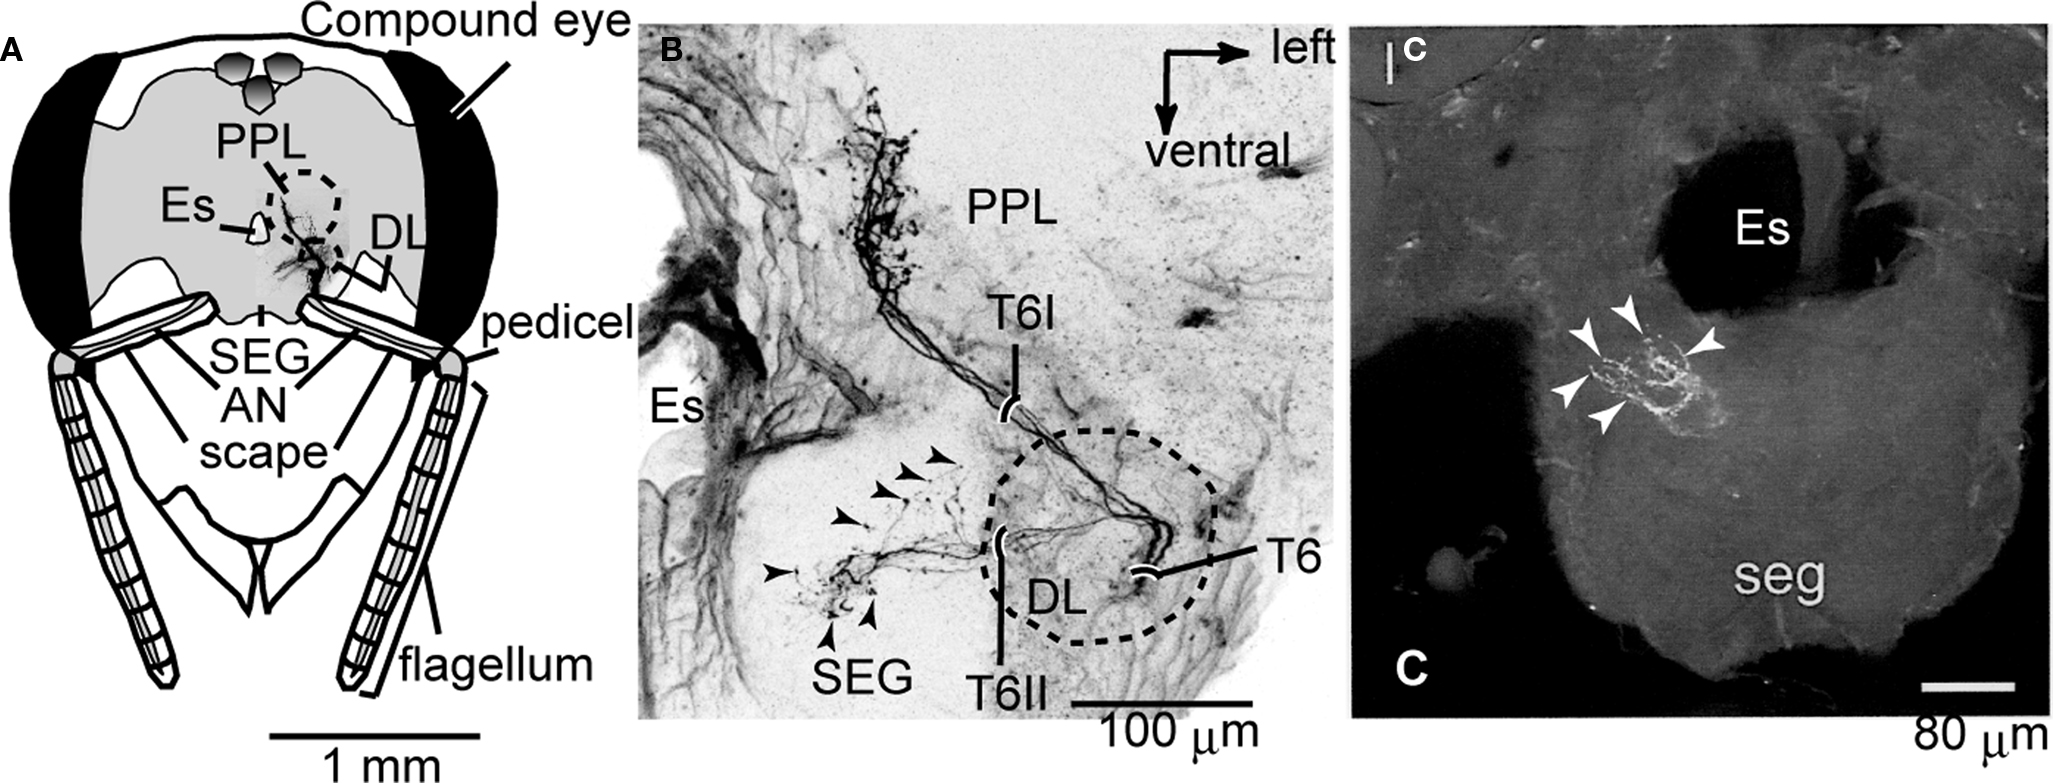
Figure 2. Central projection of the Johnston’s organ and neck hairs. (A) Brain-subesophageal ganglion (SEG) complex. The mechanosensory afferents on the antennae project into the dorsal lobe (DL), posterior protocerebral lobe (PPL), and SEG. (B) Central projection of the Johnston’s organ. Dextran-tetramethylrhodamine was injected into the ventral scolopales in the Johnston’s organ. The sensory afferents of T6I project to the PPL, and those of T6II project to the DL and dSEG. (C) Central projection of neck hairs in SEG. Arrowheads in (B) and (C) show the terminal varicosities in dSEG. lc, lateral calyx of mushroom body; Es, esophagus. (A) and (B) are modified from Ai et al. (2007)
; (C) is modified from Brockmann and Robinson (2007
).
Morphology and Physiology of Vibration-Sensitive Interneurons
Interneurons arborized in the primary sensory area of the JO were recorded intracellularly when the animal was stimulated by signals emitted from the dancer. Several unique interneurons were identified that arborized densely in either the DL-dSEG (Ai et al., 2009
) or the PPL and responded to vibratory stimulation applied to the JO in specific patterns. These interneurons have their somata in the protocerebrum (PC; n = 27), deutocerebrum (DC; n = 10), or SEG (n = 40). Most of these interneurons interconnect the protocerebral lobe, the DL, and the SEG, or subregions of these neuropils. Three types of interneurons can be distinguished: dorsal lobe interneuron type 1 (DL-Int-1; n = 8), dorsal lobe interneuron type 2 (DL-Int-2; n = 4), and posterior protocerebral lobe descending neuron type 1 (PPL-D-1; n = 3) neurons. DL-Int-1 and DL-Int-2 neurons respond to vibratory stimulation of the JO with an on–off phasic excitation, a tonic inhibition, or a tonic excitation. DL-Int-1 neurons respond to both olfactory and visual (light on) stimuli, while DL-Int-2 neurons do not respond to the olfactory and visual stimuli. PPL-D-1 neurons respond to the vibratory stimuli only during and after olfactory stimuli of the antenna. The PPL-D-1 neurons respond to the light stimuli.
DL-Int-1
The soma of DL-Int-1 is located on the dorsal rind of the PC. It gives rise to a single primary neurite just posterior to the central body below the mushroom body calyces (Figure 3
A). The primary neurite runs anteroventrally to the DL. Here, it splits into two secondary neurites, one of them having dense arborizations in the DL-dSEG and the other thin arborizations in the PPL (Figure 3
B). The arborizations in the PPL comprise a small number of fine spines, while those of the DL-dSEG possess not only fine spines but also blebs.
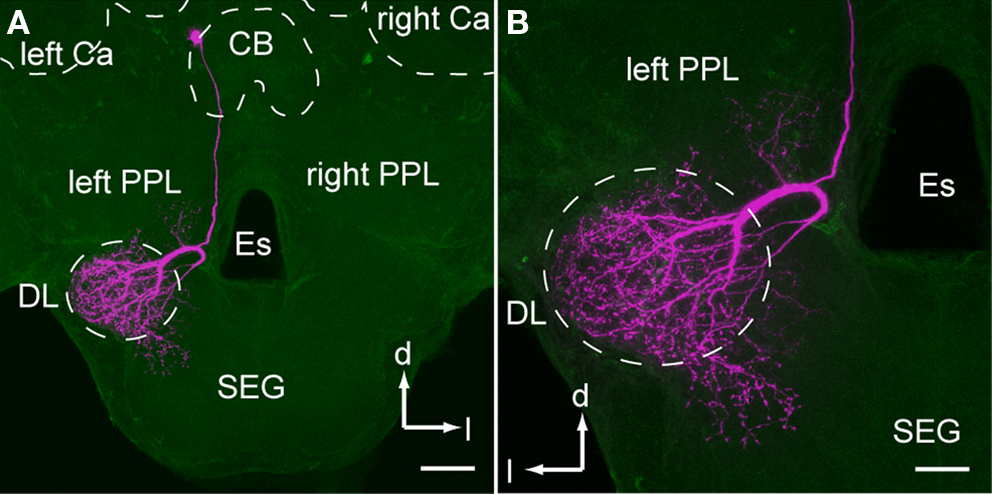
Figure 3. An example of dorsal lobe interneuron type 1 (DL-Int-1). (A) shows an entire dye-filled cell, and (B) depicts an enlarged view of the dorsal lobe arborization. (A) The soma of DL-Int-1 is located dorsally at the most posterior region of the protocerebral lobe close to the central body (CB). (B) DL-Int-1 arborizes densely in the dorsal lobe and dorsal subesophageal ganglion (DL-dSEG) and sends a small branch into the left posterior protocerebral lobe (PPL). Scale bar, 100 μm in (A); 50 μm in (B). Ca, calyx; d, dorsal; Es, esophagus; l, lateral; SEG, subesophageal ganglion. Modified from Ai et al. (2009)
.
To elucidate the spatial relationship between a DL-Int-1 and JO afferents, both DL-Int-1 and JO afferents were reconstructed three dimensionally using the method of tracing by Evers et al. (2005)
. Afterwards it was registered into the HSB (Figures 4
A, Brandt et al., 2005
). Because all preparations were counterstained with Lucifer yellow, the visualization of the neuropil borders was much improved, and the alignment for the registration process of neuropils was facilitated. The DL-Int-1 trifurcates at the medial region of the DL, close to the esophagus (Figures 4
B,C). These branches ramify densely in the DL (blue ramifications in Figures 4
B,C), dSEG (red ramification in Figures 4
B,C), and the PPL (green ramification in Figures 4
B,C). The JO afferents run close to the DL-Int-1 branches in the DL (blue ramifications in Figure 4
B; magenta in Figures 4
A,C,D), in the same region where the T6 of JO afferents bifurcates into T6I and T6II.
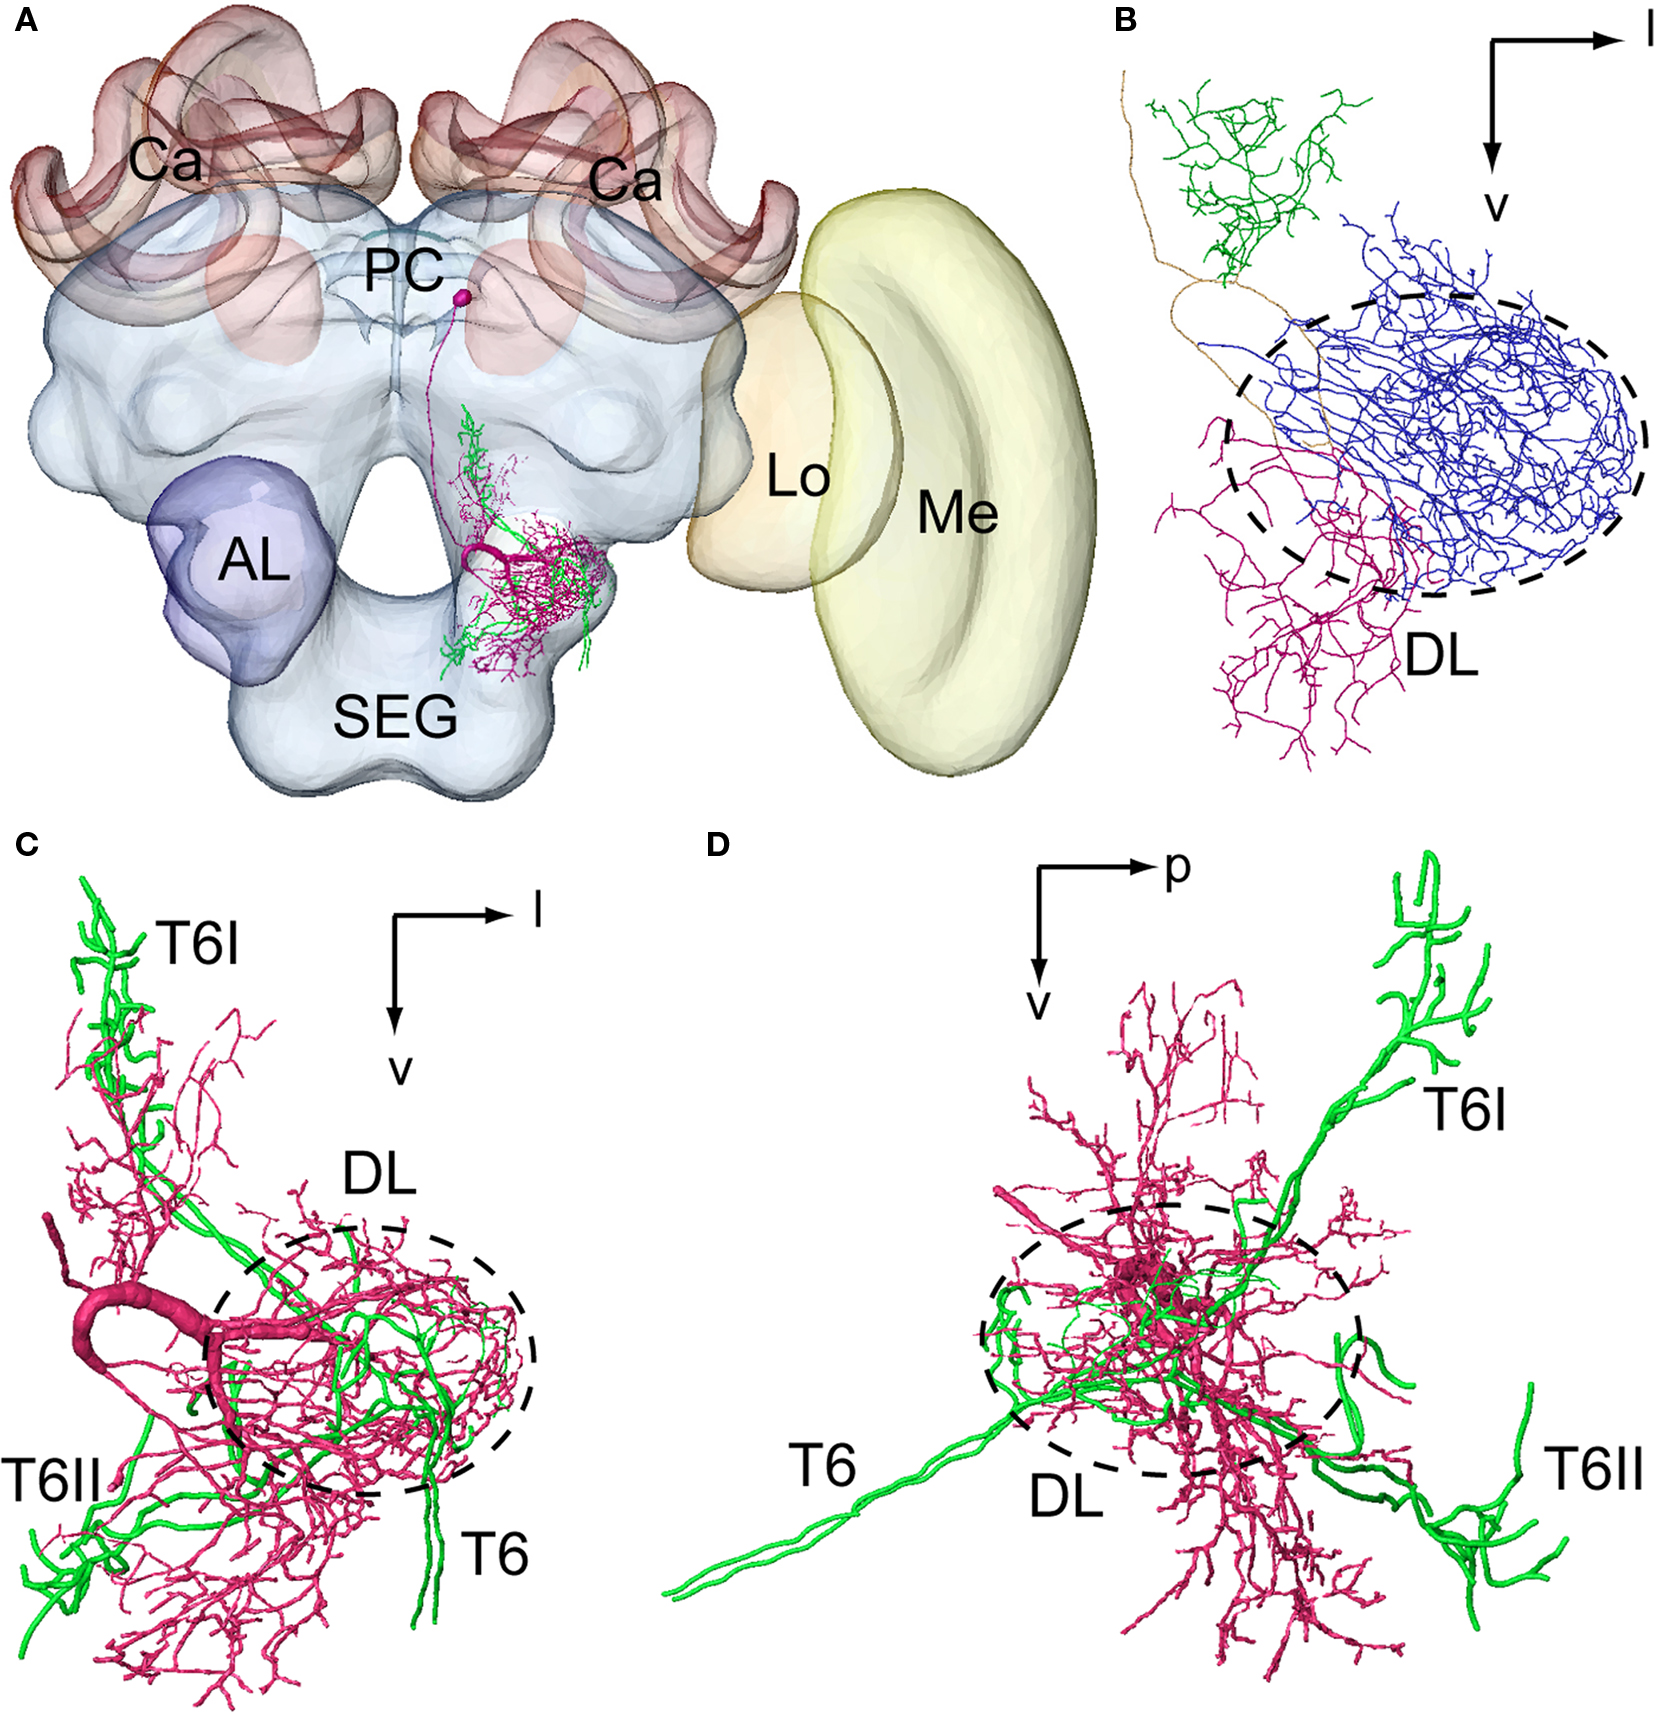
Figure 4. Spatial relationship between a DL-Int-1 neuron and the Johnston’s organ (JO) afferents stemming from two different specimens and registered into the standard brain of the honeybee. JO afferents in the antennal sensory tract T6 project to posterior target areas T6I and T6II. (A) shows a frontal view of a DL-Int-1 (magenta) and JO afferents (green) after registration into the Honeybee Standard Brain. (B) shows a frontal view of DL-Int-1 trifurcating into branches at the medial region of the dorsal lobe (DL, dotted circled line), close to the esophagus. These three branches ramify densely in the DL (blue ramifications), dSEG (red ramification), and PPL (green ramification). (C,D) Three-dimensional images of the arborizations of the DL-Int-1 (magenta) and JO afferents (green; (C) frontal view; (D) lateral view). Arborizations of the DL-Int-1 overlap with the terminal branches of the JO in the DL. l, lateral; p, posterior; v, ventral; Lo, lobula; Me, medulla. Modified from Ai et al. (2009)
.
DL-Int-1 neurons are spontaneously active and show on–off phase-locked excitations or tonic inhibition lasting for the entire stimulation period. However, the responses of DL-Int-1 depend on the spontaneous spike frequency, and because the neurons also respond to odor, the combination of odor and vibratory stimulation leads to complex response patterns (Ai et al., 2009
).
DL-Int-2
The soma of DL-Int-2 is located on the edge of the deutocerebrum (Figure 5
) and gives rise to a single primary neurite that arborizes in the posteromedial and anterior region of the DL comprising sparse ramifying axon collaterals projecting to the lateral DL. The primary neurite branches into three thick axons at the center of the DL (x, y, and z in Figure 5
A). One of the branches extends toward the anterior lateral protocerebral lobe where it terminates in many fine blebs (y, arrow in Figures 5 and 6
). The branch that extends toward the dSEG comprises extensive ramifications with numerous fine spines in both the DL and the dSEG (x, arrow in Figures 5 and 6
). Presumable synaptic boutons are present close to these spines. The remaining branch extends toward the lateral portion of the PPL and terminates here (z, arrow in Figures 5 and 6
). Presumable dendritic arbors of the DL-Int-2 are located close to the JO afferents in the DL (Figure 6
). The DL-Int-2 does not innervate the lateral horn of the protocerebral lobe.
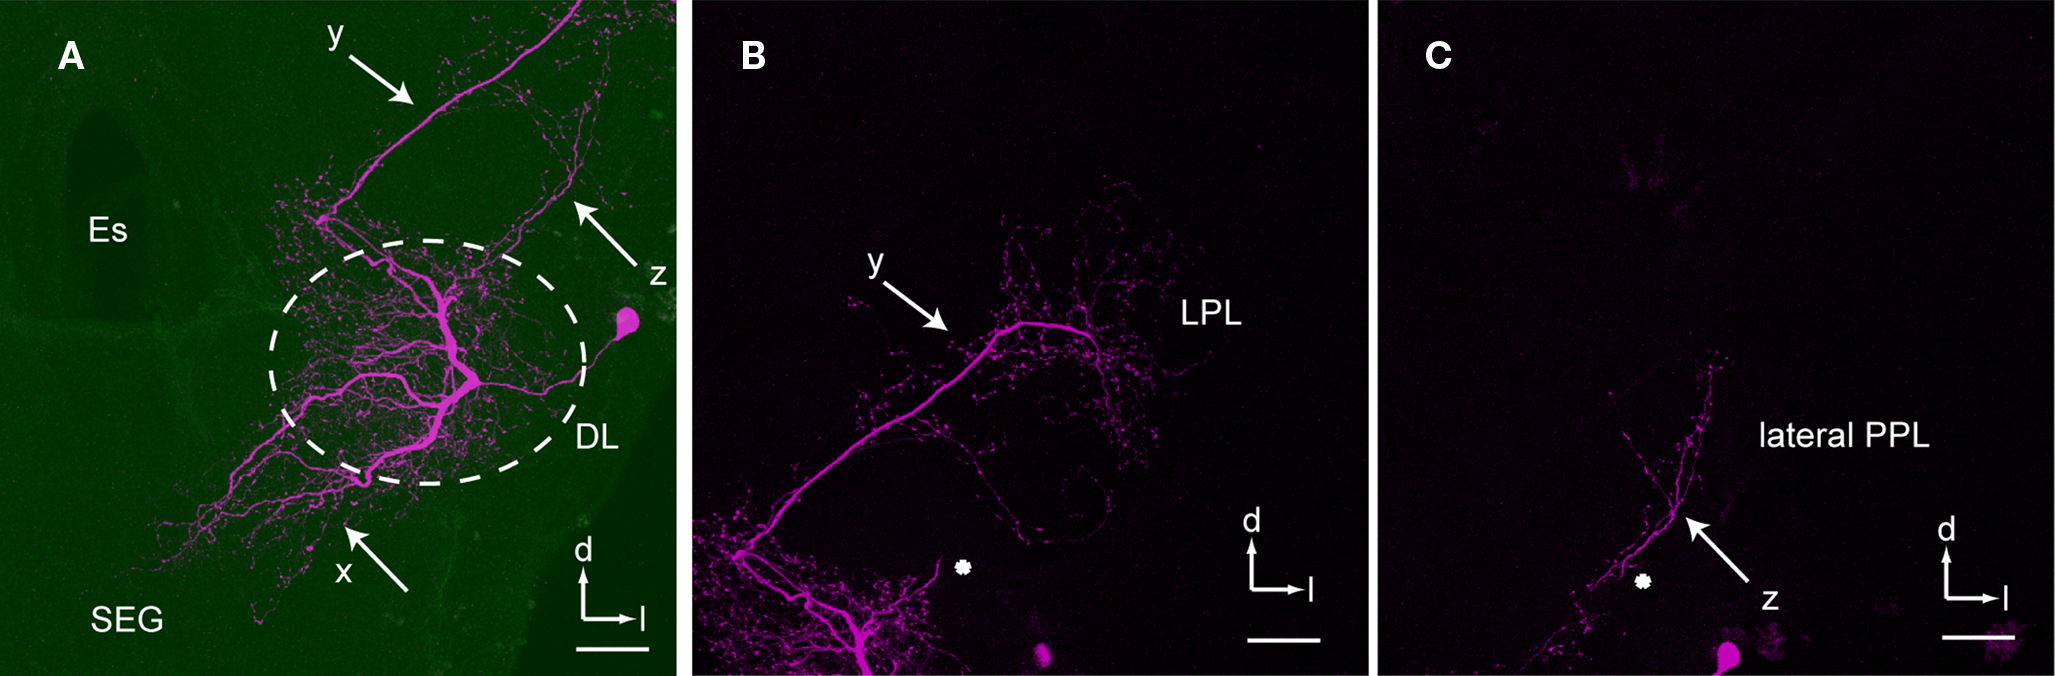
Figure 5. An example of dorsal lobe interneuron type 2 (DL-Int-2). (A) The soma is located in the posterolateral region of the dorsal lobe (DL). The neuron has three major ramifications (x, y, and z). The most strongly ramified arborizations (x) are distributed in the DL and dorsal subesophageal ganglion (SEG) with numerous fine spines. (B) A long process (y) terminates in the lateral protocerebral lobe (LPL) with fine blebs. (C) A small branch (z) emanates from the major DL branch and projects into the lateral portion of the posterior protocerebral lobe (lateral PPL). (B) and (C) show the composite images of the same serial sections in consecutively different depths [the position marked by an asterisk in (B) corresponds to that in (C)]. d, dorsal; Es, esophagus; l, lateral; PC, protocerebrum. Scale bars, 50 μm. Modified from Ai et al. (2009)
.
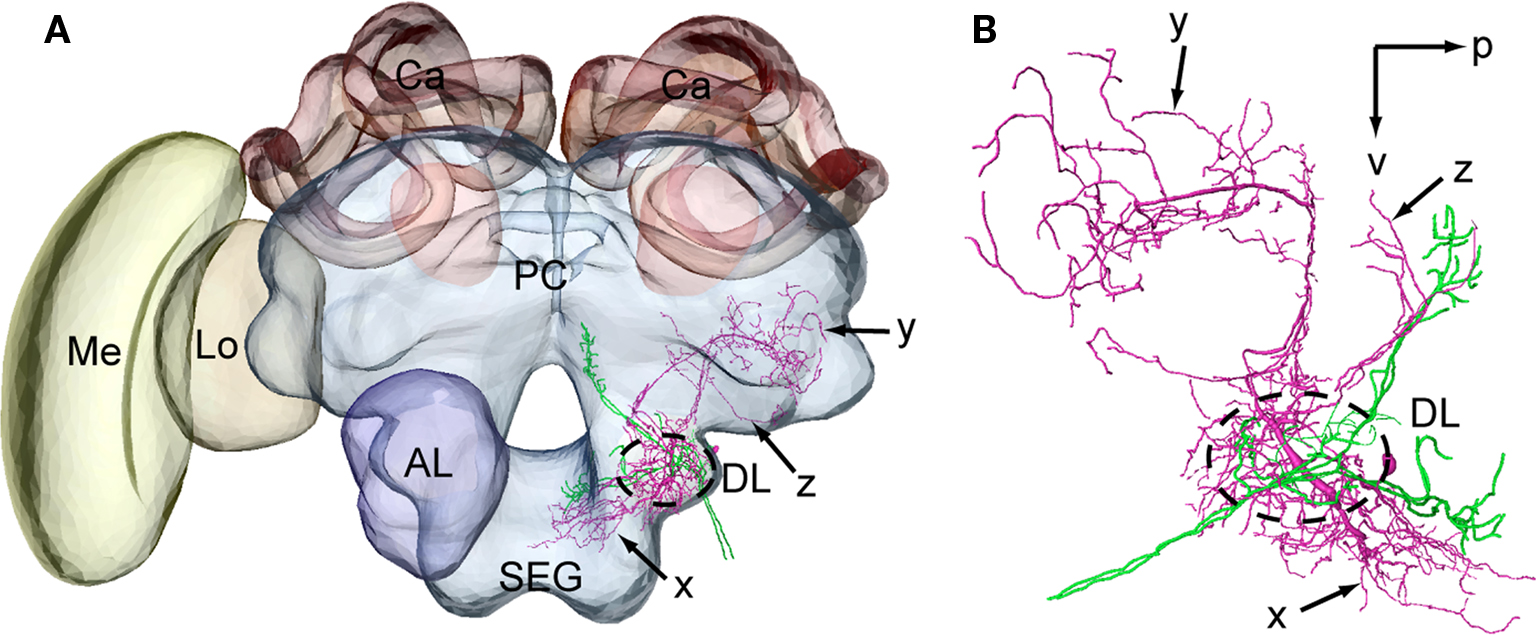
Figure 6 Spatial relationship between a DL-Int-2 neuron and Johnston’s organ (JO) afferents. The intracellularly marked DL-Int-2 and dye-injected JO afferents from two different specimens were reconstructed for most of their arborizations. (A) A DL-Int-2 neuron (magenta) and JO afferents (green) after registration into the Honeybee Standard Brain (frontal view). (B) Projection areas of the DL-Int-2 neuron (magenta) and JO afferents (green) in the dorsal lobe (DL, dotted circled line), the posterior and lateral protocerebral lobe (y, arrow and z, arrow, respectively), and the dorsal subesophageal ganglion (x, arrow) (lateral view). DL-Int-2 neurons overlap with the terminal branches of the JO in the dorsal lobe (DL). p, posterior; v, ventral. Modifi ed from Ai et al. (2009)
.
DL-Int-2 neurons respond to the rather strong vibratory stimulation with phasic-tonic excitation and with on-phasic or on–off phasic excitation to the vibration of relatively low amplitude. No preferred frequency was found for the range of 200–400 Hz, but the sensitivity is maximal in the range of 250–300 Hz (Ai et al., 2009
).
PPL-D-1 neuron
The somata of PPL-D-1 neurons are located in the ventral cell cluster of the SEG (Figure 7
). Each soma gives rise to a single primary neurite toward the dSEG that bifurcates into a dendritic neurite with a broad and dense arborization in the ipsilateral PPL and into an axon running into the contralateral ventral nerve cord (Figure 7
). The dendritic neurite branches into four thick axons at the ventral region of the PPL (Figure 7
). These thick branches terminate in the PPL with extensive ramifications carrying numerous fine spines in fan-shaped dendritic fields. The ramifications extend toward the midline of the PC. The contralaterally running axon gives rise to fine collaterals with blebby terminals (presumably synaptic boutons) at the contralateral SEG (Figure 7
C). The collaterals extend into the contralateral PPL. Presumable dendritic arbors of the PPL-D-1 are located close to JO afferents in the PPL on the medioventral PPL.
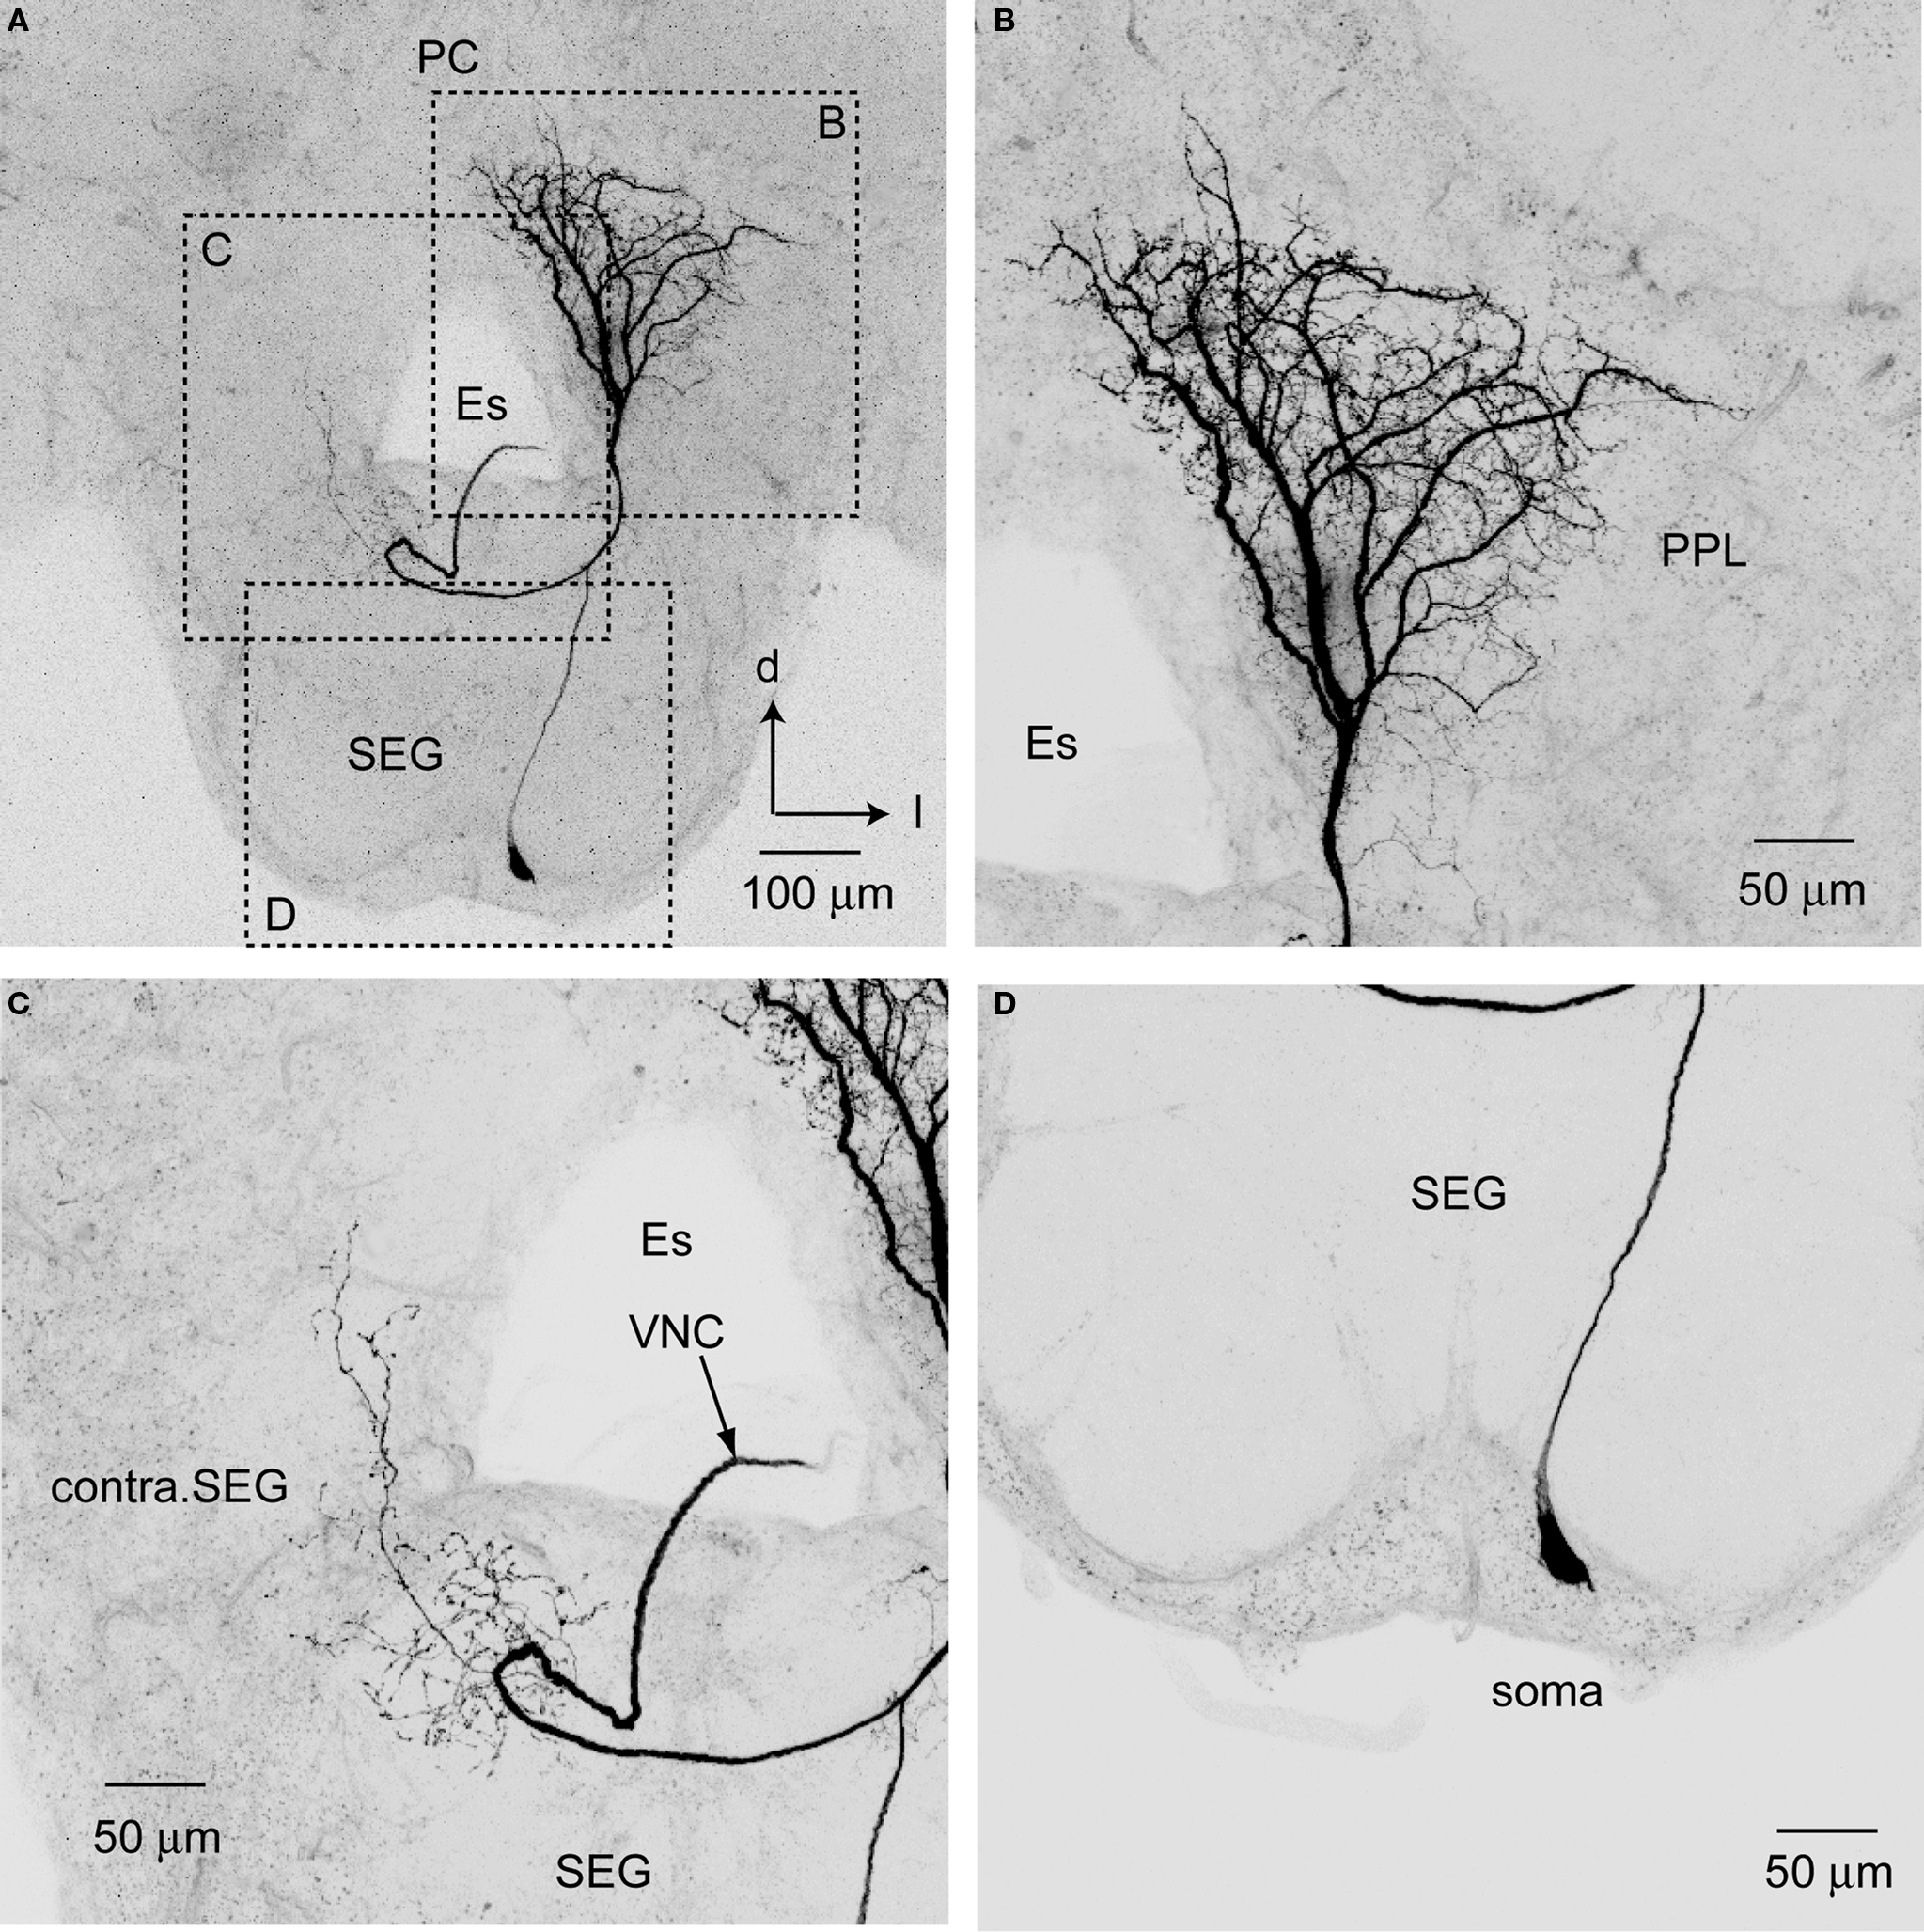
Figure 7. Posterior protocerebral descending neuron type 1 (PPL-D-1). (A) An entire dye-filled PPL-D-1 neuron in brain-SEG. (B–D) are enlarged views of the arborization shown in (A). (B) The dense and broad arborization in PPL. (C) The sparse and fine arborization in the contralateral SEG (contra. SEG). (D) The cell body located on the median region of ventral SEG. d, dorsal; Es, esophagus; l, lateral; PC, protocerebrum; SEG, subesophageal ganglion; VNC, ventral nerve cord.
The PPL-D-1 neuron does not respond to the vibratory stimulation alone but responds with long-lasting excitation to the vibration at 265 Hz when the olfactory (citral) stimulation is applied to the contralateral antenna. This and other observations indicate that PPL-DN-1 neurons integrate vibratory and olfactory stimulation.
Parallel Pathways of JO Afferents
Axon terminals running in T6I are closely appositioned with those of secondary interneurons from the ocelli (Pareto, 1972
; Mobbs, 1984
; Ai et al., 2007
), and T6I is known to be in close proximity to termination fields of visual projection neurons from the lobula (the neuropil specialized for movement detection; Maronde, 1991
). The medial PPL is known to receive dendrites of motion-sensitive descending interneurons sending axons to locomotory centers in the SEG (Goodman et al., 1987
; Ibbotson and Goodman, 1990
). Thus, extension of JO axons into the medial PPL may permit simultaneous sampling of proprioceptive and external mechanosensory signals as well as visual signals. Considering the participation of the JO in flight control (McIver, 1985
), the JO may modify visuomotor coordination during flight by detecting air current (Srinivasan and Zhang, 2004
). In Figure 7
, the descending neurons (PPL-D-1) that have arborizations in the PPL are shown, and these are suggested to be related to olfactory and vibratory processing in the PPL.
Axons of T6II in the dorsal lobe and SEG are characterized by thin processes with small varicosities. Generally, the SEG is the primary center of mouth parts, while the dorsal lobe corresponds to the antennal mechanosensory center (Rehder, 1988
, 1989
; Kloppenburg, 1995
) and also to the antennal gustatory center (Haupt, 2007
). Axon terminals of exteroceptors (such as hair plate) originating from the pedicel and flagellum are closely appositioned to those of JO afferents in the SEG (Ai et al., 2007
). In dance communication, tactile information together with airborne signals (e.g., jet streams and odors) is detected through antennal exteroceptors and appears to be important for follower bees detecting these signals at the rear end of the dancer bee (Rohrseitz and Tautz, 1999
). While the orientation of the dancers during waggle phase relative to gravity codes the direction to the flower, the followers read this direction also in relation to gravity. It has been revealed that the sensory hairs on the neck detecting the orientation of body axis against gravity project to the dSEG (Figure 2
C; Brockmann and Robinson, 2007
), suggesting that the DL-dSEG is an important area for decoding the information about orientation in space and may serve to integrate the mechanosensory and chemosensory inputs from the antenna and mouthparts.
Possible Neural Circuits for Processing Vibration
Vibratory processing has not been studied extensively. In this study, we described several types of vibration-sensitive interneurons morphologically and electrophysiologically. These response patterns of the vibration-sensitive interneurons suggest that DL-Int-1 and DL-Int-2 are related to monitoring the length of the vibration, and PPL-D-1 appears to be related to regulating the behaviors triggered by both olfactory and vibratory stimuli. The morphological results suggest our identified DL-Interneurons have a direct synaptic connection or indirect synaptic connections close to the JO afferents in the DL because both the DL-Interneurons are closely appositioned to the JO afferents in the DL. Some DL-Int-1 neurons responded with a tonic inhibition to vibration applied to the JO, and the duration of the inhibition changed depending on the duration of vibration (Ai et al., 2009
). The DL-Int-2 neurons responded optimally to 265-Hz vibration, which corresponds to the peak frequency of airborne vibrations arising during dance communication (Ai et al., 2009
). These physiological characteristics of the response pattern of the interneurons to the vibratory stimulation support this assumption. Moreover the DL-Int-1 closely arborizes to JO afferents in the central region of the DL, while the DL-Int-2 does the same in the anterior region of the DL (Figure 8
). Haupt (2007)
revealed that there are separate projection areas of gustatory and mechanosensory afferents in the DL. It is not clear whether the same JO afferents have synapses both on the DL-Int-1 and DL-Int-2 or different JO afferents have synapses on each DL-Int-1 and DL-Int-2; however, it is clear that there is a spatial functional segregation in the DL.
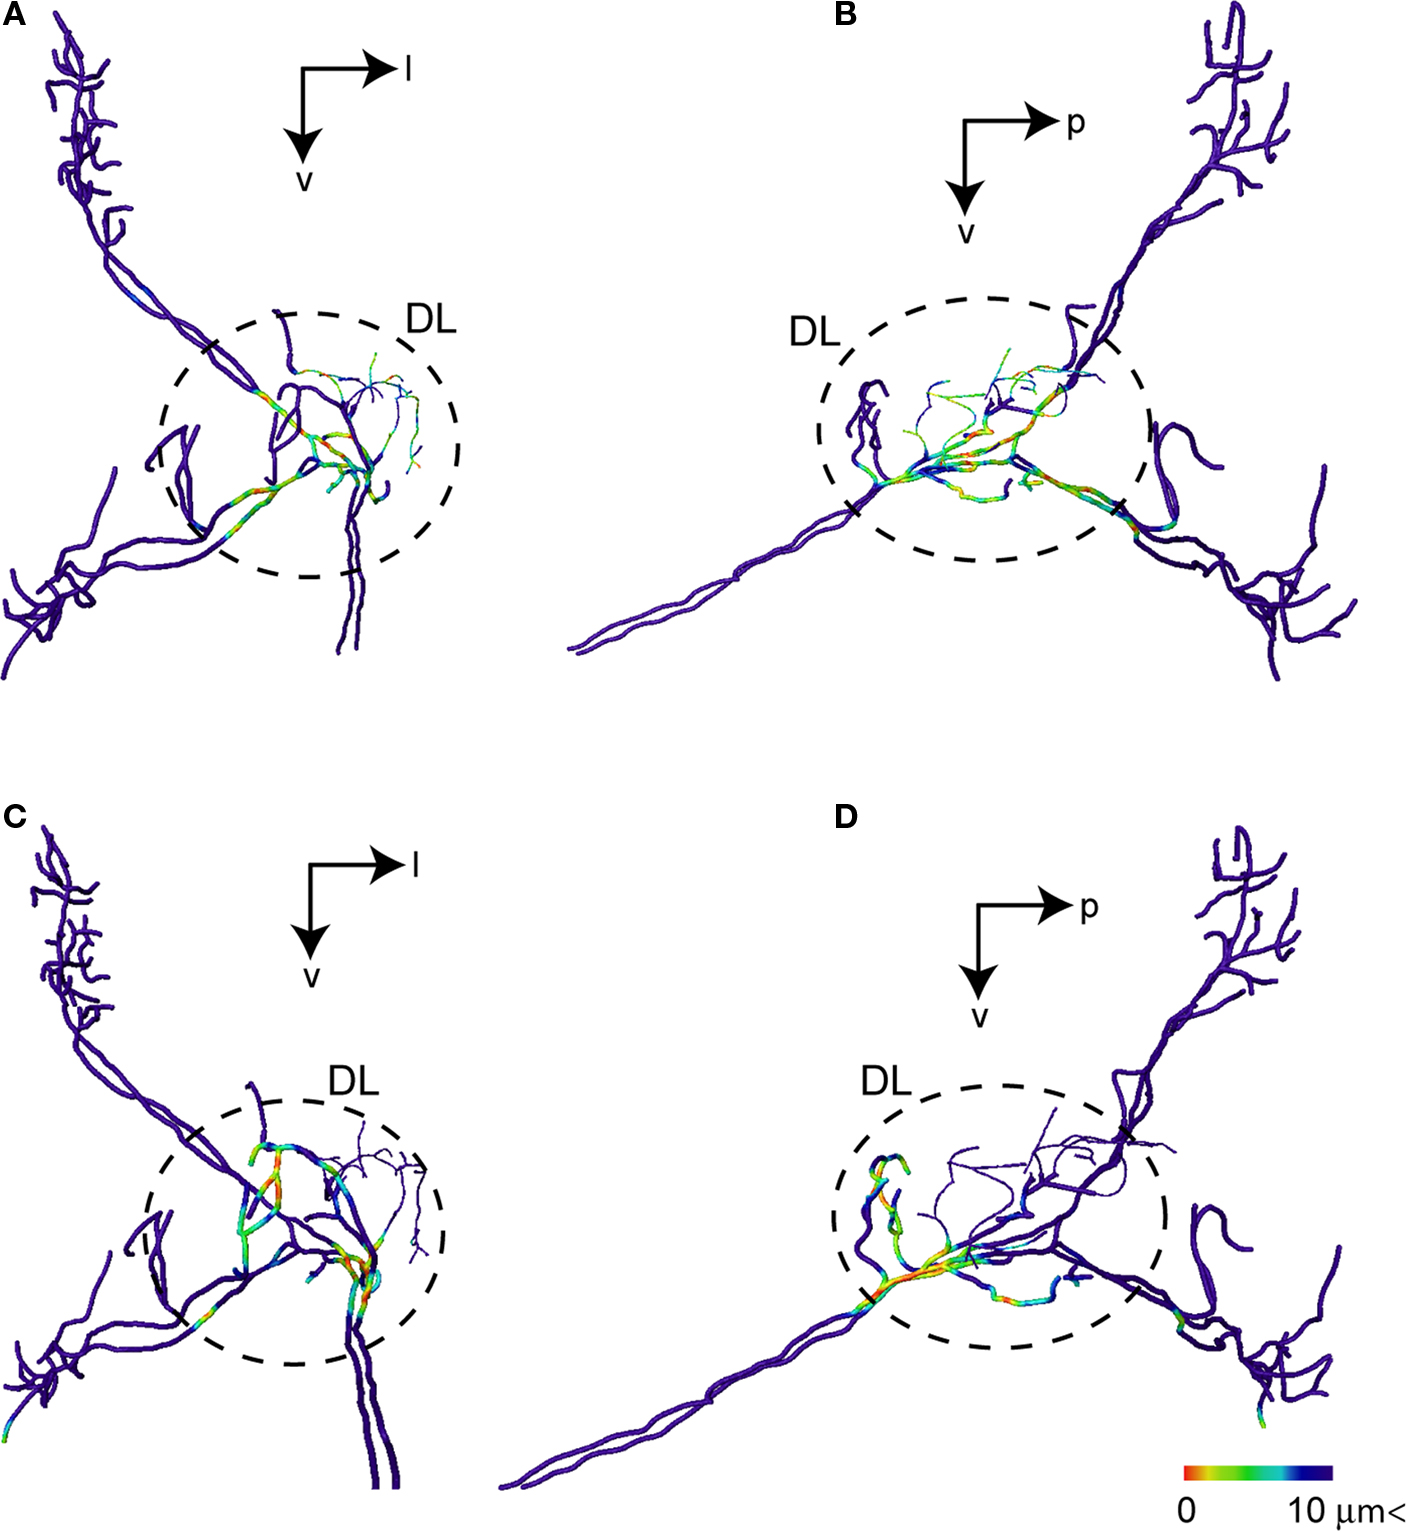
Figure 8. Possible synaptic contact regions between JO afferents and the identified DL interneurons. (A) and (B) show the area close to DL-Int-1 on the JO afferents in the HSB [(A) frontal view; (B) lateral view]. Distances between the DL-Int-1 neuron and JO afferents were calculated on the superimposed three-dimensional image by Amira’s tool. Red spots on the skeletonized fibers of JO afferents indicate close appositions to the DL-Int-1 neuron. The areas of red spots on the JO afferents exist in the central region of the DL. (C) and (D) show the area close to DL-Int-2 on the JO afferents in the HSB [(C) frontal view; (D) lateral view]. The areas of red spots on the JO afferents exist in the anterior region of the DL. DL, dorsal lobe; l, lateral; p, posterior; v, ventral.
DL-Int-1 neurons received bimodal inputs when the vibration was applied to the antenna (Ai et al., 2009
). One was an on–off excitatory input, and the other was a tonic inhibitory input. Because the dendrites of DL-Int-1 neurons were very close to the JO sensory axons in the DL (Figure 4
), the sensory neurons of the JO may have direct synapses on the DL-Int-1 neurons, especially excitatory synapses for the on–off phasic excitation. The inhibitory response of the DL-Int-1 neurons suggests that they may have inhibitory synaptic inputs directly from the JO afferents, provided that the JO afferents themselves are inhibitory neurons. Otherwise, DL-Int-1 neurons may receive inhibitory synaptic input from some interneurons that are excited by JO afferents. GABA-like immunoreactive profiles in the DL and the SEG (Schäfer and Bicker, 1986
) may support the latter assumption, though inhibitory synaptic inputs to DL-Int-1 neurons have not yet been confirmed. The pattern of response of DL-Int-1 neurons to vibration changes corresponds to the magnitude of spontaneous activity and can be changed by depolarizing current injection into the neuron (Ai et al., 2009
). This effect of depolarizing current injection may simulate the effect of additional inputs through other sensory systems (e.g., olfactory input). Thus, the neural activities appear to be regulated by direct or indirect synaptic inputs from as yet unknown centrifugal neurons.
DL-Int-2 neurons received an excitatory input when the vibration was applied to the antenna (Ai et al., 2009
). Because the dendrites of DL-Int-2 neurons were also very close to the JO sensory axons in the DL (Figure 6
), the sensory neurons of the JO may have direct synapses on the DL-Int-2 neurons. The fact that the number of evoked spikes increased linearly with the amplitude (less than 40 μm) of the vibration at 265 Hz supports the interpretation that these neurons receive monosynaptic input from JO neurons. Moreover, the DL-Int-2 neurons send axons to the lateral protocerebral lobe (LPL) and the PPL with fine blebs. The LPL is the second-order center of olfaction, and the lateral PPL is the second-order center of vision. The DL-Int-2 may have a role in sending the vibratory information to the other neuropils in which the other senses are processed. The identified olfactory interneurons that arborized in the LPL also responded to vibration with brief excitation (data not shown). Investigation of how the olfactory response of the interneurons is modified by the vibratory stimuli of the antenna is necessary.
The PPL-D-1 has a fan-shaped projection pattern with blebby terminals all over the PPL (Figure 7
). From the results of the registration of the PPL-D-1 and JO afferents into the HSB, the JO afferents in T6I closely approach against the PPL-D-1 on the ventral PPL region. However, the PPL-D-1 might not have direct synapse from the JO afferents because there are sparse blebby terminals of PPL-D-1 in the ventral PPL. The PPL-D-1 responds to simultaneous application of vibration and olfaction of the antenna with a long-lasting excitation. Some olfactory interneurons may be related with the synaptic processing between JO afferents and the PPL-D-1. In the male moth Manduca and Bombyx, the olfactory descending and bilateral neurons show long-lasting excitation to sex-pheromone stimuli to the antenna, suggesting these neurons may play a role in initiation and maintenance of the orientation behavior to the conspecific female (Kanzaki et al., 1991
; Kanzaki and Shibuya, 1992
). It has recently been revealed that local circuits producing the long-lasting excitation exist in the moth brain (personal communication). A neural circuit for producing long-lasting excitation must exist in the bee brain. The PPL-D-1 has a dense and broad dendritic arborization in the whole PPL (Figure 7
) in comparison with the localized terminals of T6I of JO in the medial PPL (Figure 2
B), suggesting the PPL D-1 receives inputs from not only the JO afferents but also the other centrifugal neurons. It is necessary to find the interneurons arborizing in the PPL, which are related to producing long-lasting excitation of the PPL-D-1.
The morphology of the PPL-D-1 neurons did not respond to either the vibration of 100–400 Hz or to the olfactory stimulation applied to the antenna; however, these neurons developed a long-lasting excitatory response to the vibration applied to the ipsilateral antenna during the olfactory stimuli application to the contralateral antenna. The motion-sensitive descending neurons have been identified and categorized as six groups (DNI to DNVI) based on branching patterns (Goodman et al., 1987
). The branching pattern of the PPL-D-1 is categorized in DNVI, and the morphological characteristics of PPL-D-1 are very similar to those of the DNVI2, which is sensitive to downward movements over the eye ipsilateral to its cell body. If the PPL-D-1 is the DNVI2, the PPL-D-1 is also responsive to motion stimuli. In the male moth, Manduca sexta, the olfactory descending neurons show responsiveness to multimodal stimuli, light, motion to the compound eye, and mechanical stimuli to the antenna (Kanzaki et al., 1991
). It has been suggested that the PPL-D-1 also has multimodal sensitivity, and the bees may use this neuron state-dependently: orientation during walking and flight control during flying.
The Usefulness of the Bee Brain Atlas
Single neuron labeling using metal ions or fluorescent tracers can reveal the fine arborization of a single neuron and the spatial relation between the identified neuron and the neuropile. Moreover, confocal fluorescence microscopy permits visualization of a single neuron three dimensionally. In this study, the HSB was used for visualizing overlapping areas between a labeled neuron and JO afferents in separated preparations. By using HSB, the three-dimensional morphology of individual neurons could be superimposed into a common reference space based on the boundary of several neuropiles, supporting an understanding of a spatial relationship between different identified neurons. Individual brains have their own volume and shape. Therefore, the processing of registration of a single neuron in the HSB involves both affine transformation and elastic geometric deformation. To know whether this processing is appropriate, we have to compare the image of double-labeled neurons in a preparation and the image of the two independently identified neurons registered into the HSB. Unfortunately, double labeling has not been successful so far in our study. In some cases of identified neurons running close to the surface of the brain, a part of branches of a registered neuron protrudes out from the HSB. Because the HSB is an average atlas of the bee brain, the arrangement of the skeleton graph of a neuron reconstructed in the HSB has its personal equation depending on the extent of its transformation and deformation. To judge whether two different neurons have synaptic connections, electrophysiological and ultramicroscopic analyses are necessary. However, the HSB observation is useful as an overview of these neural networks and for speculating on possible synaptic regions between different neurons.
In the processing of registration of identified neurons into the HSB, we need to trace the morphology of a single neuron to make a skeleton graph. If the fluorescence of labeled neurons is insufficient for tracing the morphology, small branching components are eliminated through the conversion to binary images for making a dendritic graph in Amira. Therefore, the traced neuron image looks smaller than the whole size of the arborization of confocal laser-scanning microscopic images. In such a case, we have to trace the fine branches manually, resulting in quite time-consuming work. It is convenient to have an automatic tracing program; however, it is currently difficult because the extent of fluorescence intensity depends both on individuals and on branches. A special program that can automatically judge the threshold on the conversion to binary images, depending on the fluorescence intensity of each labeled branch, would be useful for this processing.
Three-dimensional visualization of a single neuron can apply to the simulation of propagation of the activity. Yamazaki et al. (2006)
demonstrated the simulation for the three-dimensional morphological structure of interneurons of Bombyx mori. HSB has an advantage for the visualization of three-dimensional neural circuits in the brain. The current HSB analysis does not give us the enough evidence for a synaptic connection; however if combined with electrophysiological and electron microscopic analyses, it should be a more useful platform for making a real neural circuit model of the bee brain in the future using a simulation program such as “Neuron.” For making the neural circuit model, we need not only the site of synaptic connection but also the channel properties and their density in the synapses. It is difficult to know the synaptic properties of each connection, but it is a first step toward a virtual insect brain.
The authors declare that the research was conducted in the absence of any commercial or financial relationships that could be construed as a potential conflict of interest.
I thank Prof. Dr. Randolf Menzel and Dr. Jürgen Rybak, Institut für Neurobiologie, Freie Universität Berlin, for great help in registration of the confocal images of interneurons into HSB and for helpful comments on this research. This work is supported by the Central Research Institute of Fukuoka University; Grant number 066001; Grant sponsor: Ministry of Education, Science, Technology, Sports and Culture of Japan; Grant number: 18200036.
Goodman, L. J., Fletcher, W. A., Guy, R. G., Mobbs, P. G., and Pomfrett, C. D. J. (1987). Motion sensitive descending interneurons, ocellar LD neurons and neck motoneurons in the bee: a neural substrate for visual course control in Apis mellifera. In Neurobiology and Behavior of Honeybees, R. Menzel and A. Mercer, eds (Berlin, Springer-Verlag.), pp. 158–171.