1
Department of Physics, Cooper Union, New York, NY, USA
2
Departments of Mathematics and Computer Science, Cooper Union, New York, NY, USA
3
Departments of Neuroscience and Neurology, The Mount Sinai School of Medicine, New York, NY, USA
Relay cells in the mammalian lateral geniculate nucleus (LGN) are driven primarily by single retinal ganglion cells (RGCs). However, an LGN cell responds typically to less than half of the spikes it receives from the RGC that drives it, and without retinal drive the LGN is silent (Kaplan and Shapley, 1984
). Recent studies, which used stimuli restricted to the receptive field (RF) center, show that despite the great loss of spikes, more than half of the information carried by the RGC discharge is typically preserved in the LGN discharge (Sincich et al., 2009
), suggesting that the retinal spikes that are deleted by the LGN carry less information than those that are transmitted to the cortex. To determine how LGN relay neurons decide which retinal spikes to respond to, we recorded extracellularly from the cat LGN relay cell spikes together with the slow synaptic (‘S’) potentials that signal the firing of retinal spikes. We investigated the influence of the inhibitory surround of the LGN RF by stimulating the eyes with spots of various sizes, the largest of which covered the center and surround of the LGN relay cell’s RF. We found that for stimuli that activated mostly the RF center, each LGN spike delivered more information than the retinal spike, but this difference was reduced as stimulus size increased to cover the RF surround. To evaluate the optimality of the LGN editing of retinal spikes, we created artificial spike trains from the retinal ones by various deletion schemes. We found that single LGN cells transmitted less information than an optimal detector could.
All we know about patterns and objects in the visual world comes to us courtesy of the discharge of the relay neurons of the lateral geniculate nucleus (LGN), which convey the retinal messages to the visual cortex. A sensible brain design would preserve most of the information that has been gathered and elaborated by the retina, but it is well established (Kaplan et al., 1987
) that the LGN average firing rate is much lower than that of the retinal neurons that drive it. In fact, on average, the LGN fires only four spikes for every 10 spikes that the retina delivers to it. We also know that all LGN impulses are elicited by retinal spikes (Kaplan and Shapley, 1984
), and thus the LGN can only delete spikes from the incoming retinal message. These observations suggest that, if an LGN cell is to avoid losing much of the information delivered to it by the retina, it must select the most informative spikes for transmission, and block or ignore the less informative spikes, and it must do so across a wide range of stimulus types and sizes.
Here we investigate the dependence of the information content of retinal and LGN discharges on stimulus size. Although the transmission of information from retina to thalamus has been studied previously (Kaplan et al., 1987
; Usrey, 2002
; Sincich et al., 2009
), the impact of stimulus size has not been considered (but see Casti et al., 2005
). As stimulus size increases, the impact of the inhibitory surround on the cell’s sensitivity and response becomes important for both retina and especially the LGN (Hubel and Wiesel, 1961
).
Our current study exploits the fact that in the thalamus it is possible to record, with one extracellular electrode, the afferent input together with the thalamic output, and that each relay cell is driven primarily by a single retinal ganglion cell (RGC) (Bishop, 1953
; Cleland et al., 1971
; Kaplan and Shapley, 1984
; Sincich et al., 2007
; Weyand, 2007
). For a series of stimulus sizes we compared the single spike information content (Brenner et al., 2000
) in individual LGN cells with that of the retinal ganglion cells that drove the LGN. Although there are some variations among cells, we generally find that, to compensate for its lower firing rate, the LGN packs more information than the retina into each spike, but as stimulus size increases this trend becomes weaker.
Since single spike information is only an approximation to the total information a channel can carry, we also computed the information contained in pairs of spikes. We find that a second spike in a pair contributes information synergistically for short intervals in the retina, but is mostly redundant for the LGN over most of the spike time interval scale, almost independently of stimulus size.
We also ask: how does the LGN cell ‘decide’ which retinal spikes to ignore? Does it perform optimally, from the perspective of transmission of information about the stimulus, or is its editorial policy a compromise that includes other considerations, such as the overall state of arousal, contextual information and so on? We therefore edited the retinal spike train in several ways to produce artificial LGN spike trains of the same number of spikes as the one recorded in the laboratory. The comparison of information content of real and artificial LGN spike trains sheds light on the editing procedure that leads from the retinal to the LGN spike train through deletion of many spikes but with relatively little loss in information.
Surgical Preparation
The experimental methods were similar to those used in our lab in the past (Kaplan and Shapley, 1982
; Ozaki and Kaplan, 2006
). Housing, surgical and recording procedures were in accordance with the National Institutes of Health guidelines and the Mount Sinai School of Medicine Institutional Animal Care and Use Committee. Adult cats were anesthetized initially with an intramuscular (IM) injection of xylazine (Rompun, 2 mg/kg) followed by ketamine hydrochloride (Ketaset, 10 mg/kg), and then given propofol (diprivan) as needed during surgery. Local anesthetic (xylocaine) was used profusely during surgery, and was used to infiltrate the areas around the ears. Anesthesia was maintained with a mixture of propofol (4 mg/kg-hr) and sufentanil (0.05 �g/kg-hr), which was given IV during the experiment. Propofol anesthesia has been shown to cause no changes in blood flow in the occipital cortex (Fiset et al., 1999
), and appears to be optimal for brain studies. Cannulae were inserted into the femoral veins, the right femoral artery, the bladder, and the trachea. The animal was mounted in a stereotaxic apparatus. Phenylephrine hydrochloride (10%) and atropine sulfate (1%) were applied to the eyes. The corneas were protected with plastic gas-permeable contact lenses, and a 3-mm diameter artificial pupil was placed in front of each eye. Blood pressure, ECG, and body temperature were measured and kept within the physiological range. Paralysis was produced by an infusion of pancuronium bromide (Norcuron, 0.25 mg/kg-hr), and the animal was artificially respired. The respiration rate and stroke volume were adjusted to produce an end-expiratory value of 3.5–4% CO2 at the exit of the tracheal cannula. Penicillin (750,000 units) and gentamicin sulfate (4 mg) were administered IM to provide antibacterial coverage, and dexamethasone was injected IV to prevent cerebral edema. A continuous IV flow (3–5 ml/kg-hr) of lactated Ringer’s solution with 5% dextrose was maintained throughout the experiment to keep the animal properly hydrated, and the urinary catheter monitored the overall fluid balance. Such preparations are usually stable in our laboratory for more than 96 h. The animal’s heart rate and blood pressure monitored the depth of anesthesia, and signs of distress, such as salivation or increased heart rate, were watched for. If such signs appeared, additional anesthetics were administered immediately.
Recording LGN Spikes and S Potentials
Single units were recorded extracellularly with tungsten microelectrodes (2 MΩ, Alpha Omega or FHC) in layers A and A1 of the LGN of six cats. Amplified electrical signals were sampled at 40 kHz by a data acquisition interface (Spike 2, CED) for spike recording and sorting. To map RFs of LGN relay neurons, we first moved a mouse-controlled light or dark bar on the CRT to find the approximate position of the RF, and then reverse correlated the spike train with a 16 × 16 checkerboard, in which each check was modulated by an independent m-sequence (Sutter, 1987
). Cells were classified as X or Y based on their responses to contrast reversing gratings, according to the criteria of Hochstein and Shapley (1976
). All cells were within 15° of the area centralis. The RF center size was estimated by fitting a Difference of Gaussians model (Rodieck, 1965
) to the spatial response map that resulted from the reverse correlation procedure. The center radius was taken to be twice the σ of the Gaussian fit, and in Figures 2
, 3 and 4
stimulus size is specified in multiples of RF center diameter, in order to make comparisons among cells of different center size more meaningful.
The recording electrode was brought close to the cell body of an LGN neuron, to ensure a clean and stable recording of both the LGN spike and the S potential (Bishop et al., 1958
; Kaplan and Shapley, 1984
) (see Figure 1
). We were often able to record both S potential and LGN spike for several hours.
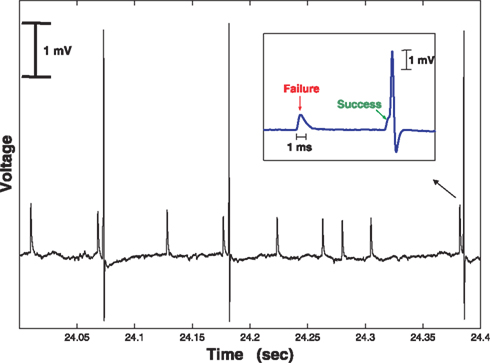
Figure 1. Simultaneous extracellular recording of the retinal input (S, small, slow potential) together with the LGN spike (large, faster potential). Voltage sampled at 40 kHz. Note that the retinal firing rate is significantly higher than that of the LGN. In this example there were 12 S potentials, but only three LGN spikes, so the transfer ratio was 3/12 = 0.25.
Visual Stimulation
The eyes were refracted, and correcting lenses focused the eyes for the usual viewing distance of 57 cm. The optic disks were back-projected and mapped on a tangent screen, on which the RF positions of single cells were mapped. Stimuli were presented monocularly on a CRT (luminance: 10–50 cd/m2) driven by a VSG 2/5 stimulator. The CRT is calibrated according to Brainard (1989
) and Wandell(1995)
. The spectral power distribution (SPD) of each phosphor was measured with a spectro-radiometer (PR-1980B, Photo Research). Gamma corrections were made with the VSG software and photometer (OptiCal). Visual stimuli consisted of homogeneous spots of various sizes (range: two to five times the RF center size, as estimated from the reverse correlation maps), modulated in luminance according to a pseudo-random sequence (van Hateren, 1997
). Eight second segments of the luminance sequences were presented repeatedly (128 times), alternating with 8-s non-repeating (‘unique’) segments of the sequence (Reinagel and Reid, 2000
).
Data Analysis Methods
Spike sorting
Event times were extracted off line from high-pass filtered (>100 Hz) extracellular voltage traces by setting two thresholds: a low threshold for the S potentials and a higher threshold for the LGN spikes. Typically, the LGN spikes and S potentials were ∼3–4 mV and ∼0.5–1 mV above the baseline noise, respectively. Waveform templates (separately for each threshold) spanning a time range of 1 ms after a threshold crossing and 0.5 ms before it were saved and sorted using spike analysis software (Spike 6; Cambridge Electronic Design). The collection of waveforms was put through a principal components analysis in order to eliminate any events arising from spurious membrane potential fluctuations, which were rarely encountered. Using the extracted waveforms, an event time was defined as the time at which the event reached half its peak height.
Note that our choice of the waveform window in effect imposes a refractory period on our extracted train of S potentials, since any S potential succeeding another by less than 1 ms would be part of the same event. In principal, this procedure could result in unidentified ganglion cell events with extremely short inter-event intervals. For each cell analyzed here, however, the principal components analysis revealed that no such events occurred. Since multiple retinal inputs to the relay cell would corrupt our analysis of the ganglion cell information transmission, we would in any case have rejected such cells for the calculations presented here.
We also assume that each relay cell spike was triggered by an S potential. For the vast majority of relay cell action potentials, the fusion of the S potential with the LGN spike was evident. However, LGN spikes without a temporally proximal S potential antecedent are possible, so our assumption would result in a slight overcount of retinal events. It has been estimated that such “anonymous” LGN spikes account for no more than 5% of relay cell spikes (Sincich et al., 2007
).
Information calculations.
We are interested in evaluating the amount of mutual information between an event in the neuronal response (such as a single spike, a pair of spikes, etc.) and the time-varying stimulus. We measured this with the method described by Brenner et al. (2000)
, which gives exact results for the information content of events without reference to any specific statistical models.
Information contained in single spikes. An 8-s portion of the luminance sequence s(t) (van Hateren, 1997
; see Materials and Methods) was repeatedly presented 128 times. We discretized the spike train in small time bins Δt and generated a PSTH that we used to estimate the instantaneous time-varying firing rate r(t). This was used to compute the information conveyed by a single spike
where  is the average firing rate and T = 8 s.
is the average firing rate and T = 8 s.The finite size of the data set introduces a systematic error in such calculations, which decreases as the amount of data increases (Strong et al., 1998
; Brenner et al., 2000
). We corrected for this bias by computing the information (Eqn. 1) as a function of bin size, and performing a linear least squares fit to the well-behaved linear portion of these measurements. The fit was extrapolated to the limit Δt → 0 (i.e. the y-intercept was computed). The uncertainty was taken to be the 1σ error of the y-intercept parameter, under the typical assumption of independent, normally distributed data points.
To test the robustness of our information calculations we performed a bootstrap analysis. We generated 500 surrogate data sets, each consisting of 128 spike trains, which were drawn (with replacement) from the original data, and followed the procedure outlined above to determine the information for each. The results were highly reproducible: the standard deviations of these information values were 5–20 times smaller than the error of the fit parameter. Erring on the side of caution, we report our final results as the mean information value over these 500 repeats, with an uncertainty given by the median of the distribution of 1σ fitting errors for these same repeats.
Information contained in pairs of spikes. The method described in Brenner et al. (2000
) applies to compound events as well as single spike events. In each of the original 128 retinal spike trains, we identified compound events consisting of pairs of spikes separated by an interval τ. For each pair, we recorded the time of the second spike of the pair, and used it to generate an ‘event train’ of paired spikes. Following the method we used for single spike information calculations, these event trains were discretized in small time bins Δt and a PSTH was generated, from which we estimated the instantaneous time-varying event rate rE(t). This was used to compute the information conveyed by an event consisting of a pair of spikes with interspike interval τ
where  is the average event rate.
is the average event rate.We corrected for the bias due to finite data size and assigned uncertainties in the same way as described in the previous section.
Editing Retinal Spike Trains to Create Artificial LGN Spike Trains
Knowing that the LGN deletes a large number of spikes from the corresponding retinal spike train, we wish to compare the LGN performance with an optimal standard, which would convey the maximum amount of information about the stimulus. We approach this question by generating artificial LGN spike trains from experimentally measured retinal spike trains, while keeping the number of spikes in the artificial train the same as that of the real LGN train. The comparison of artificial spike trains with the real ones puts the spotlight on those aspects of the retinal spike train that matter most in the transmission from retina to LGN. For the comparison we use the mutual information between the stimulus and the response (Rieke et al., 1997
). As stimulus size varies, and firing rate and transfer ratio (the ratio of the number of LGN to retinal spikes) change, information rate varies as well, revealing aspects of the LGN editing process.
We compared each experimentally recorded LGN spike train with the following three artificial ones:
1. Scrambled LGN inter-spike intervals
For each LGN spike train we computed the ordered sequence of intervals between successive spikes. We then randomly permuted these intervals to generate a synthetic LGN spike train that had the same statistics (total number of spikes and inter-spike interval distribution) as the original spike train. We performed this procedure independently for each of the 128 repeats in our data set. We used this model as a control set, since we expected the single spike information content to be near 0. The scrambling destroyed the temporal structure in the rate function r(t), driving it towards a uniform value across the duration of the experimental window (i.e. )  .
.
.2. Uniformly vetted retinal spike train
We generated artificial LGN spike trains by vetting the corresponding retinal ones in the following way: from a list of retinal spike times we drew at random (with uniform probability) a subset that contained as many spikes as were found in the corresponding LGN spike train. This list represents the artificial LGN spike train. We performed this procedure independently for each of the 128 repeated responses in our data set.
3. Pair vetting of retinal spike trains
To each LGN spike corresponds an RGC spike (S potential) preceding it in time by (at most) a couple of milliseconds. Even when the S-potential is difficult to extract from the LGN spike waveform, our analysis assumes the presence of the retinal spike. It is known (Usrey et al., 1999
; Sincich et al., 2007
) that in many cases the retinal ganglion cell spike that nearly coincides with the LGN spike is preceded by another retinal spike that acts as a primer: it brings the LGN membrane potential closer to its firing threshold, which is then crossed with the help of the subsequent retinal input. This point is clear from the distribution of retinal spike intervals preceding the corresponding LGN spike, which is concentrated at small intervals (median ≈11 ms.) Following these considerations, we performed the following vetting of the retinal spike train: we took all interspike intervals within a certain size (equal to the median mentioned above) and kept the last spike of those intervals as an LGN spike. We then eliminated the spikes belonging to these intervals from the retinal train, and vetted the remaining retinal spikes uniformly according to an effective transfer ratio, such that the total number of LGN spikes of this artificial train was equal to the experimental one.
In Table 1
we list all the cells that yielded reliable data, and the stimulus sizes we used for each cell. All the cells in our sample were X (6 OFF, and two ON). We used a number of spot sizes ranging from 0.28° to 6.6°, a factor of over 20 in scale. For some cells, spike trains were recorded at as many as 7 (cell #8) or 8 (cell #5) different spot sizes. For these neurons, the spot sizes ranged from those that were smaller than the RF center size to those that were five or six times the center size.
Single Spike Information and Stimulus Size
Information in bits/spike
In Figure 2
we show, for two representative cells (X-OFF cell, #7, and X-ON cell, #8), how the single spike information content in bits per spike (see Materials and Methods) depends on spot size for the LGN and its corresponding RGC spike trains. To assess the performance of LGN relay neurons as editors of incoming information, we also compared the LGN information with that associated with three artificial LGN spike trains of the same number of spikes as the actual one, each generated through a different vetting procedure from the measured RGC train. The three vetting procedures (see Materials and Methods) were: interval scrambling, uniform vetting according to transfer ratio, and pair vetting.
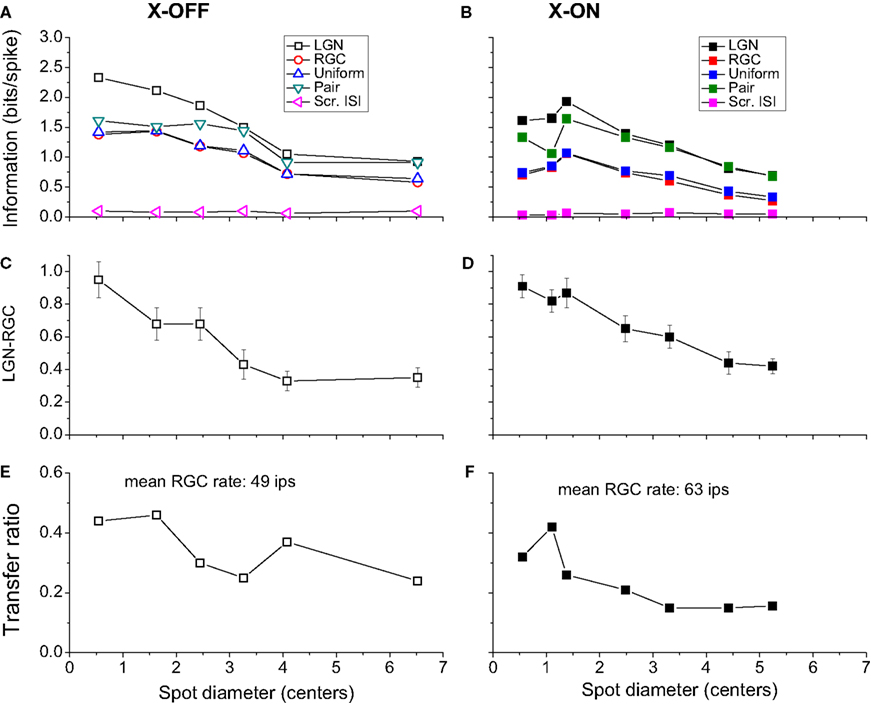
Figure 2. The relation between information transmission and stimulus size. (A,B) Single spike information (in bits/spike) as a function of spot size for two representative cells (# 7 and 8, Table 1
). The LGN spike train (black) carries more information per spike than the corresponding RGC spike train (red). For comparison, we have included the results of three different deletion procedures, which left the number of LGN spikes the same as it was in the real one: random deletion of events from the RGC spike train (green), considering only pairs of RGC spikes (blue) and a spike train generated by scrambling the interspike intervals in the observed LGN train (magenta). (C,D) The difference between the information (in bits/spike) between the LGN and the RGC. The error bars are the sums of the standard errors of the mean for the LGN and RGC. (E,F) Transfer ratio (LGN firing rate divided by RGC firing rate) as a function of spot diameter. To facilitate comparison between cells of different RF center size, spot diameter is given in multiples of the diameter of the RF center (see Materials and Methods).
For the two cells we considered in Figure 2
, the transfer ratio does not exceed 0.5, decreases with increasing spot size beyond 1°, and does not vary much with stimulus size beyond 2° (Figures 2
E,F). With regard to single spike information content, a number of features are apparent in Figure 2
, and are common to both ON and OFF cells in our sample:
1. The information in bits/spike for both LGN and retina decreases with stimulus size, with a reduction by a factor of 2 when the spot size increases from 0.5° to 4°.
2. The information in bits/spike is higher for the LGN than for the retina at all stimulus sizes.
3. The information difference between LGN and retina decreases as stimulus size increases (Figures 2
C,D).
We also ask: how does the single spike information depend on transfer ratio and firing rate? Although in Figure 2
A a leveling off in the information rate is apparent at the largest spot sizes, there is no such effect in Figure 2
B (even though the transfer ratio has leveled off, as seen in Figure 2
F), and therefore the information content for both LGN and retina is at most weakly dependent on transfer ratio. The same result holds for the dependence on firing rate.
The comparison between artificial and real LGN spike trains in Figures 2
A,B shows the following:
1. Scrambling the intervals of RGC spike trains leads to LGN trains with nearly zero information at all stimulus sizes, although these trains have the same firing rate and interspike interval histogram as the real ones.
2. Uniform vetting leads to an artificial LGN spike train of the same content as the recorded RGC train at all spot sizes. This result, already observed for a small spot size by Sincich et al. (2009)
, is not surprising. The vetting procedure is unbiased and simply results in a coarser sampling of the RGC PSTH. As long as the transfer ratio is not extremely low, we should expect the PSTH (i.e. instantaneous firing rate r(t)) of the subsampled spike train to be a faithful reproduction of the temporal structure present in the original RGC train. The fact that the observed LGN single spike information is greater than that obtained by the uniform vetting model confirms that the LGN is not simply deleting RGC spikes randomly.
3. Pair vetting leads to an artificial LGN spike train with information rates that can be very close to the real ones. This demonstrates that many, sometimes most, real LGN spikes are associated with the second spike of RGC spike pairs, where the two members of the pair are separated by a short time interval. The performance of the pair vetting procedure for all cells is illustrated in Figure 5
. The ability of pair vetting to capture the essential behavior of the LGN is high at low transfer ratios, but declines with increasing transfer ratio. This decline results from the fact that at transfer ratios above 0.5 it is impossible for all LGN spikes to come from pairs of RGC spikes with intervals that lie within the chosen range (see Materials and Methods).
Information rate (in bits/second)
From the preceding discussion it is clear that the editing mechanism that converts the retinal spike train into the thalamic one partially compensates for the loss of information (due to the LGN’s lower firing rate) by an increase in the information carried by each LGN spike. In Figure 3
, we compare information per spike (Figure 3
A) with information per second (Figure 3
B). For all cells and stimulus sizes, the LGN packs distinctly more information per spike than the retina, with the difference represented by the vertical distance of each point from the line of equal information for LGN and retina. However, for information rate in bits per second, the LGN rate can be very close to that of the retina (Figure 3
B), as the proximity of some points to the equal information line shows. While none of the points are found on this line, 29% of them lie very close (within 5 bits/s).
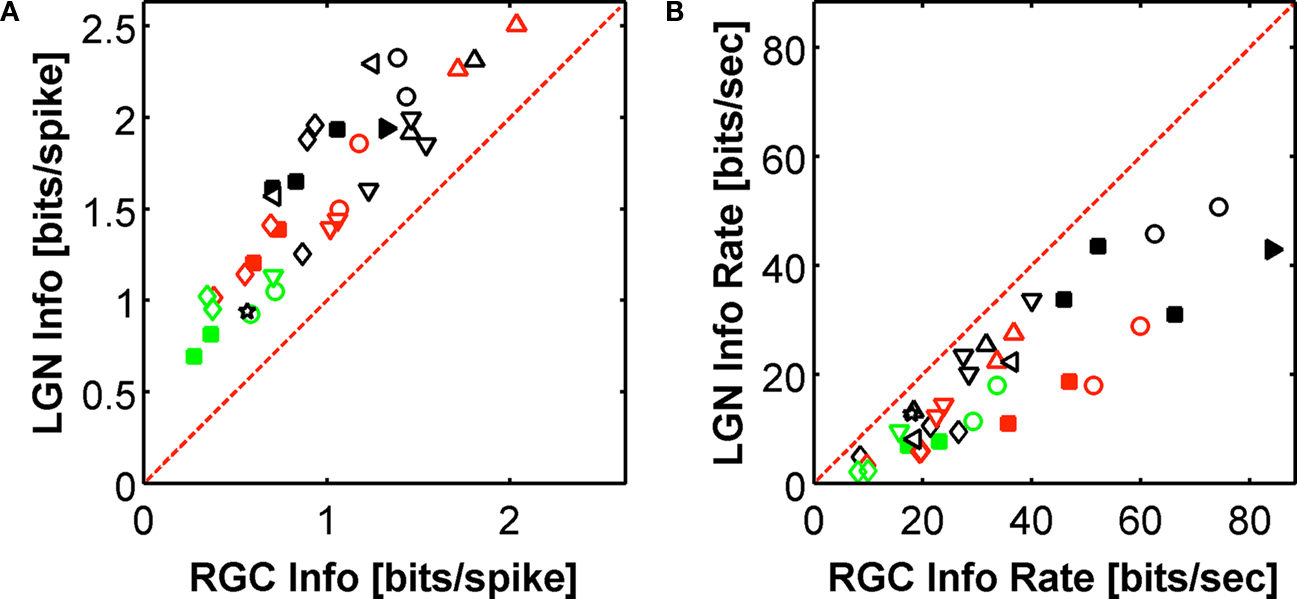
Figure 3. Relation between single spike information in LGN and RGC. (A) Information Ispike in units of bits per spike (for various cell-spot size combinations). All the points are above the line of unit slope, indicating that the LGN spike train is more efficient (contains more information per spike) than the corresponding input RGC train. (B) Information rate (in bits per second). The red dashed line represents points for which the LGN information rate matches that of the RGC. While none of the points are found on this line, 29% of them lie very close (within 5 bits/s). A distinct difference in the information rate between small and large spot sizes is apparent. Distinct symbols (used also in Table 1
) represent different cells, and the colors represent stimulus sizes, in units of multiples of RF center diameter (see Materials and Methods): ≤ 1.5 centers (black), 1.5 < SS ≤ 3 centers (red), SS > 3 centers (green). X ON and X OFF cells are denoted by filled and open symbols, respectively. The error bars on the data points (in both directions) are smaller than the symbols themselves and are not shown.
A distinct difference in the information rate between small and large spot sizes is apparent. The LGN information rate (in bits/s) is more likely to match the retinal one for small spots than for large ones, as is apparent from Figure 4
, which shows the percentage of LGN information rate relative to the RGC information rate across all X Off cells (we did not have sufficient information about ON cells to include them in this summary figure). The LGN information rate clearly decreases with increasing spot size, and this trend is also reflected in the results for both the uniform and pair vetted models. This is another way of illustrating the point that for small spot sizes (Figures 4
A,B) the LGN performs better at conserving the retinal information (in bits/second).
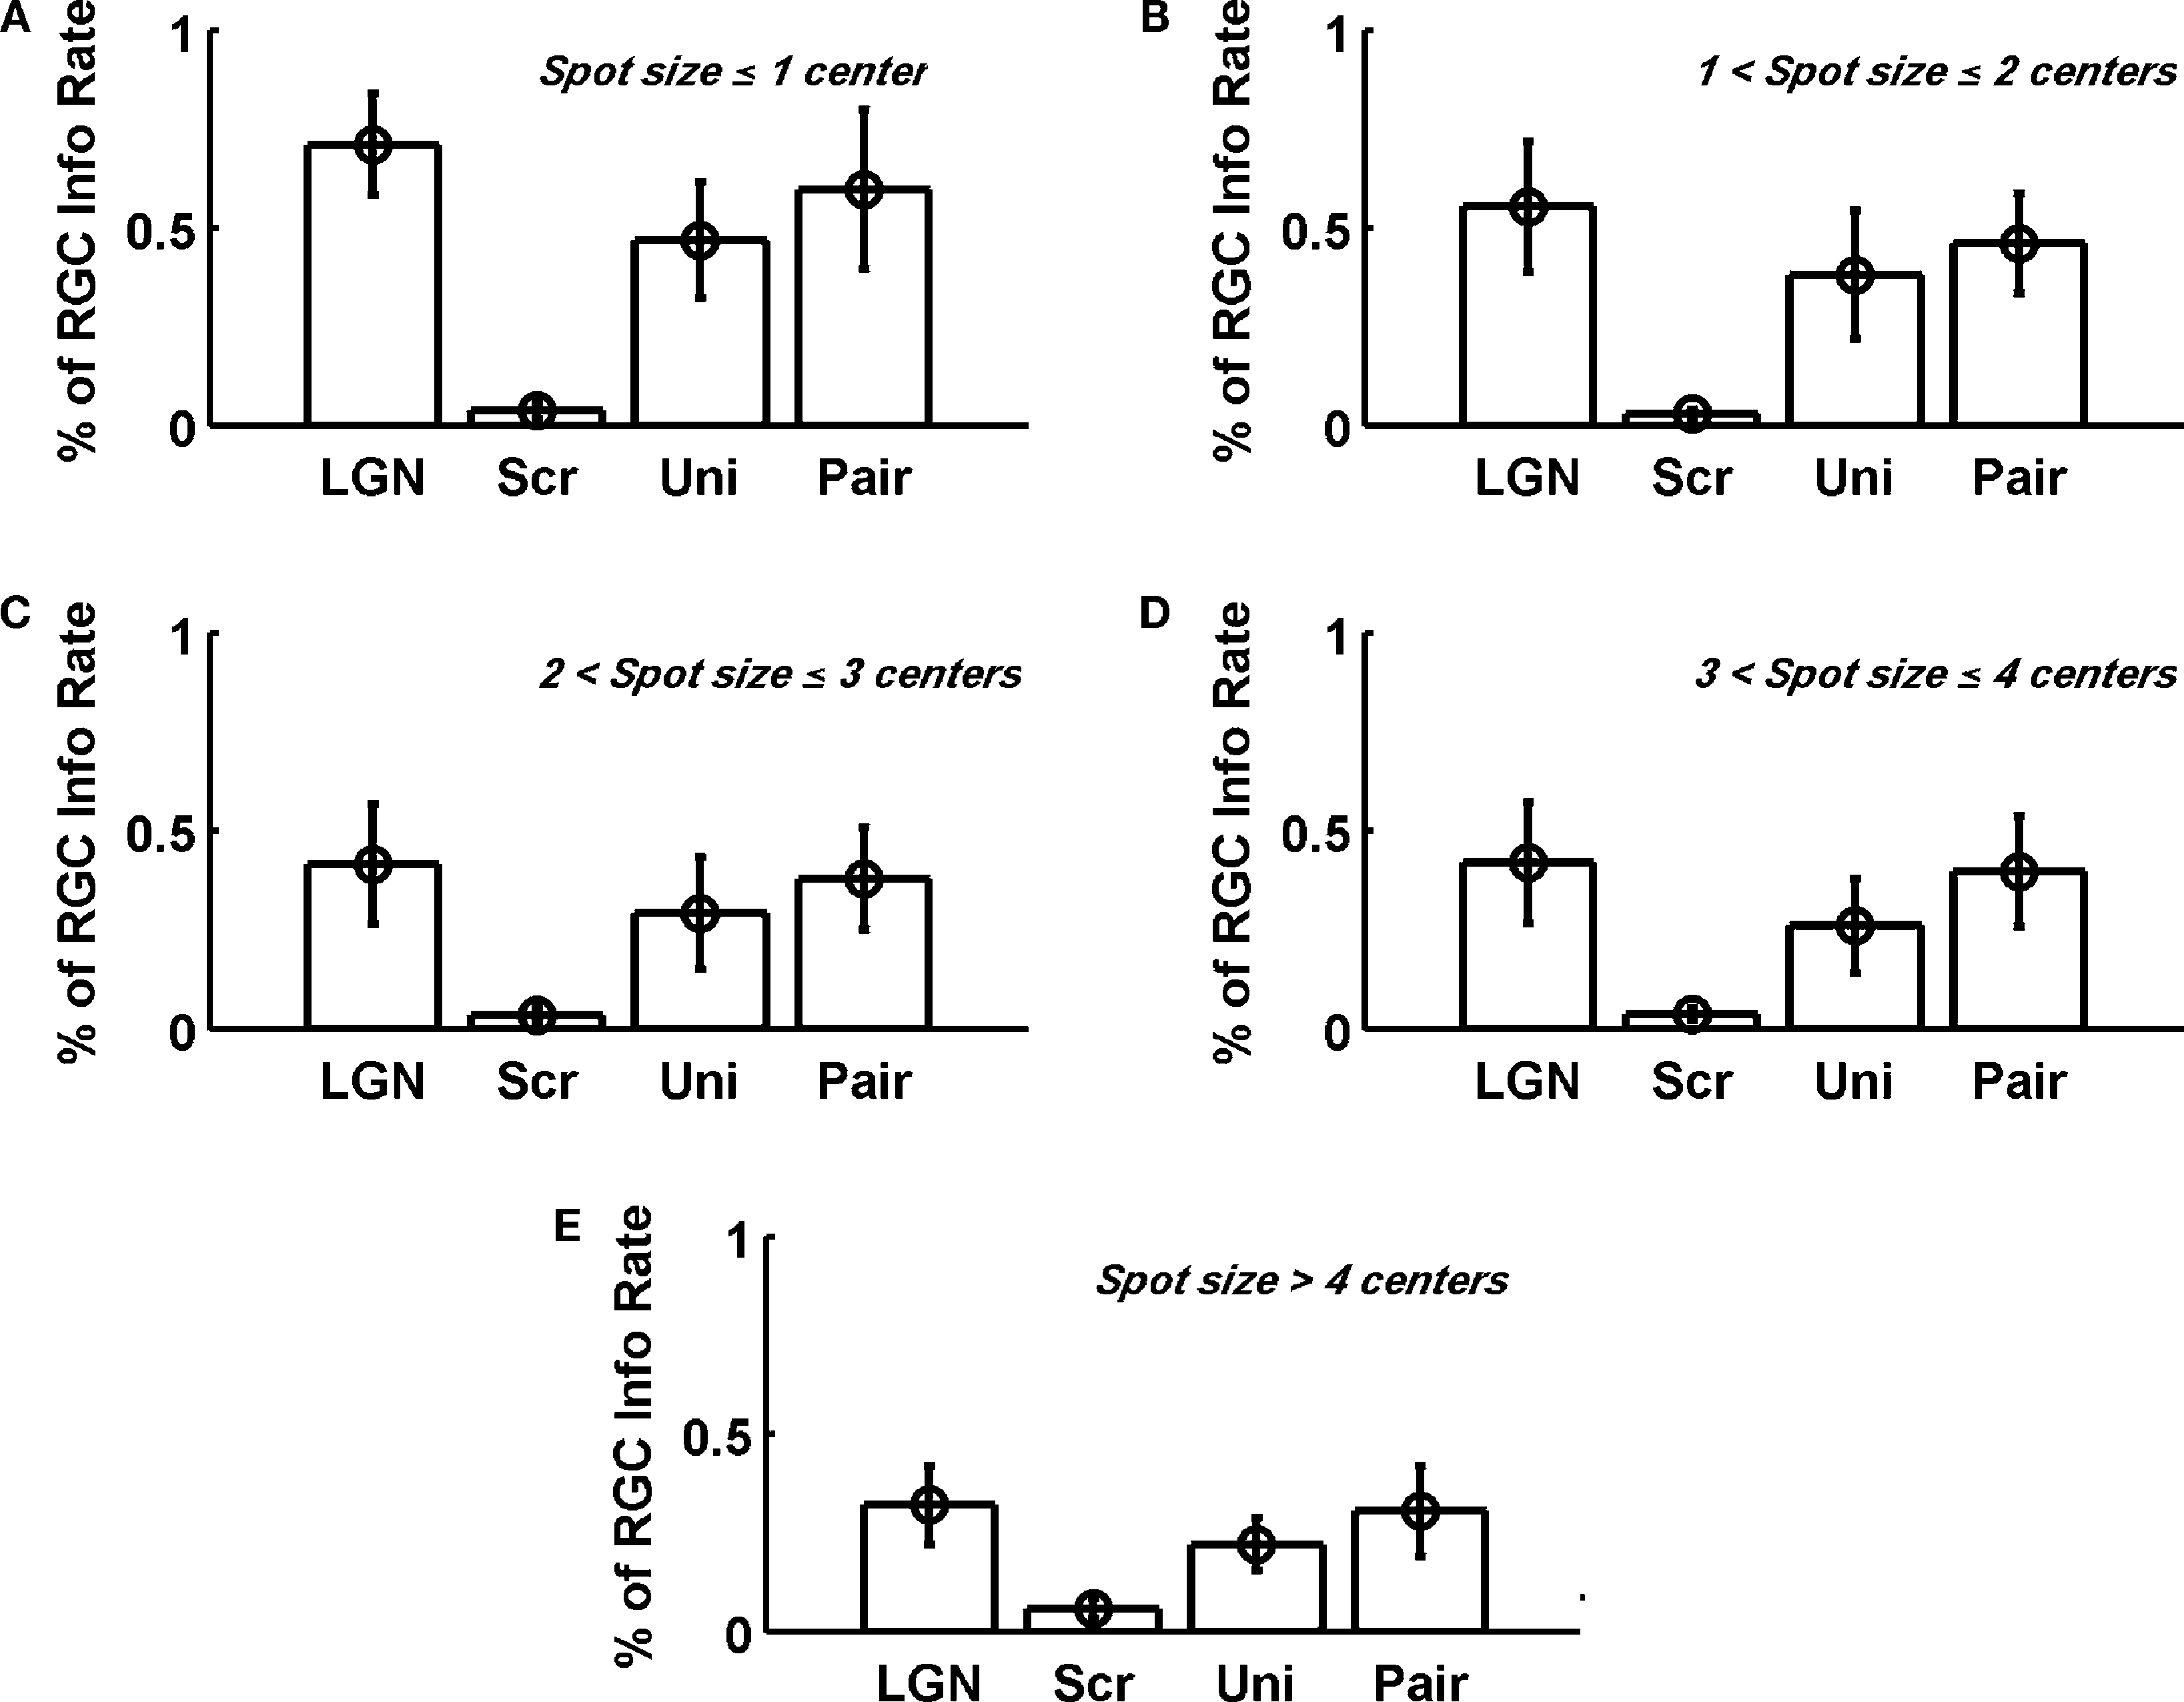
Figure 4. Single spike information rate Ispike (relative to RGC information rate) varies with stimulus size. For all the X Off cells, we group the results according to stimulus size. For a given group, we compute the average over all the measurements. Error bars are ±1 SD. Stimulus sizes are given here (upper right of each panel) in multiples of RF center diameter (see Materials and Methods). ON cells were omitted because we did not have enough reliable data from these cells to include them in this summary.
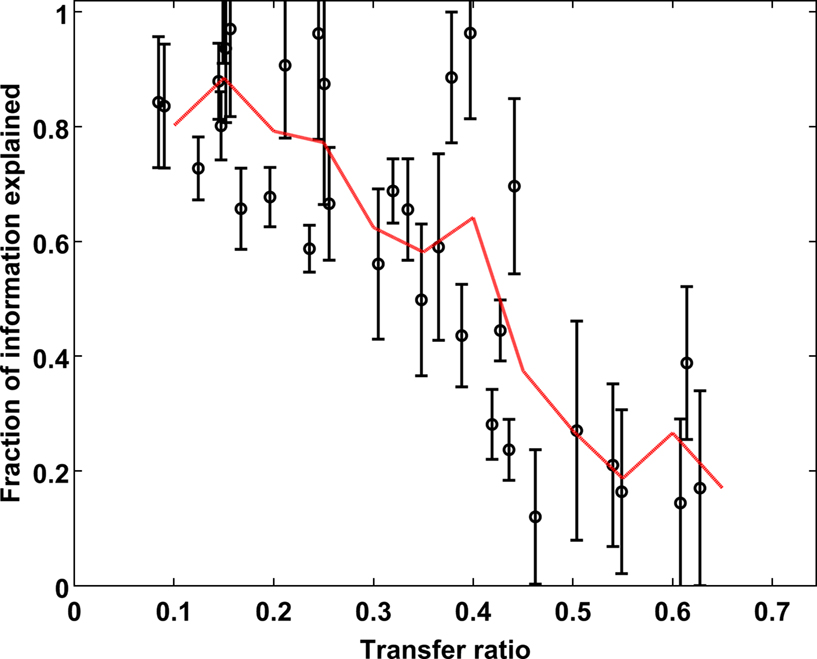
Figure 5. Performance of the pair model. The percentage of LGN single spike information captured by the model is plotted as a function of transfer ratio. The ability of this simplistic model to capture the essential behavior of the LGN declines with increasing transfer ratio, and is a result of the fact that at transfer ratios above 0.5 it is impossible for all the LGN spikes to come from pairs of RGC spikes. The dashed line represents the (binned) average of the points as a function of transfer ratio.
Spike Pair Information and Stimulus Size
So far we have discussed single spike information according to the formalism of Brenner et al. (2000)
. However, spike-to-spike correlations could contribute information that would be either redundant or synergistic compared to the sum of two independent single spike trains. In Figure 6
we show how this paired spike information varies with interspike interval for several stimulus sizes for two cells, one ON and one OFF. Generally, we find more redundancy in the LGN than in the retina. Synergy occurs at small time intervals, but much more significantly for the RGC than for the LGN. RGC synergy at time intervals from 5–15 ms is presumably connected to the success of the pair editing model, namely, the fact that most LGN spikes tend to coincide with the second member of a RGC spike pair of two successive spikes closely following each other (Usrey et al., 1998
).
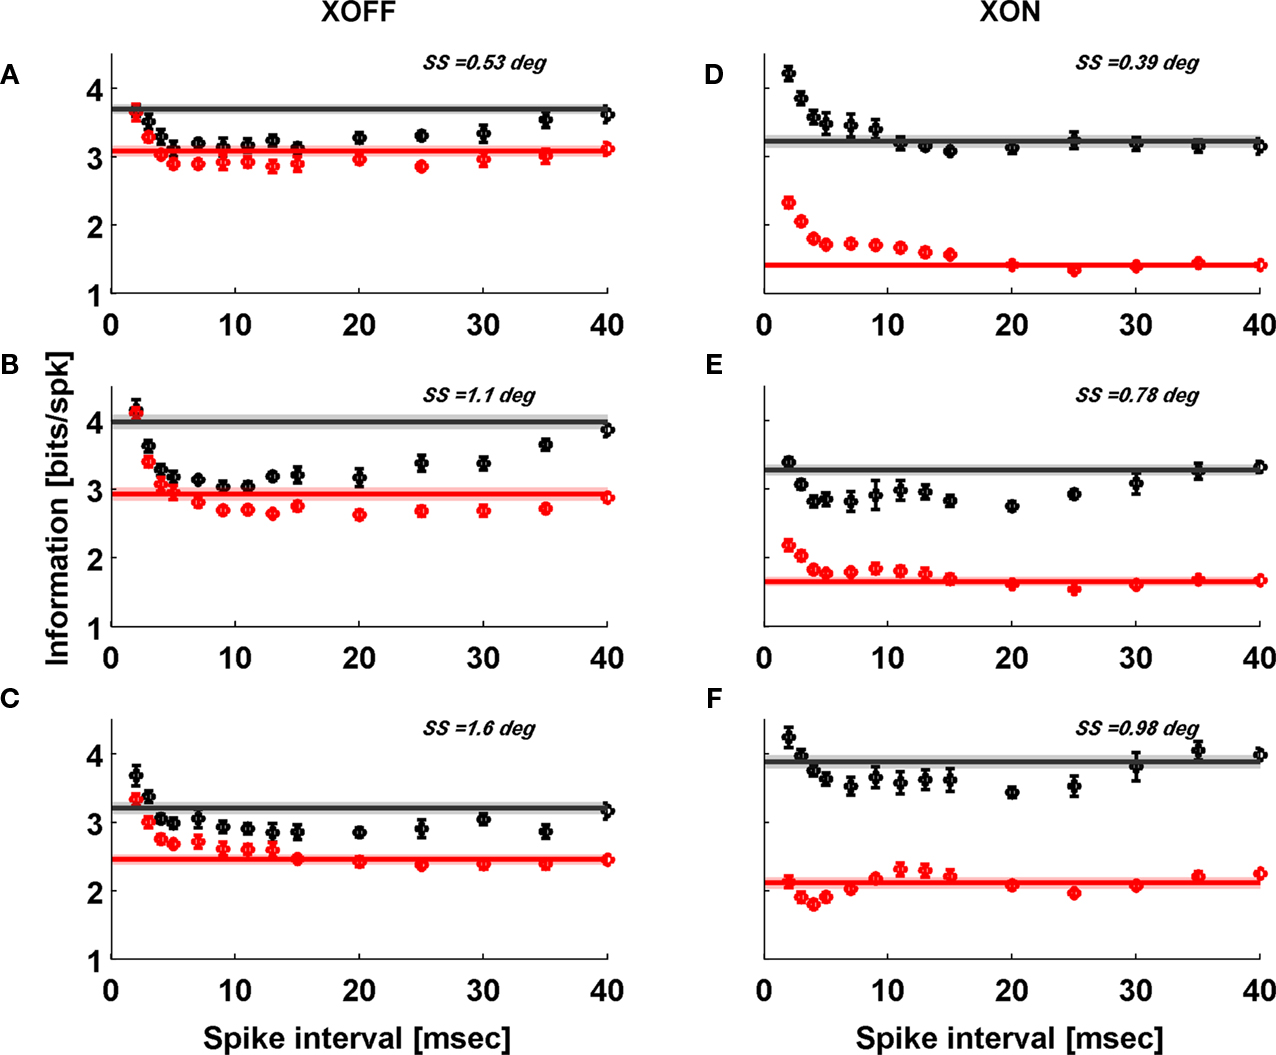
Figure 6. Information contained in pairs of spikes Ipair(τ) is typically synergistic at short inter-spike intervals and redundant at longer intervals. The black data points are for LGN and the red are for RGC. The horizontal lines lie at 2 × Ispike which is what we would expect the value of Ipair to be if the spikes in a pair were independent. The width of this line denotes the ±1σ range on 2 × Ispike. We show results for two representative cells (# 2 and 8, Table 1
). Only three spot sizes (SS) are shown for each cell because at large spot sizes the low firing rate of the LGN prevents us from reliably determining rE(t) and hence Ipair.
Information Rate and Firing Rate
If each spike is thought of as providing information about the stimulus, we would expect information rate to increase with firing rate. We calculated that relationship for all the RGCs and LGN neurons at the various spot sizes we have used. The dependence of information rate on firing rate was weaker and noisier for the retina than for the LGN: the correlation coefficient was 0.58 for the RGC data, and 0.9 for the LGN data.
Summary of Our Results
We have investigated the dependence of information transfer from retina to LGN on stimulus size. We find that for both LGN and retina single spike information (in bits/spike) decreases with increasing stimulus size. The LGN information rate is significantly higher than the retinal one when the stimulus is small, but it decreases faster than the retinal rate with increasing size, so that their difference diminishes for large stimuli. From spike pair information we gather the additional observation that LGN redundancy at larger spike intervals is much more pronounced than for the RGC, which itself shows synergy for spike pair intervals around 10 ms. These paired spike features do not appear to depend much on stimulus size. In terms of single spike information rate, which is connected to information per spike by the firing rate, the LGN does almost as well as the retina, mainly for small stimuli.
We have also considered three types of artificial LGN spike trains obtained from vetting the RGC train in such a way that the artificial spike train has the same number of spikes as the actual LGN train. One vetting procedure, based on the assumption that each LGN spike is the second of a pair of closely following successive RGC spikes, leads to an artificial LGN train whose per spike information content approaches the measured one within 20–30% at low transfer ratios.
Previous Studies of Retina-LGN Transmission
Usrey et al. (1998)
have shown that when an RGC spike follows another within 30 ms or less, the second spike is more likely than isolated spikes to persuade the LGN relay neuron to fire. This observation can account for the fact that, on average, the firing rate of LGN relay neurons is roughly half that of the RGCs that drive them. Our analysis of paired spike events supports the view that much of the retinal information is communicated to the cortex via the LGN by these double spike events, although this might not require any non-linear facilitation of synaptic events at the retino-geniculate synapse (Carandini et al., 2007
; Casti et al., 2008
).
Passaglia and Troy (2004)
investigated how stimulus size affected the information rates transmitted by cat RGCs. We confirm their finding that the surround of the RF, although of comparable information capacity to that of the center, lowered the amount of information that the cell could transmit when the stimulus covered both center and surround (their Figure 7). In other words, the center-surround antagonism of the RF applies not only to the response amplitude but also to the information content (see below).
Sincich et al. (2009)
have investigated the transmission of information from retina to LGN for a small spot stimulus impinging on the RF center of monkey visual neurons. Our results (from cat) for small spots agree with theirs (from monkey), namely, the amount of single spike information per spike is larger for the LGN than for the retina. The fact that the LGN firing rate is lower than that of the retina leads to a quasi-lossless transmission of information in bits per second for some cells (see Figure 3
). Sincich et al. (2009)
avoided the use of large stimuli because they observed that in some cells increasing the stimulus size caused the appearance of new S potentials, presumably from nearby retinal ganglion cells. However, earlier work on the cat (Cleland et al., 1971
) has shown that even when an LGN cell is driven by more than one ganglion cell, most of the spikes in the LGN cell are due to a single ganglion cell, and therefore larger stimuli were unlikely to invalidate our data.
Does the Enhanced Surround of LGN Receptive Fields Play a Role in Information Transmission?
It had been reported previously (Hubel and Wiesel, 1961
; Maffei et al., 1970
; Dubin and Cleland, 1977
; So and Shapley, 1981
; Kaplan et al., 1993
) that compared to the RFs of RGCs, the stronger surround of LGN RFs attenuates primarily low spatial and temporal frequencies, which makes the LGN cell more sharply tuned than the RGC that drives it. Intuitively, one might expect this improved filtering to help in communicating retinal information to the visual cortex, but our results show that as stimulus size grows, information rate does not. In addition, as stimulus size increases, the difference between the single spike information (in bits/spike) for the LGN and retina decreases (Figures 2
C,D). This suggests that the removal of low frequencies is not helpful from the information standpoint, and that the improved filtering is done for other reasons. This is also an indication that most of the information in our stimulus resides in the higher frequency portion of the spectrum.
The lower amount of information delivered with each spike as stimulus size increases, as illustrated in Figure 2
, is due to an increase in the variability of the cellular responses to repeated stimuli. We found that upon going from small to large spot sizes, the time averaged coefficient of variation changed little (≤6%) for the RGCs, but increased by 30% for the LGN. We note that although for a single neuron noise usually corrupts the signal and reduces the signal/noise ratio, a small amount of noise can decorrelate neurons in a population, and thus increase its ability to transmit information (Knight, 1972
).
In addition, we emphasize that we recorded here from single LGN cells, whose receptive fields partially overlapped those of their neighbors. Thus, despite the fact that stimulating the surround of the RF did not increase the information transmitted by our target cell, increasing the stimulus size is likely to increase the information transmitted by the population as a whole, through the stimulation of neighboring neurons.
How Optimal is the LGN Editing Process?
If the LGN relay cell had a way of “knowing” how informative each spike is, it could delete the least informative ones, and thus increase the information content of each spike it transmits to the cortex. A hint at the information content of the retinal discharge that could lead to a good editing process can be found in the Results section, where information rate is shown to be positively correlated with firing rate. To assess how close to optimal transmission was the real LGN performance, we created an artificial LGN spike train by removing from the retinal spike train those spikes that came from the portions of the record that had the lowest spike rate, until the total number of spikes equaled the one fired by the real LGN neuron. We found that the remaining spikes carried, on average, 20–40% more information per spike than the real LGN spikes that we had recorded in the lab. Thus the LGN neuron did not transmit to the cortex as much information as it theoretically could have, and we conclude, again, that its editing policies reflect the need to balance optimal information transmission with other considerations. Those are likely to include energy conservation (Lennie, 2003
) and reduction of redundant information transmitted by the neighboring neurons.
Information Calculations
We were interested in understanding the strategy used by the LGN in determining whether or not to transmit a retinal spike. It was, therefore, natural for us to investigate information transmission in the context of single spike information, although a measure of single spike information does not provide the total information capacity of the cell (Strong et al., 1998
). The total information for our cells is difficult to calculate precisely, especially for the LGN at large spot sizes, as low firing rates limit our ability to acquire sufficient data.
We found that for small stimuli the LGN packs in each spike more stimulus-related information than the retina, but this difference decreases with stimulus size, presumably because of the surround antagonism and increased noise. LGN relay cells edit the incoming retinal spike train in a non-random fashion, which deletes less informative spikes and takes into account the temporal pattern of the RGC discharge. Individual LGN cells transmit less information than an optimal detector could, perhaps relying on other cells to fill in the missing bits.
The authors declare that the research was conducted in the absence of any commercial or financial relationships that could be construed as a potential conflict of interest.
R. Uglesich and A. Casti contributed equally to this work. We thank Y. Goffer for his help with this project. The research was supported by NIH grants EY12264, EY16371, NIGM71558 and Core Grant EY12867.