Visual and motor connectivity and the distribution of calcium-binding proteins in macaque frontal eye field: implications for saccade target selection
Center for Integrative and Cognitive Neuroscience, Vanderbilt Vision Research Center, Department of Psychology, Vanderbilt University, Nashville, TN, USA
The frontal eye field (FEF) contributes to directing visual attention and saccadic eye movement through intrinsic processing, interactions with extrastriate visual cortical areas (e.g., V4), and projections to subcortical structures (e.g., superior colliculus, SC). Several models have been proposed to describe the relationship between the allocation of visual attention and the production of saccades. We obtained anatomical information that might provide useful constraints on these models by evaluating two characteristics of FEF. First, we investigated the laminar distribution of efferent connections from FEF to visual areas V4 + TEO and to SC. Second, we examined the laminar distribution of different populations of GABAergic neurons in FEF. We found that the neurons in FEF that project to V4 + TEO are located predominantly in the supragranular layers, colocalized with the highest density of calbindin- and calretinin-immunoreactive inhibitory interneurons. In contrast, the cell bodies of neurons that project to SC are found only in layer 5 of FEF, colocalized primarily with parvalbumin inhibitory interneurons. None of the neurons in layer 5 that project to V4 + TEO also project to SC. These results provide useful constraints for cognitive models of visual attention and saccade production by indicating that different populations of neurons project to extrastriate visual cortical areas and to SC. This finding also suggests that FEF neurons projecting to visual cortex and SC are embedded in different patterns of intracortical circuitry.
The goal of this investigation was to obtain new information about the anatomical substrate in macaque frontal eye field (FEF) for visual target selection and saccade production. In particular, we sought to obtain information that could guide hypotheses about structure–function relationships in FEF.
FEF in primates consists of an anatomical diversity of neurons distributed across its layers and is distinguished from surrounding areas by both the presence of large pyramidal cells in layers 3 and 5 and the presence of layer 4 (Preuss and Goldman-Rakic, 1991
; Stanton et al., 1989
). Several laboratories have described a diversity of functional types of neurons in macaque FEF including visual, visuomovement, movement, and fixation neurons (Bruce and Goldberg, 1985
; Bruce et al., 1985
; Cohen et al., 2009
; Everling and Munoz, 2000
; Sato and Schall, 2003
; Schall, 1991
; Schall et al., 1995a
; Sommer and Wurtz, 2000
). The role of movement and fixation neurons in contributing to saccade productions is reasonably well understood through studies showing that the activity of these neurons specifies whether and when saccades will be initiated (e.g., Hanes and Schall, 1996
; Hanes et al., 1998
). Movement and fixation neurons have been identified as pyramidal cells located in layer 5 that project to the superior colliculus (SC) and brainstem saccade generator to contribute to saccade production (Segraves, 1992
; Segraves and Goldberg, 1987
; Sommer and Wurtz, 2000
). Thus, these neurons possess anatomical connectivity appropriate to carry out their hypothesized function.
During visual search the activity of visual neurons in FEF distinguishes targets from distractors (Bichot and Schall, 1999
; Sato and Schall, 2003
; Sato et al., 2003
; Thompson et al., 1996
, 2005
). A reconstruction of recording penetrations demonstrates that these visual selection neurons are located in the supragranular as well as infragranular layers (Thompson et al., 1996
). They were recorded with transdural metal electrodes, and based on the electrical sampling properties of these electrodes, the visual selection neurons were most likely pyramidal neurons. It has been hypothesized that FEF visual neurons, with counterparts in other cortical areas and subcortical structures, contribute to the allocation of attention to locations that will be the endpoint of gaze shifts (Schall, 2004
; Thompson and Bichot, 2005
). This hypothesis is consistent with evidence that inactivation of FEF impairs visual search performance (Wardak et al., 2006
) and that electrical stimulation of FEF improves the allocation of attention (Moore and Fallah, 2004
). This influence of FEF on visual processing is mediated most likely through the extensive reciprocal connections that FEF entertains with a diversity of extrastriate visual areas (e.g., Huerta et al., 1987
; Schall et al., 1995a
; Stanton et al., 1995
; Stepniewska et al., 2005
; Ungerleider et al., 2008
). For example, electrical stimulation of FEF influences the activity of neurons in extrastriate visual area V4 (Armstrong et al., 2006
; Moore and Armstrong, 2003
). Similar results have been observed using transcranial magnetic stimulation in humans (Grosbras and Paus, 2002
; Juan et al., 2008
; Muggleton et al., 2003
; Neggers et al., 2007
).
We sought to determine whether this influence of FEF on extrastriate cortex can be exerted directly by the population of neurons in FEF that also deliver saccade command signals to subcortical structures. Therefore, we placed distinct neuroanatomical tracers simultaneously within SC and a portion of extrastriate visual cortex that involved areas V4 and caudal inferior temporal area TEO, and looked for FEF cells labeled by both tracers. The appearance of double-labeled cells would provide evidence that these two functional roles of FEF, namely attention allocation and saccade preparation, are carried out by the same population of neurons. We targeted V4–TEO region because it was the focus of the aforementioned studies on the neural correlates of attention.
To better understand the intracortical circuitry of FEF, we attempted to relate the efferent projections from visual cortex and SC to three different classical groups of inhibitory interneurons found in FEF. As in other cortical areas, the inhibitory circuitry within FEF is GABAergic (Peters and Fairen, 1978
; Ribak, 1978
; Somogyi et al., 1983
). These GABAergic neurons can be distinguished through specific calcium-binding proteins including calbindin (CB), parvalbumin (PV), and calretinin (CR). We examined the laminar distributions of the neurons identified with these particular calcium-binding proteins. This information from FEF can be compared with previous data showing variability across species and cortical areas (Conde et al., 1994
; Defelipe et al., 1999
; Gabbott and Bacon, 1996
; Gabbott et al., 1997
; Glezer et al., 1998
; Hendry et al., 1989
; Hof et al., 1999
; Sik et al., 1995
; Van Brederode et al., 1990
; Yanez et al., 2005
).
Our finding that in macaques efferent cortical and subcortical projections of FEF have different laminar distributions and that none of the neurons projecting to SC also project to extrastriate visual cortex is consistent with what has been reported previously for other cortical areas and species (Bullier et al., 1984a
,b
; Meissirel et al., 1990
, 1991
; Rockland and Drash, 1996
; vogt Weisenhorn et al., 1995
). The description of visual and saccade-related efferent connections in conjunction with the distribution of intrinsic interneurons provides new information bridging the anatomy and physiology of FEF that can guide future reconstructions of neurophysiological recording sites, inform psychological theories of visual attention, and constrain network models of FEF function.
Experiments were performed on four macaque monkeys (Macaca mulatta, M. radiata) of either sex weighing between 6 and 9 kg. All monkeys were adult (5–10 years of age), thus matured beyond the period of major changes in cortical development (e.g., Hof et al., 1999
). Monkeys N, R, and T were used in the tracing study while monkeys N, P, and T were used in immunohistochemical study. The experimental protocol complied with USDA and PHS requirements as approved by the Vanderbilt University Animal Care and Use Committee.
Tracer Injections
The efferent connections of FEF were studied by placing one tracer in the dorsolateral visual cortex (primarily in area V4 but including area TEO) and another tracer in the SC. Experimental details for each monkey are listed in Table 1
. Each animal was initially anesthetized by intramuscular injection of ketamine hydrochloride (10 mg/kg) and intubated before being placed in a stereotaxic apparatus (Kopf; Tujunga, CA, USA). Surgical anesthesia was achieved using 2% isoflurane. All procedures were performed under aseptic conditions.
For cortical injections, the skull was exposed and a bone flap overlying parieto-occipital lobe removed. Dura was cut and exposed brain was digitally photographed. Tracers – 2% wheat germ agglutinin conjugated to horseradish peroxidase in distilled water (WGA-HRP; Sigma, St Louis, MO, USA), 1% cholera toxin subunit B in distilled water (CTB; Sigma), and 2% Diamidino Yellow (DY; Sigma), were loaded into the 5-μl syringe (Hamilton; Reno, NV, USA) cemented to a glass micropipette. The syringe was mounted onto an electrode holder and lowered into the cortex. Tracer was then pressure injected, first at depth of 1.0 mm and then 1.5 mm, under the assumption that the uptake zone would include both superficial and deep layers, but the underlying fibers would not be damaged. All injections were made under visual control in 10–15 locations in the dorsolateral visual cortex into the region of V4–TEO as judged by sulcal landmarks (Desimone and Ungerleider, 1986
; Gattass et al., 1988
; Stepniewska et al., 2005
). Sites of injections were marked on the photograph of the brain that was used in the preparation of final reconstructions.
For the SC injections, we used either 1% CTB or 10% Fluororuby (FR; Molecular Probes, Eugene, OR, USA) in distilled water. These injections were made using a 1-μl Hamilton syringe positioned to stereotaxic coordinates (x: 0; y: 0; z: +10) guided by MRI.
After injections, the cortex was covered with gelfilm, the opening in the skull was closed with dental acrylic, and the skin was sutured. Monkeys were then given precautionary antibiotics and were carefully monitored during recovery from anesthesia. Four (when WGA-HRP was injected) to 10 days after the injections, the animals were deeply anesthetized with a lethal dose of sodium pentobarbital and perfused intracardially with warm phosphate-buffered saline (pH 7.4), followed by a 2% (when cortex was flattened) or 4% paraformaldehyde in buffered saline, and 2% paraformaldehyde with 10% sucrose. The brain was removed immediately, blocked, and immersed in 30% sucrose in 0.1 M phosphate buffer (pH 7.4) at 4°C.
Histology and Architectonics
The whole brain of monkey R and the frontal part of the brain (containing FEF) of monkey N and T were sectioned on a freezing microtome at 50 μm increments in the sagittal plane. The posterior part of the cortex (containing V4–TEO) of monkey N and T was separated from the rest of the brain, manually flattened as described previously (Sakai et al., 2000
; Stepniewska et al., 2003
), and cut at 50 μm thick frozen sections parallel to the cortical surface. Sections were mounted unstained for detection of fluorescence (DY and FR) or processed to reveal WGA-HRP (Gibson et al., 1984
) and CTB (Bruce and Grofova, 1992
). To reveal the architectonic features of the brain structures in each case, a series of adjacent sections were processed for myelin (Gallyas, 1979
), and cytochrome oxidase (Wong-Riley, 1979
), Sagittal sections were additionally processed for acetylcholinesterase (Geneser-Jensen and Blackstad, 1971
) and Nissl substance to reveal lamination of FEF (Preuss and Goldman-Rakic, 1991
). Interleaved sections stained for myelin were also used to determine that the injection sites did not invade white matter.
The locations of labeled cells were plotted at high resolution with a fluorescent Leitz microscope coupled to an X–Y encoder and a Macintosh computer running Igor Pro software (Wave Metrics, Inc.). For identification of fluorescent tracers we used 360 nm (for DY) and 530–560 nm (for FR) wavelength excitation filters. Neurons labeled with WGA-HRP or CTB were plotted with bright field illumination. Patterns of connections were aligned with architectonic borders (laminar, and area l) drawn from adjacent sections. Images of plotted sections were processed using Illustrator software (Adobe, Inc.). Images of brain sections were captured with a Nikon digital camera DFM1200F mounted on a microscope. The digitized images were adjusted for brightness and contrast, but they were not otherwise altered.
Immunohistochemistry
The immunohistochemical staining procedures were completed in three monkeys: N, T, and P. The 50-μm free-floating sections were processed according to immunohistochemical methods targeting calcium-binding proteins (Andressen et al., 1993
; Celio, 1990
). Thus, sections were preincubated in Tris-buffered saline (TBS; pH 7.4) containing 0.25% Triton-X 100 (TX-100) and 1.5% serum (normal horse serum, NHS) for 1–2 h at room temperature, and then incubated for 1 day at room temperature in TBS containing 0.25% TX-100, 1.5% NSH, and the primary antibody (2 μl/10 ml of 1.5% NHS in TBS) obtained from Swant (Bellinzona, Switzerland). After rinsing, sections were transferred to 0.05 M TBS containing 0.25% TX-100 and secondary antibody (horse anti-mouse) in concentration 1:200 for 1 h. Then, sections were placed in the Vectastain ABC kit (Vector Laboratories; Burlingame, CA, USA) completed with a solution of 0.05% TBS (containing 0.25% TX-100). Visualization of labeled cells containing calcium-binding proteins was made by using diaminobenzidine in Tris-buffer containing 0.003% hydrogen peroxide. Finally, sections were mounted on slides, dehydrated in xylene, and coverslipped. Control sections were reacted in the same way but were not incubated in the primary antibodies. Locations and number of immuno-positive neurons within FEF were plotted at high resolution with a Leitz microscope coupled to an X–Y encoder.
We quantified the density of immunoreactive neurons in different layers by counting the number of CR-, CB-, and PV-labeled cells in the rostral bank of the arcuate sulcus within both hemispheres of three monkeys. For each immunoreaction (CB, CR, and PV) photomicrographs of regions of FEF were made under 40× total magnification (Figures 4
D, 5
D, and 6
D). In each cortical sample, immunoreactive neurons were counted in a grid 500 μm wide extending from the pial surface to the white matter, subdivided into 20–30 bins of 100 μm depth to span the cortical depth. Laminar borders were determined from adjacent Nissl-stained sections (Figures 4
E, 5
E, and 6
E) according to previously described criteria (Preuss and Goldman-Rakic, 1991
; Stanton et al., 1989
). Each bin in each grid used for counting was then assigned to the appropriate layer. Counts were completed in 11 sections per antibody (with 2 to 3 grids per section for a total of 35 grids per antibody). This procedure resulted in total counts of 3904 CB-, 6605 CR-, and 3629 PV-labeled cells. Abercrombie and Johnson’s (1946)
first correction method was used to account for counting error incurred by labeled cells of different sizes spanning several sections.
Finally, for each inhibitory cell type, a subsample of cells was measured under 10× objective and 10× ocular magnification. For each of the 12 sections (4 per cell type), one grid was randomly placed and the cells were measured within each of the bins of the grid, representing a total of 181 CB cells, 442 CR cells, and 159 PV cells. For consistency, cell size was measured from the tip of the axon hillock, which was always visible in labeled neurons, to the opposite surface. Measured cells were assigned to layers in the same way as the cell counts were.
Analysis of variance (ANOVA) was used to analyze whether cell density or size varied significantly across layers and across the region of FEF. To test for variation of cell density, we performed six three-way ANOVAs: one for each combination of antibody and section orientation (coronal or sagittal). The factors were layer, proximity to fundus or convexity, and either rostrocaudal location across coronal sections or mediolateral location across sagittal sections. To test for variation of cell size, we performed six two-way ANOVAs: one for each antibody and section orientation (coronal or sagittal). The factors were layer and either rostrocaudal location across coronal sections or mediolateral location across sagittal sections. To correct for false positives resulting from multiple comparisons, we used a Bonferroni corrected p-value of 0.0008 (0.01/12) for significance testing.
FEF Neurons Innervating Area V4 and SC
We determined the laminar distribution of FEF neurons labeled by simultaneous injections of different retrograde tracers in the SC and extrastriate visual areas V4 and TEO in three macaque monkeys. For two of these monkeys the tracers injected in both SC and V4 successfully transported to the FEF. Unfortunately, in the third monkey (T) the tracer injected into SC was not transported (Table 1
), so partial data for this case will be described. The uptake regions for injected tracers are shown in Figure 1
. The dorsal view of the SC injection site was reconstructed from 23 coronal sections in the first case (N) and from 19 sagittal sections in the second case (R). In both monkeys N and R injections covered an area in the central portion of the SC, spanning the superficial and intermediate layers. Cortical injections resulting in FEF labeling were made in the dorsolateral visual cortex (Figures 1
B,D,E), just anterior to the lunate sulcus and posterior to the superior temporal sulcus in the vicinity of area V4 and caudal TEO (Desimone and Ungerleider, 1986
; Gattass et al., 1988
; Stepniewska et al., 2005
). In none of the cases did the injection site penetrate white matter.
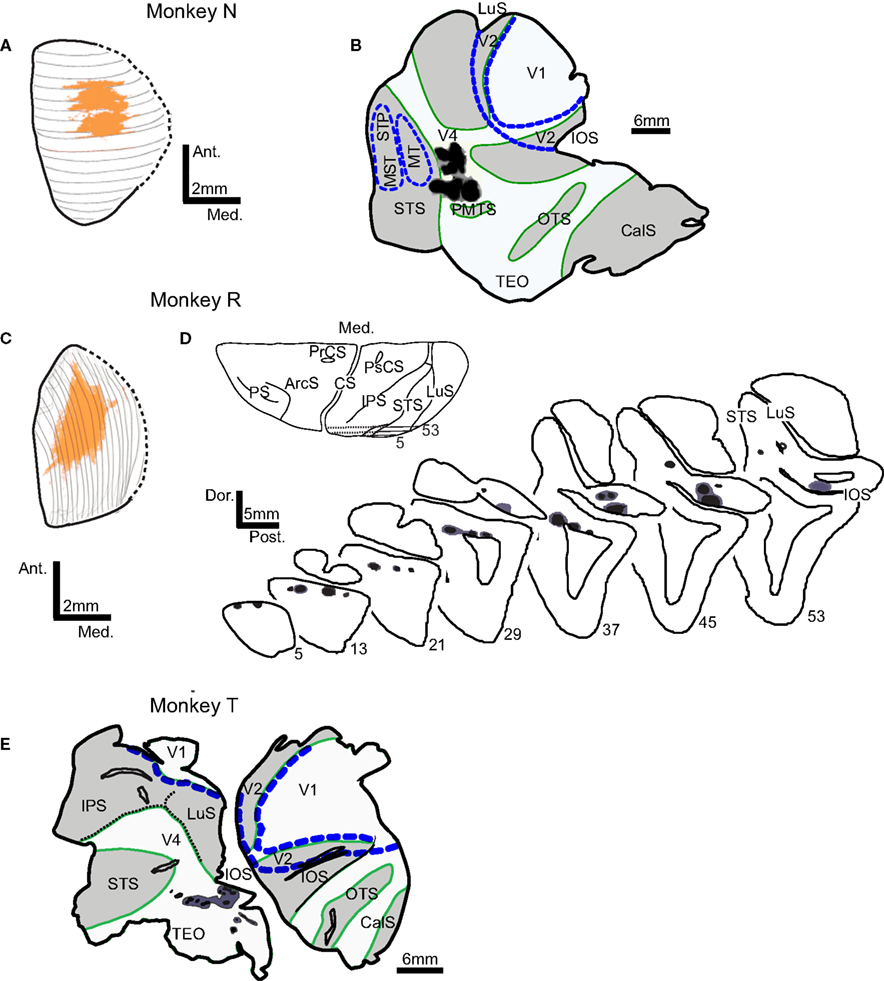
Figure 1. Locations of tracer injection sites in the superior colliculus (SC) and extrastriate visual areas V4 and TEO. Injection sites in monkeys N and R are shown on the dorsal view of SC reconstructed from the series of (A) coronal or (C) sagittal sections. In both monkeys, injections in SC (orange) cover the central part of SC. Injections in visual cortex (injection zone – black, diffusion zone – dark gray) are shown on the surface view of flattened cortex (B,E) and on the series of sagittal sections (D). Borders of areas V1, V2, MT, and MST/STP (blue dashed lines) were determined from adjacent sections stained for cytochrome oxidase and myelinated fibers. In flattened cortex opened sulci are shaded light gray and outlined in green. Abbreviations used are as follows:ArcS – arcuate sulcus, CS – central sulcus, CalS – calcarine sulcus, IOS – inferior occipital sulcus, IPS – intraparietal sulcus, LuS – lunate sulcus, MST – middle superior temporal visual area, MT – middle temporal area, OTS – occipito-temporal sulcus, PMTS – posterior medial temporal sulcus, PrCS – precentral sulcus, PS – principal sulcus, PsCs – postcentral sulcus, STS – superior temporal sulcus, Visual areas: MST – middle superior temporal visual area, MT – middle temporal area, STP – superior temporal polysensory area, TEO – caudal inferotemporal area, V1 – primary visual area, V2 – second visual area, V4 – fourth visual area.
As expected (Fries, 1984
), the SC injection labeled numerous neurons in the anterior bank of the arcuate sulcus, where the macaque FEF has been previously described (Bruce et al., 1985
) (Figure 2
). Labeled neurons were also found anterior to FEF extending into the fundus of the principal sulcus and posterior to FEF in premotor cortex. In FEF, most of the labeled neurons clustered along the arcuate sulcus to the fundus. As noted previously, all of the neurons projecting to SC were in layer 5.

Figure 2. Distribution of neurons labeled by CTB injection in SC (red) and by WGA-HRP injection in area V4 (green) in monkey N shown on a series of sagittal sections through the frontal cortex arranged from lateral (A) to medial (H). Layer 4 is indicated by a thin black line, and the cytoarchitectonic borders of FEF are indicated by dashed lines. Sections from (A) to (H) had the greatest concentration of overlapping neurons projecting to SC and V4. Note that only neurons in layer 5 project to SC, whereas most neurons projecting to V4 are located in layers 2/3 with very few in layer 5. Sulci abbreviations follow the convention used in Figure 1
.
In contrast to the dense FEF projection to SC, the FEF projections to the region of area V4 and TEO were relatively sparse (Figure 2
). The neurons labeled by V4 injections were mainly clustered in the anterior bank of the arcuate sulcus with another cluster in area 8Ar on the rostral convexity of the arcuate sulcus. In FEF the contiguous zone of neurons projecting to V4 coincided in columns with neurons projecting to SC. No neurons in premotor cortex were labeled by tracer injections in V4 and TEO. As previously reported, the FEF projections to V4 arise mainly in the neurons of supragranular layers with some scattered neurons in deeper layers (Barone et al., 2000
). On average we found that 26% of FEF neurons projecting to V4/TEO were in layers 5 or 6 [case 1 – 22% (31/142); case 2 – 35% (32/92); case 3 – 19% (24/106)]; however, all these neurons were located deeper in layer 5 than neurons projecting to SC. No double-labeled neurons projecting to both V4 and SC were found (Figure 3
).
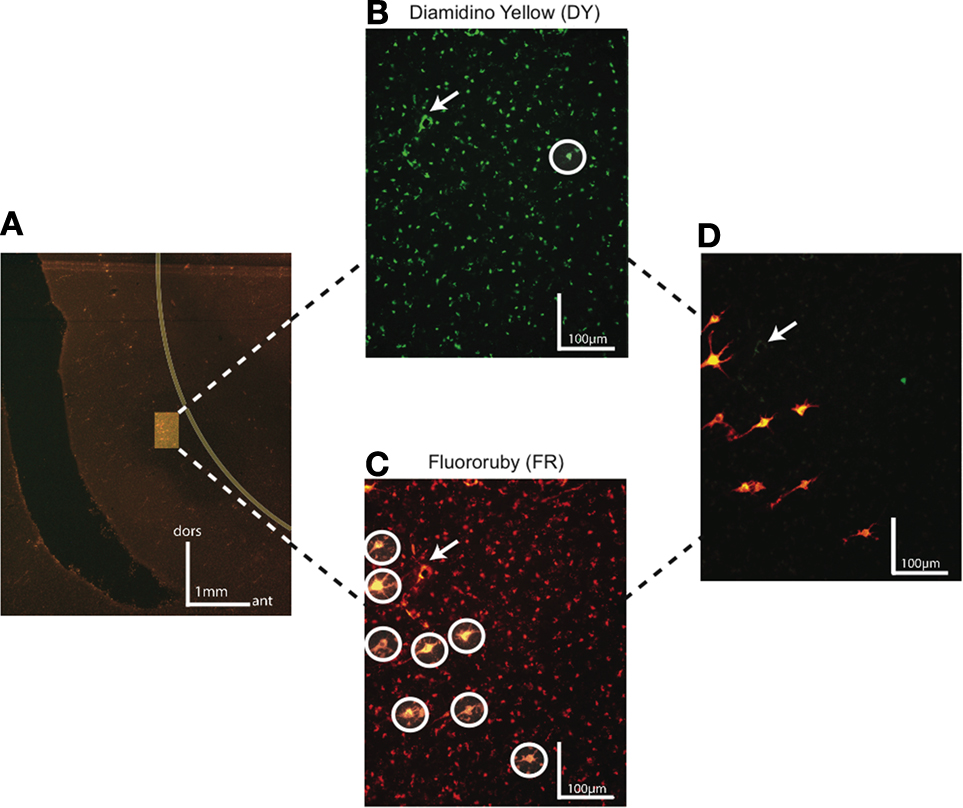
Figure 3. Dark field photomicrographs of FEF neurons labeled by injections in SC and area V4 in monkey R. (A) Low magnification of FEF region with highlighted infragranular layers containing Diamidino yellow (DY) and Fluororuby (FR) labeled neurons projecting to V4 and SC, respectively. The border between gray and white matter is represented by a yellow line. The scale bar shows the orientation of dorsal (dor) and anterior (ant) for this section. (B) High magnification photomicrograph of FEF neurons labeled with DY injected in V4. (C) High magnification photomicrograph of FEF neurons from the same region as (B) labeled with FR injected in SC. In both (B) and (C) labeled neurons are circled in white to distinguish from surrounding artifacts. (D) DY and FR labeled neurons on a superimposed photomicrograph of (B) and (C). In (B–D), the white arrow marks an artifact present on each section and noticed under both DY and FR filters. No double-labeled neurons were found.
Inhibitory Interneurons in FEF
Morphology of calretinin neurons
The most frequently observed CR immunoreactive neurons are found in layers 1 and 2 and have vertically oriented, oval, 4–15 μm long, cell bodies (Figure 4
). In layer 3, each pole of the soma gives rise to a single, thick dendrite that tends to bifurcate a short distance away from the soma with each branch subsequently divided again producing two tufts of beaded dendrites. Many of these dendrites could be followed up to 200 μm. The thin, finely beaded axons of CR neurons were invariably oriented in a descending fashion, and some of them could be followed into layer 4. The few horizontally spreading collaterals generally did not extend beyond the width of the dendritic arbor. CR neuron size varied significantly across layers for coronal sections [F(4,1) = 4.9, p < 0.0008] or nearly significantly for sagittal [F(4,1) = 4.1, p = 0.0029] sections. However, there were no significant differences in CR neuron size across the rostrocaudal [F(4,1) = 2.8, p > 0.05] or mediolateral [F(4,1) = 0.2, p > 0.05] expanse of FEF. On average, the largest CR-labeled neurons were in layers 2, 3, and 6 (Table 2
).
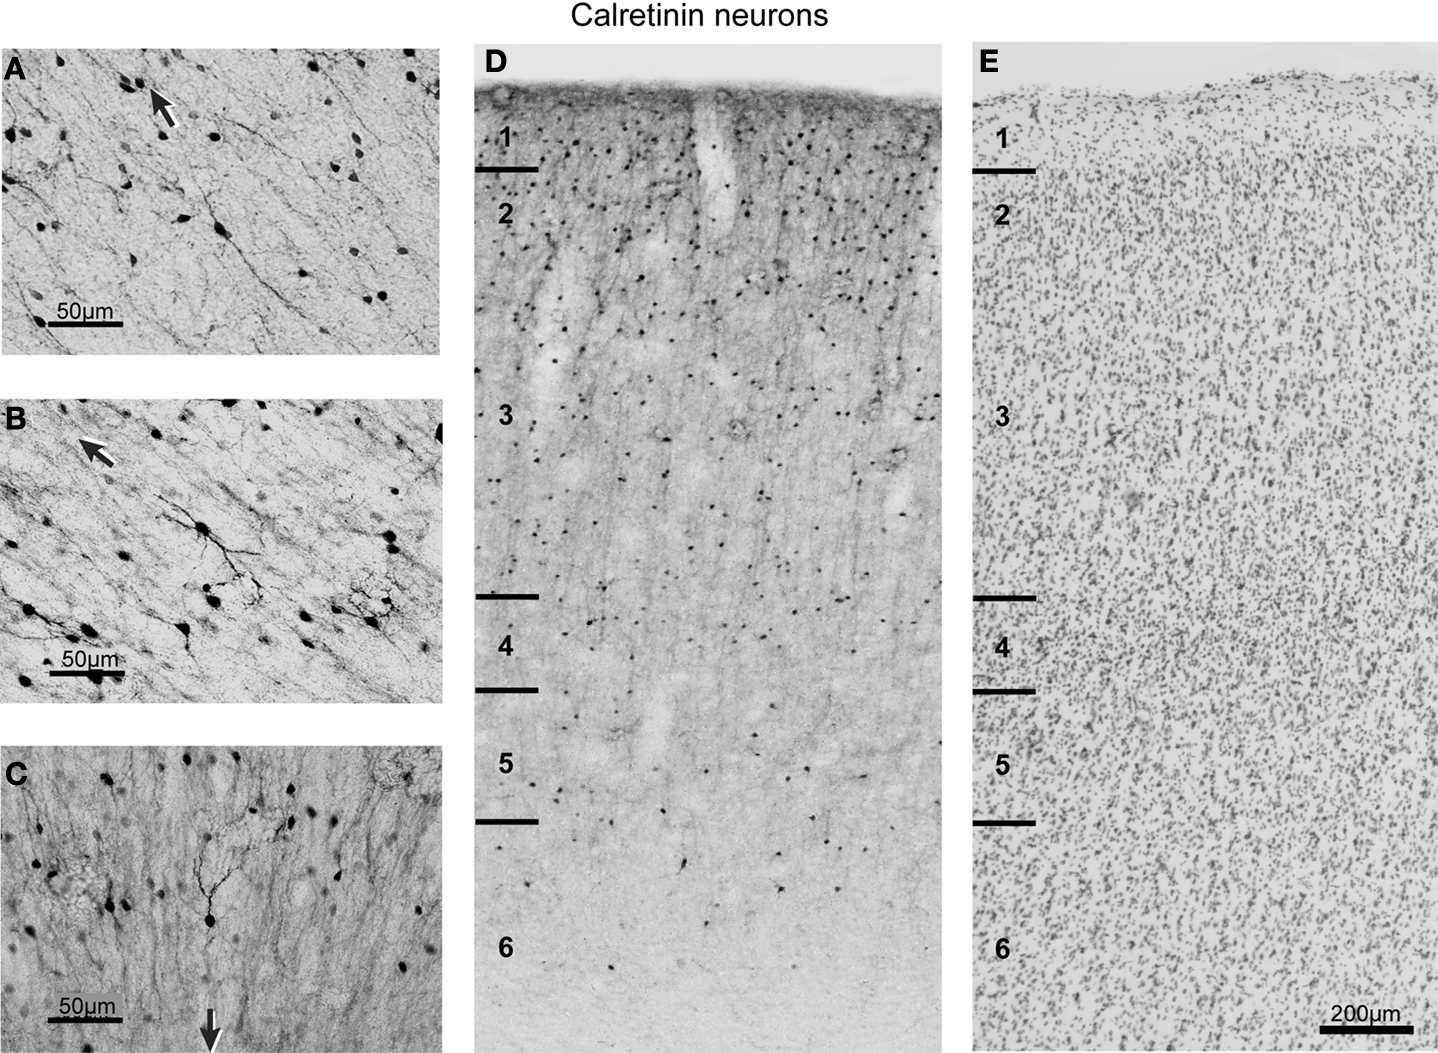
Figure 4. Brightfield photomicrographs of CR-labeled neurons in FEF. (A–C) High magnification of different morphological classes of CR-labeled neurons found in FEF. The black arrow in each panel points toward the pial surface. (D) Distribution of the CR-labeled neurons across the cortical layers. The laminar borders are drawn from adjacent Nissl sections (E) and are marked with short solid lines on the left of diagrams. Note the densest distribution of CR-labeled neurons in supragranular layers.
Morphology of calbindin neurons
Consistent with previous description of other cortical regions in both monkey and human brains (Defelipe et al., 1999
; Freund et al., 1990
; Hayes and Lewis, 1992
; Hof and Morrison, 1991
), we detected CB immunoreactivity in subpopulations of both pyramidal and non-pyramidal FEF neurons, all of which were 3–16 μm long (Figure 5
). Labeled pyramidal cells were identified by the presence of an apical dendrite and a characteristically triangular-shaped cell body (Figure 5
B). These pyramidal neurons were in general only lightly immunoreactive. In contrast, most of the non-pyramidal CB neurons were intensely immunoreactive and were reliably distinguishable from the labeled pyramidal cells. The most common group of immunoreactive neurons had a multipolar cell body with four to six relatively thin, radially oriented dendrites. When an axon could be identified, it was typically faintly immunoreactive, descending in orientation, and could be followed for <30 μm. In counting CB neurons we did not distinguish pyramidal from non-pyramidal neurons. CB neuron size varied significantly across layers for coronal sections [F(5,3) = 8.5, p < 0.0008] but not for sagittal sections [F(4,3) = 2.36, p > 0.05]. CB neuron size also varied significantly across the rostrocaudal [F(5,3) = 7.3, p < 0.0008] and mediolateral [F(4,3) = 7.1, p < 0.0008] dimensions of FEF. On average, the largest CB-labeled neurons were in layers 2 and 3 (Table 2
).
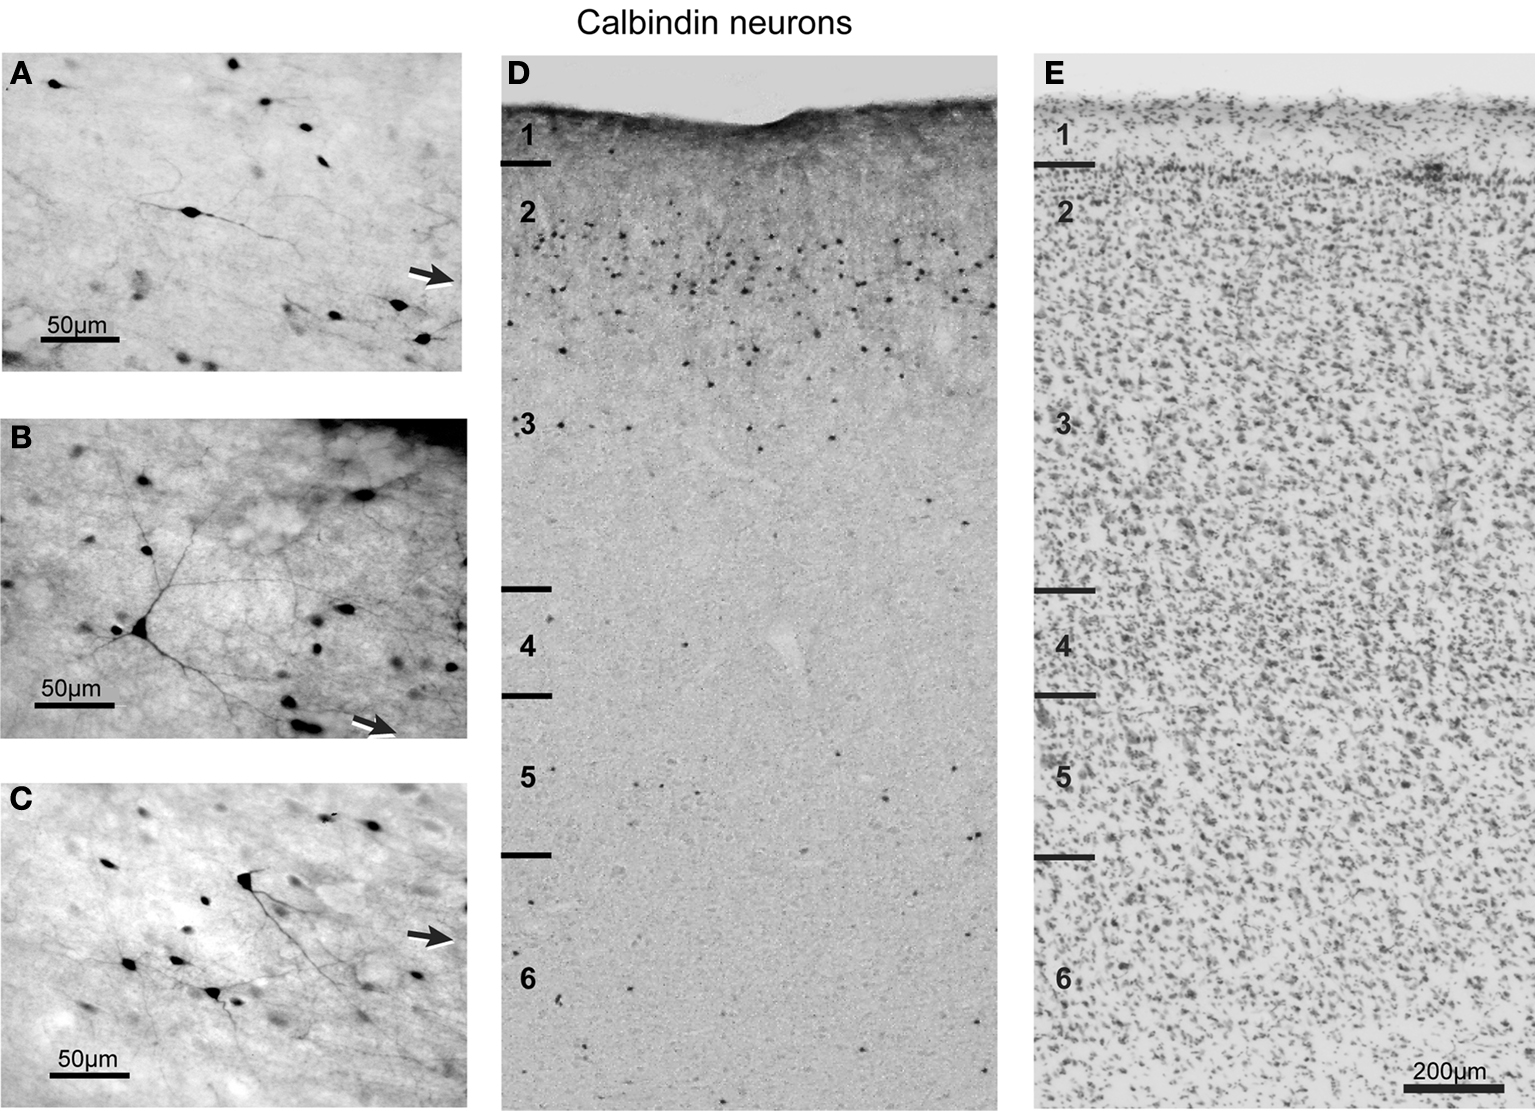
Figure 5. Brightfield photomicrograph of CB-labeled neurons in FEF. Most of these neurons are present in layers 2 and 3. Conventions as in Figure 4
.
Morphology of parvalbumin neurons
The population of PV immunoreactive neurons could be distinguished from CB and CR neurons on the basis of certain distinct features (Figure 6
). PV neurons had larger, 4–25 μm, multipolar cell bodies with a very well stained axon originating directly from the soma through a small axonal cone. In most cases the main axonal trunk ascended radially. The small PV neurons were found throughout all layers, whereas large multipolar PV neurons were more common in layers 3–6 (Table 2
), although cell size did not vary significantly across layers [F(5,3) = 2.0, p > 0.05 for coronal sections; F(3,1) = 1.6, p > 0.05 for sagittal sections]. Similarly, PV-labeled cell size did not vary significantly across the rostrocaudal [F(5,3) = 4.3, p > 0.008] or mediolateral [F(3,1) = 0.04, p > 0.05] extent of FEF.
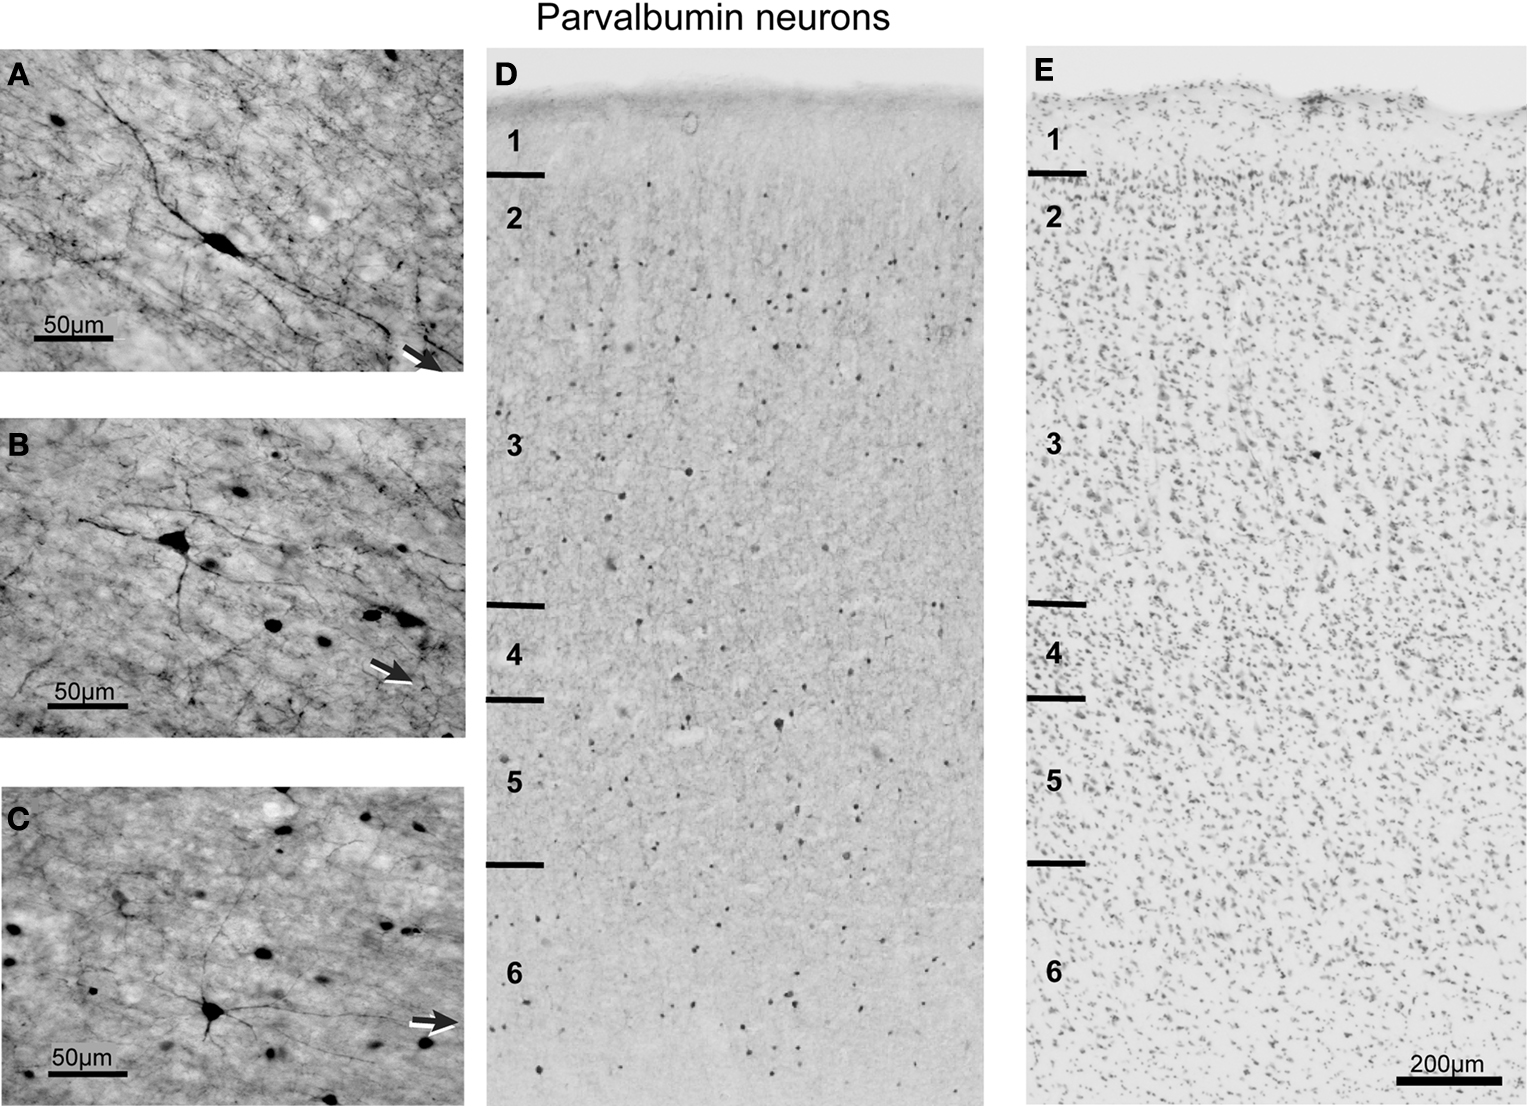
Figure 6. Brightfield photomicrograph of PV-labeled neurons in FEF. Note the quite uniform distribution of PV-labeled neurons across the layers. Conventions as in Figure 4
.
Laminar distribution of inhibitory neurons
Although comparisons across antibodies must be made with caution, the density of CR neurons was approximately twice that of CB and at least five times that of PV neurons. This result contrasts with findings in other visual areas such as V1, V4, and MT, wherein the densities of CR and CB neurons are more similar, and both CB and CR neurons are less dense or roughly as dense as PV-labeled cells (Kondo et al., 1999
).
In agreement with previous results (Dombrowski et al., 2001
; Gerbella et al., 2007
), the density of CR, CB, and PV neurons varied significantly across layers of FEF (Figure 7
). As shown previously for other cortical areas in macaques and humans (e.g., Conde et al., 1994
; Gabbott and Bacon, 1996
; Gabbott et al., 1997
), neurons labeled by CR were most dense in the superficial layers 1–3. The density of CR-labeled neurons decreased through the middle-third of layer 3 and was fairly uniform in layers 3–5. Layer 6 contained the lowest density of CR neurons (Figures 4 and 7
D). The intensity of CR immunoreactivity of the cell bodies did not appear to differ across cortical layers. The density of cells labeled with CR showed significant variation across layers [F(2,5,5) = 70.1, p < 0.0008 for sagittal sections; F(2,5,2) = 29.0, p < 0.0008 for coronal sections].
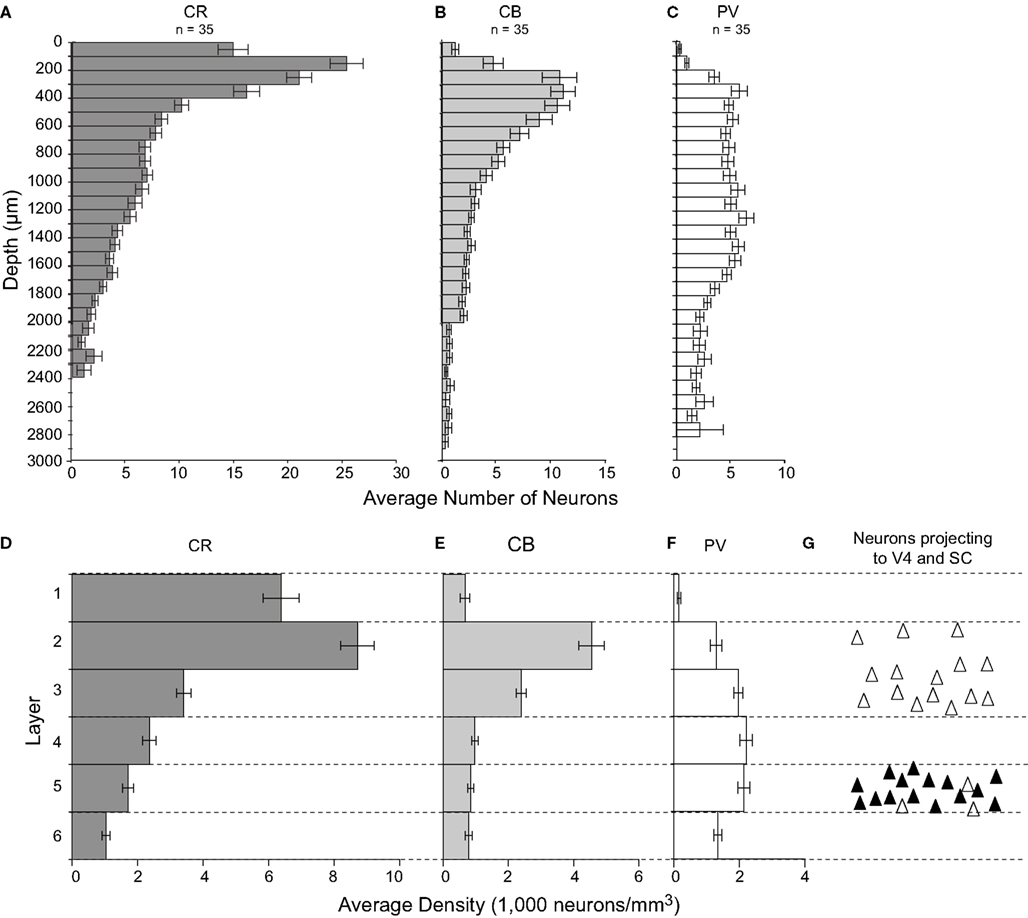
Figure 7. Histograms illustrating the laminar distribution of CR-, CB-, and PV-labeled neurons in FEF. (A–C) Each bar represents the average number of neurons in 100 μm thick by 500 μm wide nonoverlapping cortical areas beginning at the pial surface. For each graph, n represents the number of samples in which labeled cells were counted. (D–F) Bars represent the density of neurons in each layer, and the thickness of the bars has no relationship to the thickness of the layer. Notice the difference in laminar distribution of different populations of calcium-binding proteins. (G) A schematic distribution of FEF neurons projecting to SC (black triangles) and to V4 (white triangles).
Similar to results seen in other cortical areas (e.g., Conde et al., 1994
; Dhar et al., 2001
; Gabbott and Bacon, 1996
), CB neurons were only rarely seen in layer 1 with the peak density in layers 2 and 3, while in layers 4–6 the density of CB neurons was relatively low and uniform (Figures 5 and 7
E). This variation in CB neuron density was significant [F(2,5,4) = 52.8, p < 0.0008 for sagittal sections; F(2,5,7) = 25.5, p < 0.0008 for coronal sections].
Finally, the laminar distribution of PV neurons differed drastically from that of CR or CB neurons, and differed more subtly from the PV neuron distribution in other cortical areas (e.g., Conde et al., 1994
; Defelipe et al., 1999
; Dhar et al., 2001
; Lewis and Lund, 1990
), showing a paucity in layer 1 and upper layer 2 and a much more uniform density across the deeper layers (Figures 6 and 7
F). The variation in PV neuron density across layers was also significant [F(2,5,6) = 45.1, p < 0.0008 for sagittal sections; F(2,5,5) = 6.6, p < 0.0008 for coronal sections].
We detected no variation along the dorsoventral extent of FEF in the density of CB-labeled [F(2,4,5) = 1.8, p > 0.05 for sagittal sections; F(2,5,7) = 1.0, p > 0.05 for coronal sections], CR-labeled [F(2,5,5) = 1.3, p > 0.05 for sagittal sections; F(2,5,2) = 3.3, p > 0.05 for coronal sections], or PV-labeled cells [F(2,5,6) = 0.2, p > 0.05 for sagittal sections; F(2,5,5) = 0.6, p > 0.05 for coronal sections]. Similarly, we measured no significant variation in density across the mediolateral extent of FEF for CB-labeled [F(2,5,4) = 0.7, p > 0.05], CR-labeled [F(2,5,4) = 1.3, p > 0.05], or PV-labeled cells [F(2,5,6) = 1.1, p > 0.05]. Finally, the cell density did not vary significantly across the rostrocaudal extent of FEF [F(2,5,7) = 0.5, p > 0.05 for CB; F(2,5,2) = 5.3, p > 0.0008 for CR; F(2,5,5) = 4.4, p > 0.0008 for PV].
We investigated the anatomical substrate of macaque FEF function by examining the relationships between the distribution of two important efferent projections of FEF – into the region of extrastriate visual area V4/TEO and into the SC – and the typology and localization of local GABAergic circuitry in FEF. Our results have shown that populations of FEF neurons projecting to SC and V4 are distinct and distributed within different layers, confirming the common characteristic of cortico-cortical and cortico-subcortical projection systems (Barone et al., 2000
; Bullier et al., 1984b
; Meissirel et al., 1991
; Rockland and Drash, 1996
; vogt Weisenhorn et al., 1995
). Specifically, only layer 5 FEF neurons are the source of projections to SC, whereas the neurons projecting to V4 are mainly within the supragranular layers of FEF, and less frequently in layer 5. None of the layer 5 neurons labeled by the tracer injection in V4 were also labeled by the tracer injection in SC. However, the absence of double-labeled cells could be due to a lack of retinotopic correspondence of the injection sites in V4 (central vision) and SC (more peripheral vision). In fact, other work has described fewer cells labeled in FEF by more central field injections in V4 than by peripheral field injections (e.g., Stepniewska et al., 2005
; Ungerleider et al., 2008
). We believe this concern is mitigated by the fact that the visual field map in FEF is poorly structured (e.g., Bruce et al., 1985
; Schall et al., 1995b
). This means that neighboring points in FEF can project to non-neighboring points in V4 and SC. Furthermore, in many sections we found neurons in the same radial column of FEF labeled by injections in SC and V4, providing the opportunity to observe double-labeled cells.
These connectivity results were supplemented by a quantitative description of the density distribution of GABAergic interneurons in FEF identified with calcium-binding proteins. The large majority of inhibitory interneurons in FEF share a superficial laminar distribution with the neurons projecting to V4, whereas fewer but larger inhibitory interneurons are colocalized in deep layers with the neurons that project to SC.
From a broad perspective these results are not surprising. However, it is well known that patterns of extrinsic connectivity and intrinsic neuron types and density vary across cortical areas, even within the prearcuate gyrus (e.g., Dombrowski et al., 2001
; Douglas and Martin, 2004
; Medalla and Barbas, 2006
), so these data contribute specific new knowledge about the extrinsic and intrinsic circuitry of FEF in macaque monkeys. Besides specific novelty, these results are important for guiding models of the intrinsic and extrinsic interactions of FEF that mediate visual target selection and saccade production (Brown et al., 2004
; Hamker, 2004
, 2005
; Hamker and Zirnsak, 2006
; Heinzle et al., 2007
; Mitchell and Zipser, 2003
) and thereby informing or constraining cognitive models of attention and saccade production.
Intrinsic Circuits and FEF Function
Although many details remain unknown, a number of positive statements can be made about the laminar distribution of FEF neurons with different physiological properties. Most certainly pyramidal neurons in layer 5 of FEF that project to the brainstem carry movement and fixation signals (Segraves, 1992
; Segraves and Goldberg, 1987
; Sommer and Wurtz, 2000
). Evidence also seems clear that at least in some parts of FEF other layer 5 pyramidal neurons projecting to SC are visually responsive (Sommer and Wurtz, 2000
). Thus, layer 5 neurons in FEF are functionally heterogeneous. We can also be confident based on a reconstruction of electrode penetrations that pyramidal neurons in the supragranular as well as infragranular layers perform visual target selection (Thompson et al., 1996
). These observations provide a framework in which to interpret the current results.
The fact that infragranular neurons in FEF project to extrastriate cortex is consistent with either of two possibilities. First, these infragranular neurons may produce presaccadic movement-related activity, sending a signal of saccade preparation to extrastriate cortex. Second, if these infragranular neurons signal only target selection, then extrastriate cortex would not receive a saccade command. Current data does not allow us to distinguish between these two alternatives.
Another framework for interpreting the present results is the nature of models of visual search. It is not completely understood how a visual target is selected, but typical models of visual search employ inhibition within networks of units representing different locations (e.g., Cave, 1999
; Cutzu and Tsotsos, 2003
; Itti and Koch, 2000
; Koch and Ullman, 1985
; Wolfe, 1994
). A signature of such lateral inhibition has been described in the suppressive surround of visually responsive neurons in FEF (Schall et al., 1995b
, 2004
). It is attractive to postulate that lateral inhibition arises from intrinsic circuitry. Within prefrontal cortex, CB, CR, and PV neurons typically have distinct morphologies (Conde et al., 1994
; Defelipe et al., 1999
; Lewis and Lund, 1990
; Lund and Lewis, 1993
). We observed that the distribution of different classes of inhibitory interneurons varies significantly across layers of FEF. The supragranular layers of FEF contain the highest density of CR and CB neurons, whereas PV neurons are relatively more concentrated in the intermediate and deep layers. It is possible that the high spontaneous and driven activity of basket or chandelier neurons, labeled by PV, delivered to the postsynaptic soma or axon initial segment (Defelipe et al., 1999
) contributes to the potent inhibition of movement-related neurons that is observed when multiple saccades must compete (Schlag et al., 1998
) and is necessary according to a neural network model of saccade inhibition in a stop signal (countermanding) task (Boucher et al., 2007
). However, considering that CR neurons in area V1 form synapses with pyramidal cells in layer 5 (Meskenaite, 1997
), we cannot attribute infragranular inhibition purely to PV neurons.
While the functional significance remains unknown, supragranular pyramidal neurons projecting to extrastriate cortex and infragranular pyramidal neurons projecting to SC are embedded in quite different local inhibitory circuits. The present results highlight the need to distinguish the properties of neurons in different layers of FEF as well as other sensorimotor cortical areas.
FEF Connectivity and Models of Attention
Few would argue that covert orienting of attention and overt orienting of gaze are not guided by common selection mechanisms and coordinated in time (Deubel and Schneider, 1996
; Dore-Mazars et al., 2004
; Henderson, 1991
; Hoffman and Subramaniam, 1995
; Hunt and Kingstone, 2003
; Klein, 1980
; Kowler et al., 1995
; Peterson et al., 2004
; Rizzolatti, 1983
; Sheliga et al., 1994
; Shepherd et al., 1986
). The oculomotor readiness or premotor theory of attention explains this relationship by positing that orienting attention is accomplished by the same mechanism that shifts gaze (Craighero and Rizzolatti, 2005
). Testing the premotor theory requires specifying the anatomical level at which this mechanism maps onto the brain. If the mechanism refers to a particular population of neurons instantiating saccade preparation, then the results of this experiment challenge that claim. This conclusion is based on three pieces of evidence: (1) saccade commands are issued by layer 5 pyramidal neurons in FEF (Hanes and Schall, 1996
; Hanes et al., 1998
; Segraves, 1992
; Segraves and Goldberg, 1987
; Sommer and Wurtz, 2000
); (2) FEF influences attention by projections to areas V4 and TEO (Armstrong et al., 2006
; Grosbras and Paus, 2002
; Moore and Armstrong, 2003
; Moore and Fallah, 2004
; Silvanto et al., 2006
); and (3) the present evidence that we found few layer 5 neurons in FEF projecting to V4 + TEO and no double-labeled neurons projecting both to V4 + TEO and SC. Therefore, we reject the premise that shifting attention is accomplished by the population of neurons that prepare saccades. This premise is also contradicted by physiological data (Juan et al., 2004
; Murthy et al., 2001
; Sato et al., 2003
; Thompson and Bichot, 2005
; Thompson et al., 2005
).
This conclusion is based on a strict mapping between populations of specific types of neurons and the cognitive processes of attention allocation and saccade preparation. However, if the mechanism posited by the premotor theory of attention refers to brain structures or circuits comprised of heterogeneous populations of neurons performing different functions, then our results cannot challenge the theory. However, a theory formulated too generally loses the relevance of mechanism and force of falsifiability.
Proponents of the premotor theory of attention could assert that the pyramidal neurons in layer 5 that project to the SC receive monosynaptic activation from the supragranular neurons that project to extrastriate cortex, thereby effectively coupling these two functions. In fact, the canonical cortical circuit (Douglas and Martin, 1991
; Douglas et al., 1989
) includes a monosynaptic connection from layer 3 to layer 5. However, several lines of evidence demonstrate that this connection is not necessarily, irreversibly, and immediately potent. First, it has been demonstrated convincingly that most neurons in the infragranular layers maintain visual responses in the absence of supragranular layer input, exhibiting normal responsiveness and stimulus selectivity (Schwark et al., 1986
). Second, there appears to be more specific connectivity than would be expected simply from the overlap of axonal and dendritic arbors (e.g., Bannister, 2005
; Brown and Hestrin, 2009
; Yoshimura et al., 2005
), including specificity between different types of inhibitory neurons and pyramidal cells (e.g., Yoshimura and Callaway, 2005
). Third, the hypothesis that neurons registering visual stimuli directly and immediately activate neurons producing saccades was suggested based on original recordings from the SC (Schiller and Koerner, 1971
). However, subsequent research demonstrates conditions under which the endpoint of a saccade is different from the location of a stimulus (e.g., Hallett and Lightstone, 1976
; Mays and Sparks, 1980
). Perhaps the clearest example is the production of antisaccades directed to a location opposite the salient stimulus (e.g., Hallett and Adams, 1980
; Sato and Schall, 2003
). Thus, if a connection exists between visually responsive and saccade movement neurons, it cannot be irrevocably potent, for otherwise how could primates make saccades to arbitrary locations? As a matter of fact, the model of FEF based on this canonical circuit (Heinzle et al., 2007
) had to include an external input with the capacity to override the “default mode” and allow activation of motor output from layer 5 that was dissociated from the visual input represented in the supragranular layers. It seems clear that the flexibility of this stimulus–response mapping also requires the inhibitory interneurons acting on the pyramidal cells, which is why we wanted to obtain this information for the FEF. The fact that so few neurons in layer 5 of FEF project to V4 and TEO and that none of these neurons have axons that also terminate in SC indicates that the main signal from FEF to V4 and TEO is unlikely to be a motor command. In fact, the laminar specificity and density of the FEF projections to V4 and TEO indicates that they can be considered a feedforward or intermediate type of pathways Therefore, we propose that these data are consistent with the hypothesis that the signal extrastriate cortex receives from FEF relates to target selection and not saccade planning.
FEF Models and Anatomy
Many biophysically plausible models of neural networks guiding choice behavior have been formulated (Lo and Wang, 2006
; Miller et al., 2003
; Wong and Wang, 2006
). In particular, several models have been proposed to describe the target selection and saccade production functions of FEF (Brown et al., 2004
; Hamker, 2004
, 2005
; Hamker and Zirnsak, 2006
; Heinzle et al., 2007
; Mitchell and Zipser, 2003
). Many aspects of these models correspond to observations or inferences from observations about FEF. However, some of the assumptions embodied in these models seem inconsistent with the current results.
The models developed by Hamker (2004
, 2005) and Hamker and Zirnsak (2006)
were designed to account for target selection and the allocation of attention among multiple stimuli. The model features feedback from FEF to extrastriate visual areas that is supposed to interact with feedback projections from TE to TEO, V4, V2, and even V1 (Rockland and Van Hoesen, 1994
; Rockland et al., 1994
). Hamker offers evidence that the form and timing of modulation of movement-related neurons, but not visual-selection neurons in FEF, corresponds to the time course of attentional modulation in V4 and IT. However, the present anatomical evidence indicates that the majority of the input to V4–TEO originates in the supragranular layers of FEF. Thus, a movement-related signal delivered to V4–TEO may not be the major influence from FEF.
The model developed by Mitchell and Zipser (2003)
focuses on intrinsic circuitry of FEF; it was designed to produce sequences of saccades and was found to also perform selection among target alternatives. Beyond incorporating functional types of neurons that have been observed and assuming an indirect connection between visual encoding and saccade burst neurons, this model makes no specific architectural commitments that can be verified or refuted by anatomical data.
The aforementioned models were framed as plausible solutions to functional problems of performance. Two other models have been framed more by anatomical and physiological details of FEF and associated structures. One model incorporates intrinsic connectivity within FEF with extrinsic connectivity with the other major nodes in the saccade generation network (Brown et al., 2004
). A much more sophisticated spiking neuron model utilizes a canonical circuit derived from data obtained in visual cortex to understand FEF function (Heinzle et al., 2007
). This model includes both excitatory and inhibitory neurons with connectivity constrained by neuroanatomical data. Inhibitory neurons act locally and excitatory neurons project between layers and extrinsically. The strength of connections within and across layers was adjusted to achieve observed performance and was quantitatively different from that in the original model of cat visual cortex. However, the general principle embodied in this canonical circuit whereby the layers could operate somewhat independently was necessary for this model of FEF circuitry to simulate observations. Both of these models produced temporal patterns of activation that resembled in reasonable detail the forms of activity described in publications of physiological results.
With such specificity these models are exposed to falsifiability. For example, both of these models postulate the existence of movement neurons in supragranular layers, which has not been verified physiologically or anatomically. Also, these models emphasize the role of inhibition in shaping the spatiotemporal patterns of activity in visual and movement neurons. Yet, the heterogeneity of the inhibitory circuits we observed in FEF has not been incorporated into current models.
The suggestion that visual and movement neurons are largely if not exclusively localized in supragranular and infragranular layers in conjunction with the finding of different complements of inhibitory interneurons across the layers leads to the hypothesis that the mechanisms of inhibition selecting targets and guiding saccades may be different. This can be evaluated through further physiological research and model refinement guided by the present anatomical results. Ultimately, the present results provide useful constraints to guide the next generation of biophysically plausible models of target selection and saccade production.
The authors declare that the research was conducted in the absence of any commercial or financial relationships that could be construed as a potential conflict of interest.
We thank Jon Kaas and Anna Roe for comments on the manuscript, Laura Trice, Mary Varghese, and Jennifer Harvey for help with histology, Michelle Basso and Mark Wallace for discussions during surgery preparation; John Haitas and Lindsey Reid for help preparing reconstructions, and Maggie McTighe and Mary Feurtado for veterinary and surgical assistance. This work was supported by Robin and Richard Patton though the E. Bronson Ingram Chair in Neuroscience and by R01-EY008890, R01-EY002686, P30-EY08126, and P30-HD015052.
Hof, P. R., Glezer, II, Conde, F., Flagg, R. A., Rubin, M. B., Nimchinsky, E. A., and Vogt Weisenhorn, D. M. (1999). Cellular distribution of the calcium-binding proteins parvalbumin, calbindin, and calretinin in the neocortex of mammals: phylogenetic and developmental patterns. J. Chem. Neuroanat. 16, 77–116.