1
Institute of Neuroscience, Newcastle University, Newcastle, UK
2
Department of Mathematics, Boston University, Boston, MA, USA
3
School of Computing Science, Newcastle University, Newcastle, UK
4
Neurosciences CEDD, GlaxoSmithkline plc, Harlow, Essex, UK
5
IBM TJ Watson Research Center, Yorktown Heights, NY, USA
Multiple local neuronal circuits support different, discrete frequencies of network rhythm in neocortex. Relationships between different frequencies correspond to mechanisms designed to minimise interference, couple activity via stable phase interactions, and control the amplitude of one frequency relative to the phase of another. These mechanisms are proposed to form a framework for spectral information processing. Individual local circuits can also transform their frequency through changes in intrinsic neuronal properties and interactions with other oscillating microcircuits. Here we discuss a frequency transformation in which activity in two co-active local circuits may combine sequentially to generate a third frequency whose period is the concatenation sum of the original two. With such an interaction, the intrinsic periodicity in each component local circuit is preserved â alternate, single periods of each original rhythm form one period of a new frequency â suggesting a robust mechanism for combining information processed on multiple concurrent spatiotemporal scales.
Electroencephalographic (EEG) recordings of brain activity are dominated by periods of rhythmic activity. This activity is seen across a very broad range of frequencies, from <1 Hz, up to >100 Hz. Spectral analysis of long epochs of EEG activity (>1 min) reveal relationship between power and frequency such that the power at a given frequency (its contribution to the overall waveform) decreases smoothly as the frequency increases – a relationship common in many cortical activity patterns and other natural dynamic systems (Plenz and Thiagarajan, 2007
). Considering this ‘1/f’ power relationship alone suggests that the brain can generate a continuum of different frequencies of rhythmic activity, but reveals little if anything about how such dynamics may be used functionally. However, when averaging over long time periods to produce smooth frequency/power relationships, a large amount of information is lost – cortical dynamics are extremely rich, being exquisitely sensitive to sensory and neuromodulatory inputs that can change on timescales as short as a few milliseconds. Experiments designed to control and quantify these factors reveal discrete frequencies of rhythmic activity that can be related functionally to psychophysical processes (e.g. Baker et al., 2006
; Tallon-Baudry et al., 1999
; Womelsdorf et al., 2006
).
These observations are consistent with the assumption that the 1/f pattern of long-term EEG activity is generated by a time-averaged and smoothed collection of multiple, discrete frequencies of rhythm generation in cortex. If this is the case, then how many different frequencies are present? Detailed observations of dynamic activity in hippocampus and supragranular neocortex have shown that at least three discrete frequencies – delta (1–3 Hz), theta (6–9 Hz) and gamma (30–50 Hz) – are often co-expressed (Penttonen and Buzsaki, 2003
). These three rhythms can be associated with further, much slower rhythms (Steriade, 1999
) and also much faster rhythms in vivo and in vitro (Traub et al., 2003
; Ylinen et al., 1995
). An insightful extrapolation from many observations of brain rhythms suggests that there are finite, discrete frequency bands arranged according to the natural log (‘e’) of centre frequency (Buzsaki and Draguhn, 2004
). However, this scheme may underestimate the number of discrete frequencies that are available to neocortical networks. For example, separable, clearly functionally distinct sub-bands within the classical beta and gamma bands have been reported in humans (Haenschel et al., 2000
; Sanchez et al., 2006
; Vidal et al., 2006
).
One method that is useful in attempts to define the nature and number of distinct oscillation modes possible in cortex is the in vitro cortical slice preparation. Such a reductionist approach removes the ability to directly imply cognitive or motor relevance to a population rhythm
, but this is balanced by an absolute ability to control cortical input patterns and neuromodulatory state. In other words, the local cortical networks that remain intact in the slice preparation can be ‘clamped’ in defined states of activation and any associated rhythmic activity monitored. An advantage of this process is that, as the state of the cortical network is stable, rhythms that may perhaps occur only transiently in vivo can be generated constantly for many hours in vitro – thus facilitating detailed quantification and dissection of underlying mechanisms, which can then be used to further understand network dynamics using mathematical and computational models. This type of study has revealed in vitro correlates of the two subtypes of beta and gamma rhythms indicated in human studies above (Figure 1
, Roopun et al., 2008
) along with many other persistent oscillation modes. Figure 1
illustrates the pattern of discrete frequencies that can be produced by a single area of neocortex in vitro in the spectral range from 1 to 100 Hz. The modal peak frequencies fall into distinct bands, with approximately twice as many bands as expected from a natural log distribution. Instead, the bands appear approximately distributed according to ‘phi’ (the ‘golden mean’) rather than ‘e’ – a constant commonly associated with the organisation of complex natural systems (Atela et al., 2002
). It is interesting to note that, even in such a reduced system, most attempts to generate single frequencies of rhythm for study actually generate multiple coexistent frequencies. This multi-scale dynamic feature of cortical rhythms may be vital for cortical information processing (Palva et al., 2005
), with interactions between frequency bands being as important as the individual frequencies themselves – a phenomenon termed spectral processing
.
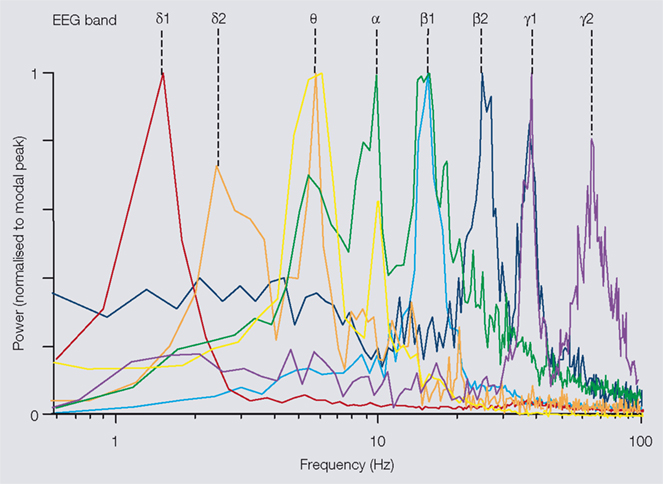
Figure 1. Multiple modal peak frequencies of persistent rhythms generated in isolated neocortex in vitro. All rhythms were generated in secondary somatosensory (parietal) cortical slices maintained in artificial cerebrospinal fluid (aCSF). Rhythms were recorded as local field potentials (LFPs), resulting spectra (from 60 s epochs of data) are plotted with powers normalised to modal peak. Delta1 (δ1, c.1.5 Hz) rhythms were generated in control slices spontaneously after >1 h incubation in normal aCSF. Delta2 (δ2, 2–3 Hz) rhythms were generated by bath application of cholinergic agonist carbachol (2 μM). Both delta rhythms had maximal amplitudes in LV. Theta (θ, 6–8 Hz) rhythms were recorded in layers II/III in the presence of the glutamatergic receptor agonist kainate (10 nM) and occurred concurrently with δ2 rhythms in LV. Alpha (α, c.10 Hz) rhythms were generated following transient activation of cortex by pressure ejection of glutamate. Peak amplitude was in LV and was present concurrently with θ and β1 rhythms in LII/III and LIV, respectively. Beta1 (β1, 13–17 Hz) rhythms were generated alone by partial blockade of AMPA/kainate receptors following tonic activation by kainate (400 nM). Beta2 (β2, 22–27 Hz) rhythms were generated in LV by kainate (400 nM) and always occurred concurrently with gamma1 (γ1, 30–50 Hz) rhythms in LII/III in this brain region. Gamma2 (γ2, 50–80 Hz) rhythms were also generated by kainate (400 nM) but occurred in LV in aCSF with reduced chloride ion concentration. Additional peak frequencies at ≥100 Hz are generated by brief, intense periods of excitation but rarely meet criteria for persistence and so are not considered here.
At the most basic level, if different frequencies are generated by entirely different local networks it is reasonable to suggest that the purpose is to keep activity coded in each frequency band separate – i.e. to minimise cross-frequency interference. But how best to achieve this? The pattern of neuronal connectivity within a single cortical column is extremely rich (Binzegger et al., 2004
; Thomson et al., 2002
), making it likely that even local networks in completely different laminae may readily interact. A solution to the interference problem can be found if the ratio of frequencies is ‘irrational’ (Figure 2
A). In this situation the two rhythms never fully synchronise and the phase relationship between frequencies constantly changes. Coexistent gamma and beta2 rhythms in association cortex provide an example of this method from minimising interference. The two rhythms are generated in different cortical laminae and survive physical separation of these laminae (Roopun et al., 2006
). The ratio of modal peak frequencies is approximately phi, resulting in a periodic pattern of change in low-level synchrony between laminae with period equal to the sum of the two periods of oscillation present. This phenomenon can occur, to some extent, with any pair of co-expressed frequencies. However, in using phi as a common ratio between adjacent frequencies in the EEG spectrum (Figure 1
), the neocortex appears to have found a way to pack as many, minimally interfering frequency bands as possible into the available frequency space.
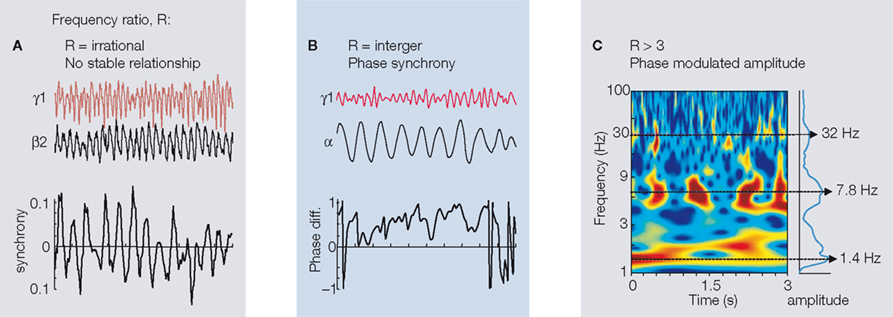
Figure 2. Examples of commonly observed stationary interactions between different, concurrently generated rhythms in neocortex. (A) When frequency ratio (R) is irrational the phase relationship between two concurrently generated frequencies is non-stationary. Traces show LFP activity in superficial and deep cortical laminae during concurrent γ1 and β2 rhythm expression (Roopun et al., 2008
). In this case average synchrony between oscillators is near-zero, with a periodic change in instantaneous phase corresponding to the sum of the periods of the two rhythms shown. (B) When R is an integer a stable phase difference can be seen between the two rhythms recorded from single or pairs of brain regions. The figure shows band-pass filtered activity the γ1 and α bands in MEG recordings, and the corresponding plot of phase difference between the bands (modified and reproduced with permission from Palva et al., 2005
). (C) When R is relatively large ‘nesting’ of co-expressed frequencies may occur. The phenomenon is observed as an amplitude modulation of one frequency relative to the phase of a lower frequency. The figure shows the nesting of spontaneous γ1 rhythms within a concurrent θ rhythm, and the concurrent amplitude modulation of the θ rhythm by a coexistent δ1 rhythm in macaque supragranular cortex (figure modified and reproduced with permission from Lakatos et al., 2005
).
If the cortex uses different frequency bands to process different aspects of incoming information then it must also possess the ability to combine information held in these bands to reconstruct this input. Patterns of sensory information are capable of subtle modification of peak frequencies associated with processing input (Gieselmann and Thiele, 2008
) such that the background framework of minimally interfering multiple frequencies (above) is disrupted. In such a situation it is possible that frequency ratios may become more favourable for direct temporal interaction between bands. Evidence for this is available from studies using measures of phase synchrony between frequencies. When frequency ratios are integer values, strong phase synchrony can be seen in human MEG recordings (Palva et al., 2005
). The key feature of this relationship is that phase between two frequencies must be non-randomly ordered. Stable (i.e. non-random) phase relationships (Figure 2
B) are seen between frequencies with ratios of 2, 3 and 4 during mental arithmetic tasks in topographically localised regions of neocortex, and the phenomenon has been proposed to be involved in memory matching and attention (Sauseng et al., 2008
).
Perhaps the most readily observable form of cross-frequency interaction is that of ‘nesting’. Here the amplitude (power) of a discrete frequency band is modified according to the phase of a lower frequency, coexistent rhythm (Figure 2
C). This pattern is seen when considering gamma rhythms coexisting with theta frequency oscillations in hippocampus (Bragin et al., 1995
). Hierarchies of nested rhythms are also seen. Nesting of delta, theta and gamma rhythms exists both in hippocampus (Penttonen and Buzsaki, 2003
) and neocortex (Lakatos et al., 2005
). This arrangement of rhythms ensures successively higher frequencies are maximally expressed in a manner dependent on the lower frequencies in the hierarchy and does not, per se, imply precise phase relationships. However, when nesting is seen it is possible to discern stable phase relationships between different frequencies in a manner, at least superficially, similar to phase synchrony (Lakatos et al., 2005
).
The previous sections dealt with how multiple co-expressed frequencies may interact. However, it is also possible for a local circuit generating a single frequency rhythm to switch frequencies. Such changes in the modal peak frequency of cortical local circuits are facilitated by a range of mechanisms including changes in neuronal intrinsic conductances and non-reciprocal interactions with other regions oscillating at a similar frequency.
Evidence for the first of these examples comes from work using transient, tetanic stimulation of afferent input to hippocampal area CA1 or neocortex. When a small area of cortex is stimulated a gamma frequency rhythm is generated riding on a post-stimulus depolarisation of both principal cells and local circuit interneurons (Traub et al., 1996
). The basic feature of this form of gamma rhythm is the locally synchronous activity generated by interneuron networks, with resulting inhibitory postsynaptic potentials (IPSPs) governing the times at which principal cells may generate action potentials. These principal cell action potentials feed back to local interneurons to generate and modify interneuronal spiking. However, when stimulation is more intense, or more than one region is co-activated, this gamma rhythm transforms into a beta frequency oscillation, with this frequency being approximately half that of the original gamma rhythm. The mechanisms underlying this transformation are two-fold. Firstly, and most importantly, an increase in principal cell spike afterhyperpolarisation (AHP) is seen as the post-tetanic response progresses. After a few seconds the AHP becomes both larger and longer than the underlying IPSPs received by principal cells, preventing them from firing action potentials on each period of the on going interneuron network gamma rhythm – the cells effectively miss alternate ‘beats’ (Figure 3
A). Secondly, if principal cell recurrent excitatory synaptic potentials are sufficiently large the system organises such that most principal cells fire on the same gamma period, and thus miss the next period owing to large AHPs. As most principal neurons are missing alternate ‘beats’ together the network output switches to near-half the original gamma rhythm – a beta frequency (Whittington et al., 1997
). The resulting beta rhythm may facilitate long-range synchronisation of activity (Kopell et al., 2000
) and can serve to temporally segregate co-active networks on the basis of magnitude of excitation received (Olufsen et al., 2003
).
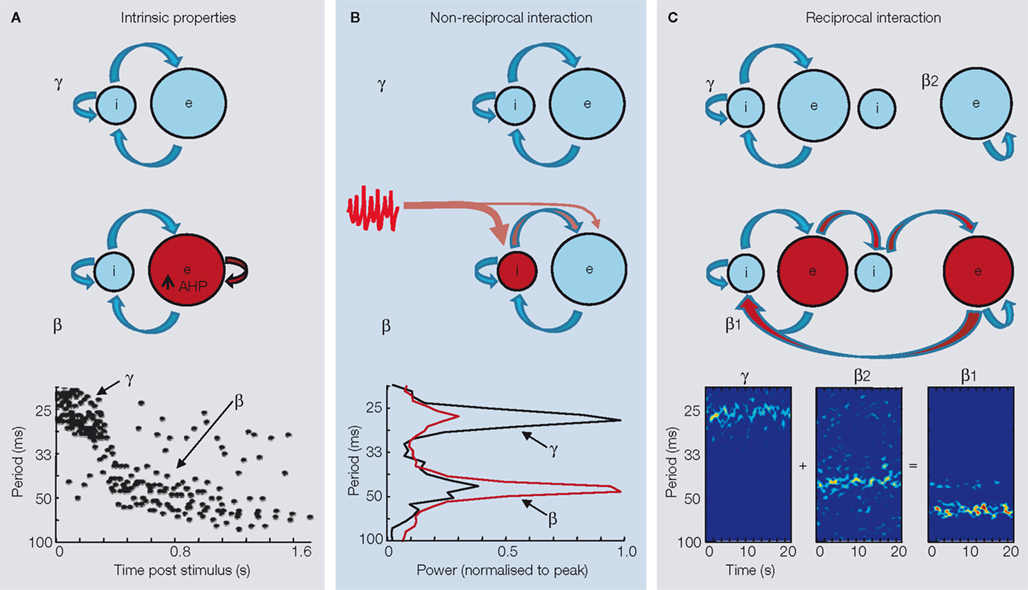
Figure 3. Mechanisms underlying transformation from gamma to beta frequency oscillations in cortex. The figure shows three frequency transform examples, along with cartoons of relevant network components. Only the main components responsible for the oscillations and their transition are represented in the cartoons. Excitatory neuron pools are designated ‘e’ and inhibitory interneuronal pools designated ‘i’. Properties of the local circuits responsible for the transitions are shown in red. (A) Gamma to beta transition induced by increased afterhyperpolarisation (AHP) conductance in principal cells. Large-amplitude gamma rhythms induced by brief tetanic stimuli in hippocampus may switch abruptly to beta frequencies when principal cell AHP duration becomes longer than that of synaptic GABAA receptor-mediated inhibition producing ‘beat skipping’. The graph shows instantaneous interspike intervals from CA1 pyramidal cells during such a transition (graph modified and reproduced with permission from Whittington et al., 1997
). (B). A similar frequency-halving phenomenon can be induced when feedforward excitation to local circuit interneurons combines with local excitation to produce multiple interneuron action potentials on alternate gamma periods. The graph shows spectra from LFPs in area CA1 when the region passively responds to input from the CA3 gamma generator (black line), and when CA1 also generates its own gamma rhythms locally (red line). Graph modified and reproduced with permission from Bibbig et al. (2007)
. (C) Concatenation of two different local circuit periods through reciprocal interaction. In neocortex, reducing excitation to co-active networks generating γ1 and β2 frequencies results in a single β1 frequency rhythm. Graphs show spectrograms of local field potential recordings from parietal cortex LII (γ1) and LV (β2) before application of low concentration of NBQX (β1). Figure modified and reproduced from Roopun et al. (2008)
.
The above mechanism is evident only when principal cell firing rates are high. However, a similar ‘missed beat’ beta transformation can be seen when spike rates are very low (c.1 Hz). The excitatory connectivity between hippocampal areas CA3 to CA1 is non-reciprocal, with gamma rhythms in vivo and in vitro being generated in area CA3 and propagated to a mainly passive CA1 via Schaffer collaterals (Csicsvari et al., 2003
; Fisahn et al., 1998
). In such a situation the CA1 network generates gamma rhythms because of the phasic, feedforward excitation from CA3 onto fast-spiking (FS) interneurons. Little, if any excitation of these CA1 interneurons comes from CA1 principal cells. However, if CA1 principal cells are co-activated, or spike frequency increased with serotoninergic neuromodulation, then local interneurons may receive double the synaptic excitation (Bibbig et al., 2007
). This profile of excitatory inputs generates two action potentials per gamma period, with long interspike intervals relative to the interneuron doublet spikes seen for reciprocally interacting networks (Traub et al., 1996
). These multiple interneuron spikes produce a much larger IPSP onto principal cells. With large IPSPs, principal cell membrane potential fails to repolarise to threshold for spike generation before the next barrage of feedforward excitation onto CA1 interneurons and so, again, alternate beats of the original gamma rhythm projected from CA3 are missed – thus effectively halving the network frequency (Figure 3
B).
The previous sections described examples of interactions between rhythms in which the frequencies generated by two participating networks are unchanged (Section ‘Interactions Between Stable Frequency Bands’) or, in contrast, the frequency generated by a single network is altered (Section ‘Transformation of Single Frequency Bands: Gamma to Beta Frequency Transitions’). We have recently defined an additional type of interaction where features of both these processes are evident: A gamma frequency rhythm generated by a superficial layer neocortical network can interact with a beta2 frequency rhythm generated by a deep layer neocortical network. The combined network generates a different frequency (beta1: 13–17 Hz), but the intrinsic periodicity of both network components is preserved (Roopun et al., 2008
, Figure 3
C). The transition between minimal-interference between the gamma and beta2 networks (Figure 2
A) and a stable phase relationship at beta1 frequencies (Figure 4
A) appears related to the pattern of excitation each network receives. With strong tonic excitation of deep and superficial cortex the networks operate in a minimal-interference model. However, if excitation is partially lowered, to mimic the fade in excitatory drive, over time, from ascending thalamocortical inputs, then both rhythms, as local field potentials are transformed into a beta1 rhythm.
How does this process occur? Detailed analysis of the behaviour of some individual cells types in deep and superficial cortical networks, and the functional connectivity between them has been used to construct a computational model of the circuits involved (Kramer et al., 2008
). Considering a single period of the beta1 frequency rhythm (i.e. one period of the original gamma rhythm followed by one period of the beta2 rhythm) continued activity in LV intrinsically bursting (IB) neurons, during the lowered excitation is revealed to be key. In the model this continued activity is generated by NMDA receptor-dependent synaptic plasticity and, experimentally, NMDA receptor blockade destroys the transformation of coexistent gamma and beta2 rhythms into a single beta1 frequency rhythm (Kramer et al., 2008
). The observed sequence of events in a single beta1 period is as follows: Output from LV principal neurons excite superficial layer, FS interneurons (Thomson and Morris, 2002
). The resulting FS interneuronal spike induces an IPSP in superficial layer regular spiking (RS) principal cells (Figure 4
B). Action potentials are generated in the RS cell on the rebound from this IPSP (see below). This output, in turn, activates superficial layer, low threshold spiking (LTS) interneurons which provide a slower, dendritic GABAergic IPSP back onto LV principal cells (e.g. see Silberberg and Markram, 2007
). LV cells then generate output on the rebound from this dendritic inhibition and the process repeats itself.
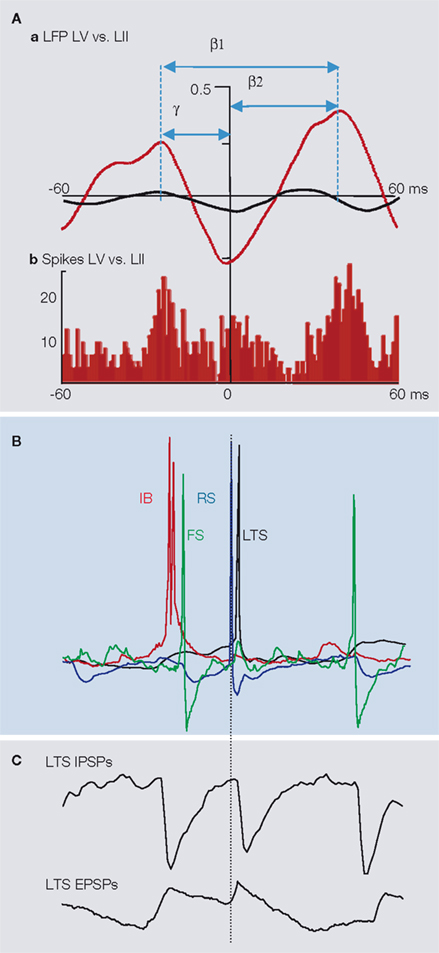
Figure 4. A mechanism underlying period concatenation of superficial 1 and deep 2 cortical rhythms. (A) (a) The principal feature of the β1 rhythm as a concatenation sum of co-expressed γ1 and β2 rhythms is an asymmetric cross correlogram when comparing local field potential (LFP) activity in superficial (LII) and deep (LV) cortical laminae. Prior to concatenation, cross correlogram of γ1 and β2 rhythms is almost flat (black line). During the β1 rhythm correlation peaks are separated by 65 ms (one period of the LFP rhythm). However, peak lead and lag, relative to 0 ms, are 25 and 40 ms – one period of the γ1 and β2 rhythms respectively (red line). This asymmetric relationship is also manifest in relative spike times. The histogram (b) shows the distribution of LV intrinsically bursting neuronal units relative to single units from LII neurons. (B) Representative neuronal activity patterns in four major cell types all aligned to the peak of the concurrently recorded LFP. In the sequence covering a single β1 period the initial spike generation is in LV intrinsically bursting neurons (IB, red). This is rapidly followed by spiking in superficial fast-spiking interneurons (FS, green). Approximately one gamma period later a spike is generated on the rebound of the superficial layer regular spiking neuron (RS, blue), rapidly followed by a spike from the LIII low threshold spiking neurons (LTS, black). Following approximately one β2 period the sequence repeats. (C) The concatenation sequence is readily observable in synaptic inputs to individual LTS neurons. Both excitatory postsynaptic potentials (EPSPs) and inhibitory postsynaptic potentials (IPSPs) occur with interevent intervals that alternate between one γ1 and one β2 period.
The above scheme depends critically on rebound spiking in principal cells. As such, modelling predicts an absolute requirement for h-current in both deep and superficial layer principal cells. Testing this prediction by blocking h-current with ZD7288 in cortical slices showed that the beta1 rhythm was indeed abolished (Kramer et al., 2008
). In addition, the mechanism underlying the observed beta2 period in the concatenated beta1 rhythm was different to that governing beta2 periodicity before concatenation occurred. With beta2 rhythms existing alone in LV the period length was generated, for the most part, by bursting in IB neuronal axons coupled by gap junctions (Roopun et al., 2006
). In contrast the beta2 period seen during concatenated beta1 rhythms arose from the kinetics of LTS cell-mediated inhibition to LV principal cell dendrites. Thus, the principal cells active in the original two concurrently generated frequencies (gamma and beta2 rhythms) remain active in the concatenated rhythm. But instead of deep and superficial circuits generating oscillations separately, their activity is combined via feedforward inhibition between laminae – with activation of superficial layer FS cell input to superficial RS cells providing a loop delay of approximately one gamma period in duration and activation of LTS cell input to deep layer IB cells providing a loop delay of approximately one beta2 period.
During activity in this combined network principal cell activity ‘flip-flops’ between LV and LII/III neurons with alternate application of the two delays above. It appears therefore, that in the concatenation process the basic timecourses of local circuits responsible for the component frequency bands are still active, but the nature of their interaction with each other governs the spectral content of the network rhythm observed.
Concatenation of two different frequencies is possible for any given pair of rhythms. However, it is interesting to note that in neocortex the ratio of adjacent frequency bands is approximately ‘phi’ (see above). This pair of observations (concatenation and the phi frequency ratio) suggests that any pair of adjacent frequency bands may concatenate to form a third in the sequence illustrated in Figure 1
. For example, we have shown how gamma and beta2 rhythms may concatenate for form a beta1 frequency rhythm. But with a constant ratio of phi between frequencies it is also possible that beta2 and beta1 rhythms may concatenate to form an alpha rhythm and so on. Thus a single, simple phenomenon (concatenation) may provide a substrate to link every one of the rhythms seen in neocortex in vitro. The authors are not aware of this being shown in human and in vivo animal recordings to date, but sufficiently controlled experiments, on going in a number of laboratories, are possible to establish or dismiss this idea.
Can interactions between multiple spatiotemporal scales of activity tell us anything about how the cortex processes sensory information? One answer may come in the form of ‘slow feature extraction’ (Wiskott and Sejnowski, 2002
). In the temporal domain, the ability of a system to sort rapidly changing features of an input from more slowly changing features provides an efficient means to detect optimal solutions in object recognition tasks. A hierarchical arrangement of feature detection, over a range of temporal scales, can reproduce many properties of individual neurons in visual cortex (Berkes and Wiskott, 2005
). Thus, from a computational perspective, it is advantageous for the cortex to process different temporal scales of information separately. If this separation is performed using different frequencies of cortical rhythms then this also imparts a spatial, anatomical scale to activity patterns – it has been shown that rhythms with larger temporal scales (slower frequencies) facilitate interactions (within the synchronisation framework of neuronal assembly formation) over greater distances in cortical networks (Kopell et al., 2000
). Considering this phenomenon in visual cortex suggests that slower rhythms may synchronise over larger areas of the retinotopic map. This leads to the possibility of a role for different frequencies of cortical rhythm in processing sensory information on different spatial scales also.
A connection between cortical rhythm frequency and the spatial frequency of sensory input comes from insightful psychophysical experiments using the ‘bubbles’ technique (Gosselin and Schyns, 2001
). In a visual task designed to test perceptual shifting from features of an object with low spatial frequency to those with high spatial frequency, a direct correlation was seen between spatial scale of the sensory object and the temporal scale (frequency) of associated cortical rhythms (Smith et al., 2006
). However, if different scales of information are processed on different scales of temporal neuronal activity (frequencies of brain rhythm) the brain must have a means to combine information in these frequency ‘channels’ in order to fully represent a sensory object. Cross-frequency phase synchronisation constitutes a possible substrate for such a combination. While previous studies have shown phase synchronisation between frequencies with integer ratios (Palva et al., 2005
), stable phase relationships are also generated by period concatenation
(Figure 4
A, Roopun et al., 2008
). Thus concatenation of multiple coexistent cortical rhythms, on different temporal scales, may provide a putative mechanism by which an object whose features are presented with high spatial frequency may be represented within the context of accompanying features presented at lower spatial frequencies.
A connection between cortical rhythm frequency and the spatial frequency of sensory input comes from insightful psychophysical experiments using the ‘bubbles’ technique (Gosselin and Schyns, 2001
). In a visual task designed to test perceptual shifting from features of an object with low spatial frequency to those with high spatial frequency, a direct correlation was seen between spatial scale of the sensory object and the temporal scale (frequency) of associated cortical rhythms (Smith et al., 2006
). However, if different scales of information are processed on different scales of temporal neuronal activity (frequencies of brain rhythm) the brain must have a means to combine information in these frequency ‘channels’ in order to fully represent a sensory object. Cross-frequency phase synchronisation constitutes a possible substrate for such a combination. While previous studies have shown phase synchronisation between frequencies with integer ratios (Palva et al., 2005
), stable phase relationships are also generated by period concatenation (Figure 4
A, Roopun et al., 2008
). Thus concatenation of multiple coexistent cortical rhythms, on different temporal scales, may provide a putative mechanism by which an object whose features are presented with high spatial frequency may be represented within the context of accompanying features presented at lower spatial frequencies.
Figure 5
illustrates a trivial, putative example of this process. Figure 5
A shows an image containing a pocket watch with main dial and smaller secondary dial. To identify the smaller dial as part of the watch as a whole the higher spatial scale of the secondary dial detail needs to be registered with the lower spatial scale of the main dial. This not a problem if the entire image is sampled with a high spatial scale, but a far more computationally efficient process is to use two different spatial scales, each with the same information content (number of pixels in this example). In this manner the higher spatial scale required to recognise the secondary dial can be placed in the context of the watch as a whole with only a two-fold increase in overall information content. Figure 5
B illustrates a schematic of how this may be achieved with concatenation of different frequencies. Higher spatial scale information, required to recognise the secondary dial corresponds to higher temporal scale (frequency) of cortical rhythm timing the barrage of action potentials generated on presentation of the image. The contextual information (lower spatial scale of the main dial) is concurrently processed at a lower temporal scale (frequency) of cortical rhythm. By concatenation of these two frequency channels stable cross-frequency phase relationships are generated, indicating that both scales of information may be co-registered in a single, lower frequency, rhythm – the concatenation sum.
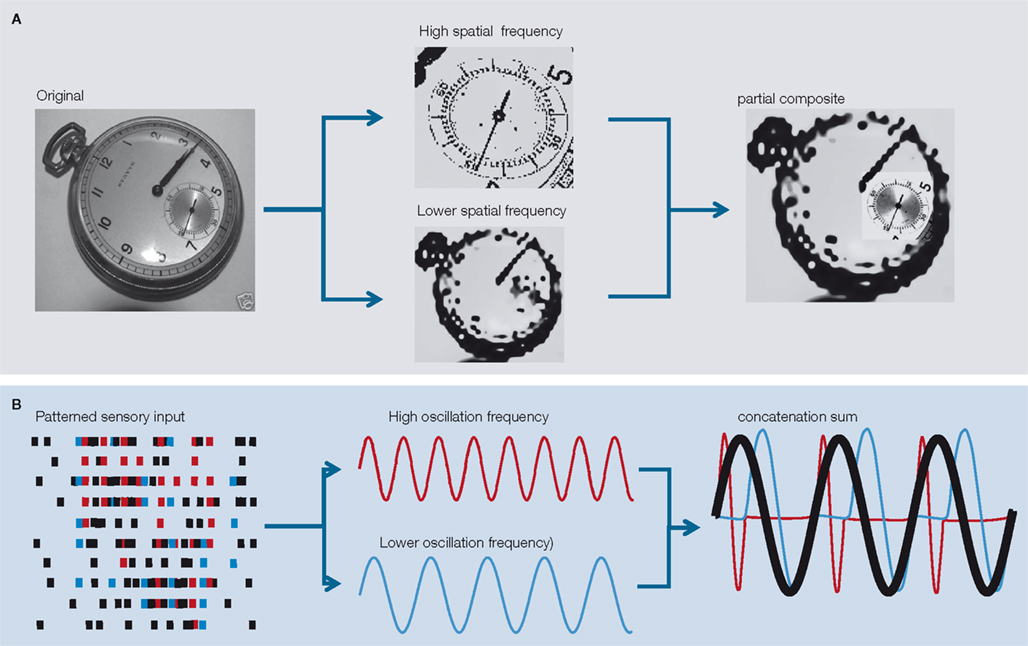
Figure 5. A possible role for period concatenation in multi-scale sensory processing. (A) What is the most efficient way to recognise the smaller dial of a pocket watch as secondary to the main dial? The image on the left is rendered from a 512 × 512 pixel digital image. From this it is easy to answer the above question, but a very large amount of information is needed (>260 k pixels). If the image is split into two different spatial scales the process can be achieved more efficiently. The upper image in the middle panel is a downsampled, smoothed representation of the secondary dial (rendered from 128 × 128 pixels). The lower image in the middle panel is an identically downsampled, smoothed version of the entire image (again, rendered from 128 × 128 pixels). A partial composite of the information held at these two spatial scales provides sufficient information to answer the above question using c.10% of the original information [2 × (128 × 128) = c.32 k pixels]. (B) A schematic representation of how period concatenation may facilitate the process described in (A). Spike activity corresponding to neurons activated by sensory input contain transiently synchronous patterns of activity at different interspike intervals. The cartoon on the left shows coincident spikes recurring with high frequency (red) and lower frequency (blue) within the overall pattern of activity. Extrapolating two spatial frequencies of input to two temporal frequencies of cortical rhythm provides a putative framework for independent processing of the two information streams (middle panel). Concatenation of the activity in local circuits responsible for generating the two frequencies produces a third, lower frequency (the concatenation sum) containing sequential periods of the original two rhythms.
Period concatenation constitutes a robust mechanism for interaction between the many discrete frequencies of rhythm observable in neocortical networks. Data on period concatenation of gamma and beta2 rhythms into a beta1 frequency rhythm reveal a combination of features seen in previously described frequency interactions and transformations: Firstly, concatenation stabilises the phase relationship between the gamma and beta2 generating networks – a phenomenon critical to the establishment of phase synchrony. Secondly, the periodicity of both component networks is still manifest in the pattern of synaptic interaction between individual neurons, as seen for single, gamma-generating networks producing beta rhythms as a subharmonic. In addition, the constant ratio of adjacent frequency bands seen in in vitro neocortical rhythm studies (Figure 1
) suggests that all observed bands may be interrelated via concatenation. With a ratio of c.1.6 not only can gamma and beta2 rhythms concatenate to form a beta1 rhythm, but beta2 and beta1 rhythms may concatenate to form an alpha rhythm and alpha and beta1 rhythms concatenate to form a theta rhythm etc. Thus a hierarchical arrangement of frequencies may exist through concatenation in a similar manner to that seen for nested rhythms, but on a finer temporal scale. Such an arrangement fits the hierarchical organisation of network anatomy in the brain very well (Sporns et al., 2004
), and has been inferred from the dynamic profile of human EEG data (Weiss and Weiss, 2003
). This pattern of inter-relationships between discrete rhythms may provide a possible network dynamic substrate for multi-scale, parallel processing of sensory information over a range of temporal (Wiskott and Sejnowski, 2002
) and spatial scales (Smith et al., 2006
). However, to date, experimental evidence for such an association is not available.
The authors declare that the research was conducted in the absence of any commercial or financial relationships that could be construed as a potential conflict of interest.
We thank The MRC, The Wolfson Foundation, the NIH, NSF, IBM, The Alexander von Humbolt Stifftung and The Royal Society for supporting this work.
Period concatenation: A combination of frequency interaction and frequency transition
whereby changes in connectivity between two oscillating networks results in sequential activation of each network on a period-by-period basis. The resulting frequency is derived from the sum of the period durations of the original two oscillations.