Complex spectral interactions encoded by auditory cortical neurons: relationship between bandwidth and pattern
- 1 Center for Neuroscience, University of California Davis, Davis, CA, USA
- 2 Department of Neurobiology, Physiology and Behavior, University of California Davis, Davis, California, USA
The focus of most research on auditory cortical neurons has concerned the effects of rather simple stimuli, such as pure tones or broad-band noise, or the modulation of a single acoustic parameter. Extending these findings to feature coding in more complex stimuli such as natural sounds may be difficult, however. Generalizing results from the simple to more complex case may be complicated by non-linear interactions occurring between multiple, simultaneously varying acoustic parameters in complex sounds. To examine this issue in the frequency domain, we performed a parametric study of the effects of two global features, spectral pattern (here ripple frequency) and bandwidth, on primary auditory (A1) neurons in awake macaques. Most neurons were tuned for one or both variables and most also displayed an interaction between bandwidth and pattern implying that their effects were conditional or interdependent. A spectral linear filter model was able to qualitatively reproduce the basic effects and interactions, indicating that a simple neural mechanism may be able to account for these interdependencies. Our results suggest that the behavior of most A1 neurons is likely to depend on multiple parameters, and so most are unlikely to respond independently or invariantly to specific acoustic features.
Introduction
The behavior of auditory cortical (AC) neurons has been examined using a variety of stimuli from simple (pure tones) to quite complex (natural sounds). Though there may be an expectation that the responses of these cells to complex stimuli such as natural sounds can be understood in terms of their simpler stimulus–response properties, this might not be possible. One difficulty is that natural sounds, particularly communicative sounds, often comprise multiple, concurrently varying information-bearing parameters. In the agonistic encounters of many species, for example, degrees of fear and aggression are signaled by variations in vocal frequency and bandwidth, respectively (Morton, 1977). Variations in two or more concurrent sound parameters may produce non-linear interactions that would render predictions based upon a single acoustic parameter inaccurate. Such interactions between several acoustic parameters in complex sounds have recently been found in AC neurons of ferrets (Bizley et al., 2009).
The likelihood of these interactions is supported by studies involving combinations of simple stimuli. Many studies have examined interactions between two (or more) pure tones and found that a neuron’s response to a complex tone is rarely equal to the linear sum of its responses to the tone components in isolation (Abeles and Goldstein Jr., 1970; Oonishi and Katsuki, 1965; Suga and Manabe, 1982; Sutter and Schreiner, 1991; Nelken et al., 1994b; Sutter et al., 1999; Sadagopan and Wang, 2009). These results, however, stand in contrast to a body of work using broad-band, spectrally patterned stimulation; studies using sine-spectral profile (ripple) stimuli indicate that many AC neurons integrate this spectral stimulation in an approximately linear fashion (Shamma and Versnel, 1995; Shamma et al., 1995; Kowalski et al., 1996; Calhoun and Schreiner, 1998; Ahmed et al., 2006; Klein et al., 2006).
These results suggest that broad-band patterned stimulation may drive AC neurons in an operating regime that is more linear than that from punctate, pure-tone stimulation (Shamma and Versnel, 1995). However, linear spectro-temporal receptive field (STRF) models of AC neurons generally fail to correctly predict responses to novel stimuli with much fidelity (Theunissen et al., 2000; Machens et al., 2004). This finding apparently contradicts the claim that broad-band stimulation produces more linear behavior, but the STRF models attempt to describe behavior over both frequency and time and are typically based on responses to natural stimuli or complex random patterns.
This brief overview suggests that estimates of AC neuron linearity are largely dependent on the type of stimulus used for study, making it difficult to predict how these cells will respond to particular information-bearing parameters in complex sounds, and to model feature encoding. We reasoned that a more tractable approach for examining feature integration would employ controlled parametric manipulation of a complex signal. We also thought it best to focus initially on just one acoustic domain such as frequency.
We took this tack here in a parametric investigation of the relationship between spectral pattern (ripple frequency) and bandwidth on the responses of primary auditory cortical (A1) neurons. Spectral bandwidth and pattern are two attributes intrinsic to all sounds. We recorded single-unit potentials from awake macaques under conditions approximating natural listening, examining neural selectivity as a function of the combination of the two variables. These stimuli have spectra similar to those of natural sounds, and permit graded structural variation from relatively simple (narrow bandwidth, low ripple frequency) to more complex (large bandwidth, high ripple frequency) along two dimensions. This design permitted us to assess whether the variables’ effects on a neuron’s responses were independent or if an interaction was present. We also examined the ability of a linear spectral integration model to describe these results. The purpose of the model was not to test the linearity of our neurons, but to examine to what extent we could qualitatively reproduce the variables’ effects, and to determine whether these effects were independent or interdependent.
Most neurons driven by these stimuli varied their responses as a function of bandwidth or pattern, or both. Most also showed an interaction between these factors, implying that their effects were not additively separable, that is, could not be explained by the sum of the effects of the two variables. Interestingly, although it initially seems counterintuitive, we show that these main effects and interactions were compatible with the linear spectral model.
Our findings suggest that (1) most A1 neurons show tuning for particular combinations of bandwidth and pattern, and so are unlikely to show independence or invariance for a single feature or parameter, and (2) this interdependency may be the consequence of a simple neural process transmitting interactions that are inherent in a signal.
Materials and Methods
Subjects
Two adult rhesus monkeys (Macaca mulatta; one male, one female), with normal hearing were subjects. All procedures conformed to the PHS policy on experimental animal care and were approved by the UC Davis Animal Care and Use Committee.
Stimulus Generation and Presentation
Each acoustic stimulus consisted of a sinusoidal modulation of signal power in log frequency, spectrally windowed by a log-normal function. These spectra took the form: A = m [(cos [2πf(x − x0) + φ]+1)/2]·exp[−(x − x0)2/2σ2], where A is log-amplitude (power), m is the depth of modulation in dB (here, 90 dB), x represents frequency in octaves, x0 and σ are the center frequency [at the cell’s best frequency (BF)] and standard deviation of the Gaussian in octaves, f is the ripple frequency in cycles/octave, and φ = 0 is the phase of the ripple spectrum with respect to the center of the Gaussian window (Figure 1).
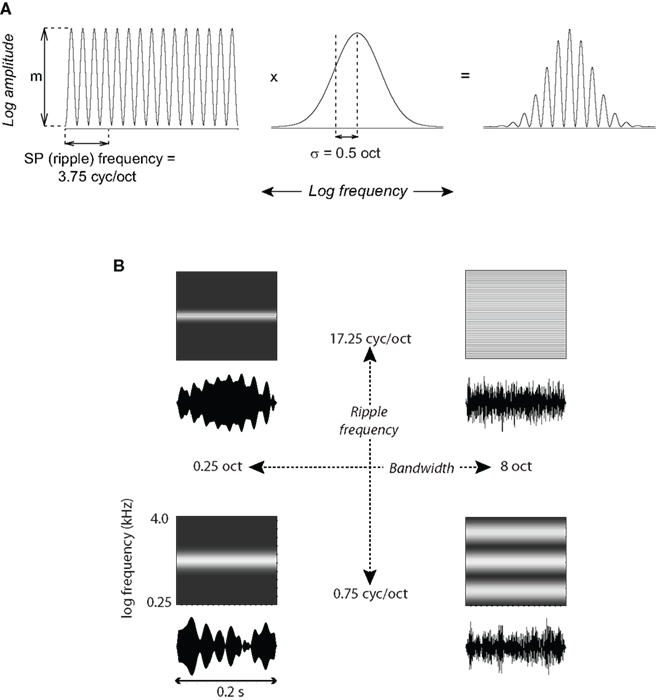
Figure 1. Spectral Gabor stimuli. (A) The stimulus spectrum was shaped by multiplying a 4-octave, sine-profile (ripple) spectrum (left), comprising 1024 pure-tone components at equal log-frequency intervals having randomized phases, by a Gaussian window (center). The resulting spectrum is on the right. The stimulus shown has a ripple frequency of 3.75 cyc/oct and bandwidth σ = 0.5 oct. (B) Waveforms and schematized spectrograms are shown for the four most extreme combinations of bandwidth and ripple frequency. The precise waveforms depended on the phase randomization of the ripple sine components; this randomization was fixed for each neuron but varied across neurons.
These stimuli have short-term spectra similar to many natural sounds such as vocalizations, which convey information via peaks in sound energy (e.g., formants). They are also similar in form to synthetic stimuli that have been previously used in psychophysical experiments (e.g., Supin et al., 1999, 2003). We refer to this signal as a static spectral Gabor, with the proviso that the sine component is non-negative. The signals, 200 ms in duration with 5-ms onset/offset ramps, were comprised of 1024 pure tones at equal log intervals over a 4-octave range, with randomized phases. The maximum spectral peak (midpoint) of each Gabor stimulus was centered over the BF of a cell. The BF was determined using 50-ms tone bursts (5-ms cosine on/off ramps) and a weighted interpolation method (previously described in Petkov et al., 2007), which incorporated the frequency of the tone eliciting the maximal response, as well as the frequencies of the neighboring lower and higher tones, to yield a single BF value.
Neural responses were measured as a combination of sine-profile (ripple) frequency and bandwidth. Stimuli were tested at six ripple frequencies: 0.75, 1.75, 3.75, 8.25, 12.75, and 17.25 cycles per octave (cyc/oct). Each ripple frequency was presented at six bandwidths: Gaussian standard deviation (σ) = 0.25, 0.5, 1.0, 2.0, 4.0, and 8.0 octaves (corresponding to 1/2 power octave bandwidths of 0.59, 1.18, 2.36, 4.72, 9.44, and 18.88) covering a wide range of values for both variables. Each of these 36 stimulus types was presented for 25 repetitions to each neuron, for a total of 900 trials. The order of stimulus presentation for all experiments was random within each repetition (block). Stimuli were presented at an average inter-trial interval of 1.2 s with a random uniform variation of ±0.2 s.
The sound waveforms were generated using a digital signal processor (AT&T DSP32C) with 16-bit output resolution at a sampling rate of 100 kHz and a digital-to-analog converter (TDT Systems DA1), passed through a programmable attenuator (TDT Systems PA4), and then through a passive attenuator (Leader LAT-45). The signal was then amplified (Radio Shack MPA-200) and delivered through a speaker (Realistic PA-110, 10-in woofer and piezo-horn tweeter, 0.04–25 kHz) positioned at ear level 1.5 m in front of the subject. (Some high-frequency tone stimuli used for tonotopic mapping were delivered through a Radio Shack 40-1310B tweeter, 5–50 kHz.) System calibration (Bruel & Kjaer 2231 meter, unfiltered calibration, 1/4-in 4133 condenser microphone) showed that the PA-110 speaker gave a flat frequency response to within ±10 dB SPL from the average level between 0.04 and 25 kHz, and to within ±6 dB between 0.04 and 14 kHz. Most (120/130, 92%) of the neurons responsive to Gabor stimuli had BFs < 3.5 kHz, and so received Gabor stimulation within the latter frequency range.
Stimulus intensity in each experiment was normalized with respect to digital RMS amplitude. This normalization corrected for a roughly ±3 dB (RMS) amplitude difference across each stimulus set when the signals were scaled to the same (16-bit) peak amplitude. Most of this variation was due to bandwidth, with a mean increase of about 4 dB from the narrowest to the broadest bandwidth stimuli. Stimulus intensity in the booth was adjusted to ∼60 dB SPL and after correction was found to vary less than ±2 dB SPL within experiments.
Electrophysiological Recording and Data Acquisition
Each monkey was implanted with a head post and recording chamber for chronic access to auditory cortex. Recordings were made while the monkeys were comfortably restrained and quietly seated in an “acoustically transparent” primate chair within a sound attenuated, foam-lined booth (IAC: 9.5′ × 10.5′ × 6.5′). Subjects were on a restricted liquid intake protocol and received diluted fruit juice or water intermittently to maintain their alertness during recording sessions. High-impedance tungsten microelectrodes (FHC) were inserted into the brain using a remotely controlled hydraulic microdrive (FHC), through guide tubes held by a plastic grid (Crist Instrument) in the recording chamber. Extracellular potentials were amplified and filtered (0.3–5 kHz; AM Systems 1800), digitally sampled at 50 kHz (TDT Systems AD1), and the waveforms stored on hard disk for later spike discrimination and analysis using commercial (Datawave) software. Auditory cortex was identified by single- and multi-unit responses to pure-tone pips, broad- and narrow-band noise bursts, and clicks. Primary auditory cortex was identifiable by the vigor and selectivity of unit responses to pure tones, response latency, and from the gradient of BF along rostro-caudal and medio-lateral anatomical coordinates. Histology (shown in Figure 2; see next section) for subject V, and frequency maps from both subjects (presented in the Supplemental Material, Figure S1), support localization of the single-unit data reported here to A1. Experimental control, data collection, and analysis were accomplished using customized C language, Matlab (MathWorks), and CED software.
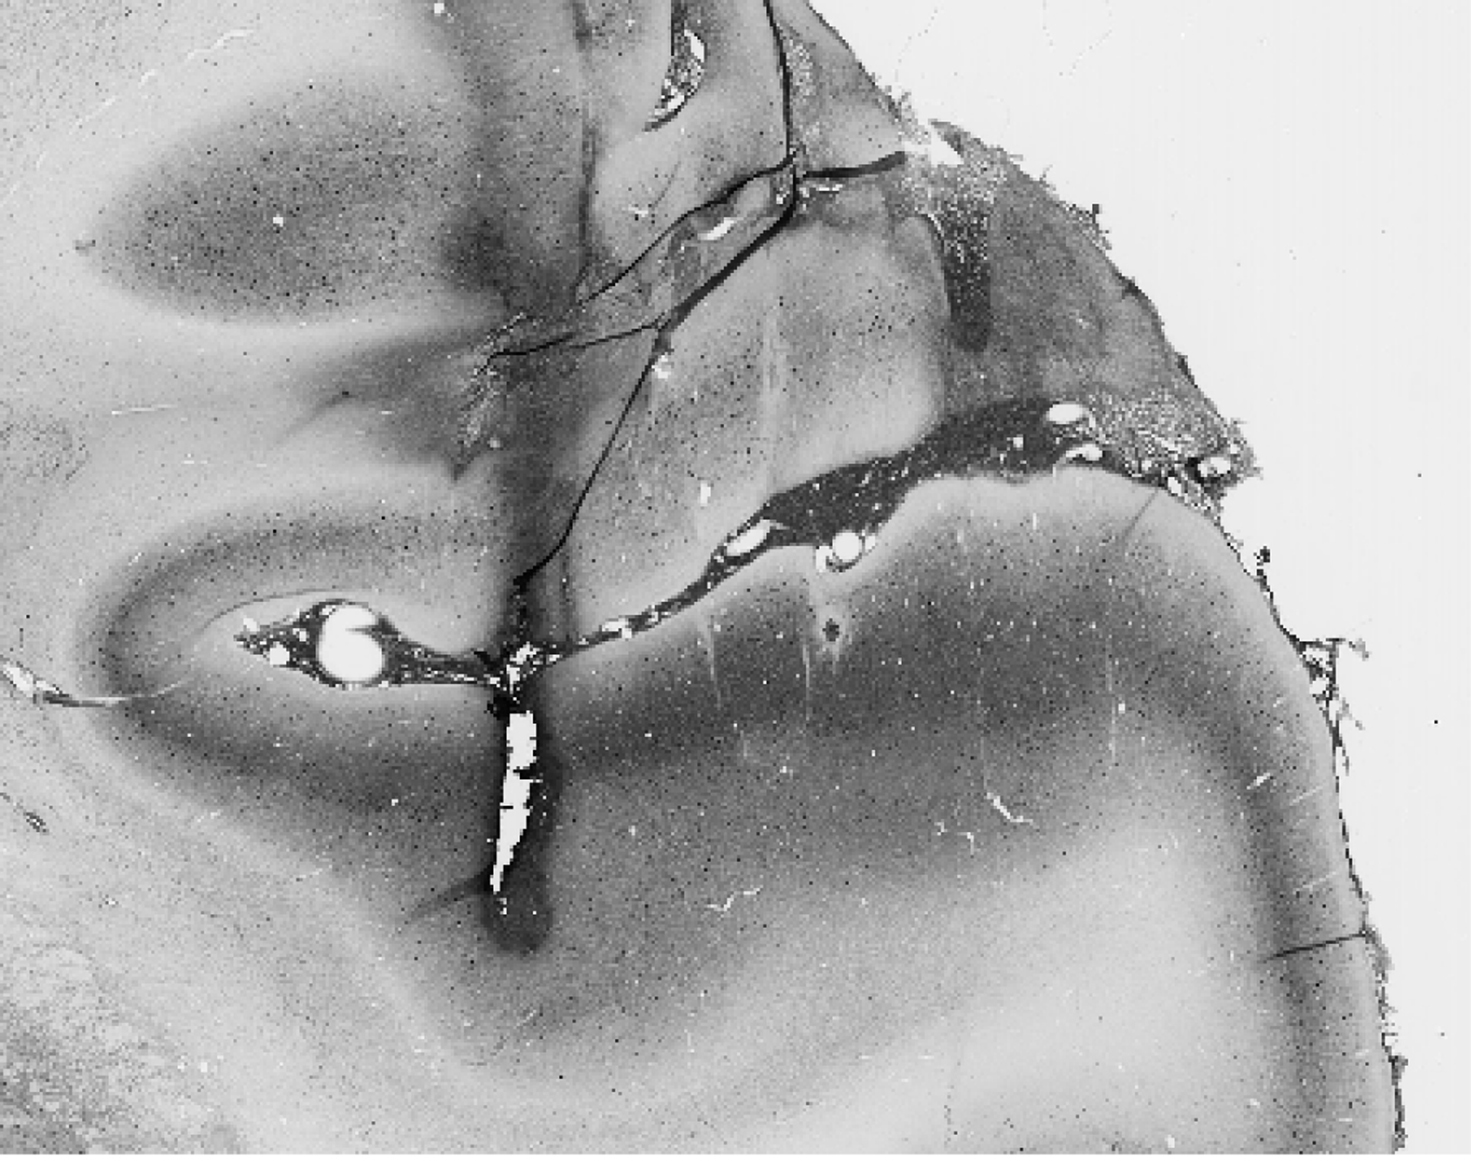
Figure 2. A parvalbumin-stained coronal section. The track reveals the effects of an electrode dipped in biotinylated dextran amine inserted about an hour before sacrifice, and lies on the border between primary auditory cortex and the middle medial belt. The densely stained band lateral to the track is characteristic of A1 staining.
Histology
One monkey (V) was available for histological analysis to confirm that our recording sites were in primary auditory cortex (A1). An hour prior to the animal’s termination, we labeled three locations in auditory cortex by inserting electrodes dipped in biotinylated dextran amine (Sigma) to a roughly estimated depth. These three locations were the anterior, middle, and posterior points on the physiologically determined border between A1 and the middle-medial belt; the anterior and posterior locations encompassed our most rostral and caudal recording sites. The monkey was then given an overdose of sodium pentobarbital and perfused with 4% paraformaldehyde in 0.1 M phosphate buffer. The brain was removed, blocked, and allowed to sink in 30% sucrose in 0.1 M phosphate buffer before being frozen. Sections of 30 μm thickness were cut on a sliding microtome in the frontal plane, and were alternately processed with three staining methods: (1) treated with mouse anti-parvalbumin antibody, then with biotinylated, horse anti-mouse secondary antibody, followed by reactions with acetyl-avidin biotinylated peroxidase complex (ABC) and diaminobenzidine (DAB), (2) Nissl staining, and (3) Nissl staining followed by reactions with ABC and DAB. In the first staining method, both the electrode sites and parvalbumin containing cells were revealed by reactions with ABC and DAB. In the third staining method, only the electrode sites were revealed by reactions with ABC and DAB. Figure 2 shows a parvalbumin-stained slice at the middle electrode location that reveals the thick, densely stained band indicative of A1 lateral to the track.
Data Analysis
Counts of isolated single-unit spikes were made during a 200-ms baseline (pre-stimulus) interval, during the 200-ms stimulus, and for 400 ms following the stimulus. For each cell, spike count differences between the baseline and stimulus intervals were assessed using a Wilcoxon signed-rank test. The effects of ripple frequency and bandwidth on each neuron’s response were evaluated using a two-factor repeated measures analysis of variance (ANOVA). The essential purpose of the ANOVA is to test for an interaction between the variables. If there is no interaction it implies that the experimental effects are independent, that is, that the joint effects of the variables can be explained by simple addition of the individual (main) effects.
The specific null hypotheses tested were that neither variable, singly or in combination, had any effect on a neuron’s response. This was accomplished by computing the F ratios for each variable, and their combination, in the usual manner. Because our spike count distributions rarely met the requisite statistical assumptions of normality and homogeneity of variance we determined these probabilities using a bootstrap Monte Carlo technique (Efron and Tibshirani, 1993). The test-statistic distribution was computed by random sampling with replacement, 9999 times, of scores from the obtained data set. The F ratios from the original (non-randomized) data were then compared against these distributions to determine their likelihood. In the case of significant main effects, pair-wise comparisons between levels of a variable were made using a bootstrap t test with Tukey correction.
The effects of ripple frequency and bandwidth on firing rate were examined graphically by plotting each neuron’s responses as a function of level of one or the other variable, as well as averaged over levels (e.g., • in Figure 3C) in factorial plots. In the latter case, when the effect of the variable was significant, we attempted to formally describe the overall effect of a variable on the neuron’s response by fitting a function (— in Figure 3C) to the mean across levels of factor (see Supplementary Material for a description of these fits). For both variables, neurons could be visually classified as primarily selective for small values (low pass for ripple frequency), intermediate values (band pass), or high values (high pass). A few neurons displayed troughs in their response functions and were classified as band reject for ripple frequency or bandwidth reject for bandwidth. The methods used to perform these curve fits have been previously described (O’Connor et al., 2005).
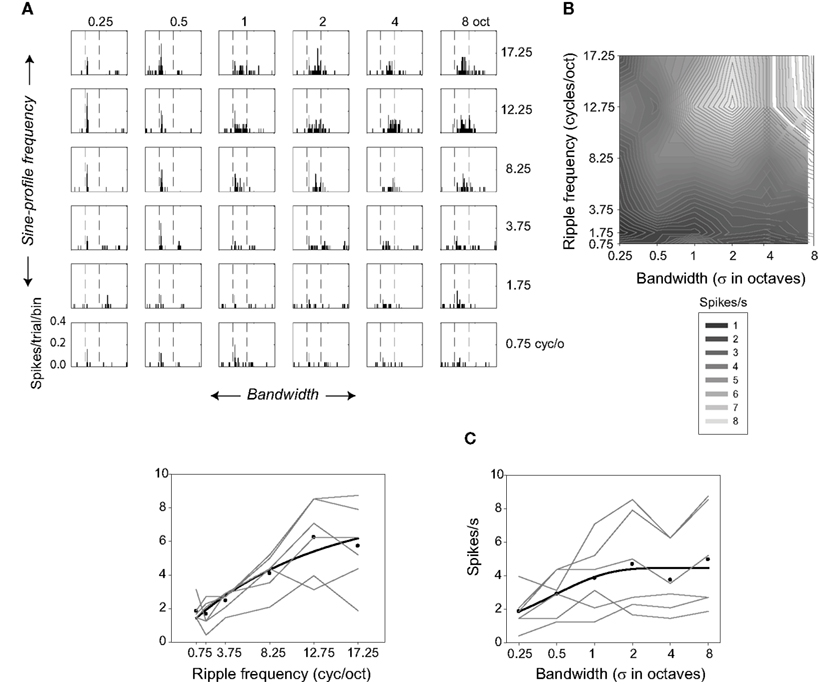
Figure 3. Selectivity of one neuron for ripple frequency and bandwidth. (A) Response histograms are shown for each ripple frequency and bandwidth combination (bin size = 5 ms). (B) Contour plot showing responses evoked during the 200-ms stimulus at each ripple frequency and bandwidth combination. Lighter regions represent higher spike rates. (C) Factorial plots showing response strength at each level of ripple frequency (—, left), and at each level of bandwidth (—, right). The • indicate the mean rates averaged over bandwidth (left) or ripple frequency (right). The ▬ represent the best fitting (negative) exponential growth functions (y = y0 + a [1 − exp(−x/b)]) to the mean rates.
Neural Modeling
We examined the ability of two receptive field (RF) models – each a spectral linear filter – one a Gabor function and the other a difference-of-Gaussians (DoG), to generate responses similar to those of actual neurons. Both functions seem to provide reasonably good formal descriptions of A1 neurons’ spectral RF structures (O’Connor et al., 2005), and the Gabor has also been used to describe spectral profiles of STRFs obtained from the auditory midbrain (Qiu et al., 2003). The Gabor function, w = a exp [−(x − μ)2/2σ2] sin [2πf(x − μ) + φ] is the product of a Gaussian and a sine function, where the parameters μ and σ are the center frequency and standard deviation of the Gaussian, f is the sine frequency, φ is the phase of the sine relative to the peak of the Gaussian, and a is a scale factor. In the DoG function  the parameters μ1 and μ2, and σ1 and σ2, are the center frequencies and standard deviations of the two Gaussians, and a and b are scale factors.
These functions controlled the values of the weights (wj) in the equation

This equation describes the response R (spikes/s) of a neuron to stimulus s, where s is a vector comprising the relative amplitudes (linear in dB) of the N = 1024 constituent stimulus frequencies, w is a weight vector, the spectral weighting function of the neuron, and R0 is the baseline firing rate of the cell. The summation term is a linear filter that weights each frequency’s amplitude by some magnitude, the gain (in units of spikes/s/dB) for that frequency, then sums across frequencies. Equation 1 has been used previously to describe the behavior of auditory neurons with some success (Yu and Young, 2000; Barbour and Wang, 2003). It is similar in principle to a linear STRF model, but omits the temporal dimension. We also examined a modified version of Eq. 1
where [·]+ is a (non-linear) half-wave rectification operation. This describes a more biologically plausible model because spike rates cannot take negative values.
To facilitate comparison of neural data to model output, we fit the parameters of Eqs 1 and 2 to each neuron’s data, by minimizing the least-squared error between the cell’s mean response (spikes/s) to each of the 36 Gabor stimuli and those predicted by the model. For these fits, each squared error term was weighted by the inverse of the variance for that mean before summing. This error estimate is described by
where χ2 is the chi-square statistic,  is the actual mean response rate of the neuron to stimulus i, Ri is the predicted response to this stimulus, σi is the response standard deviation for that stimulus, and M is the number of stimuli (Press, 2000).
To achieve these fits, the value of χ2 (the weighted least-squared error) was minimized using a non-linear search technique, the simplex method (Nelder and Mead, 1965). To avoid local minima, and to ensure broad sampling of the parameter space, we used a Monte Carlo technique in which each fit was performed 1000 times with initial parameter values chosen randomly and uniformly over a particular interval (4 octaves in frequency for μ and σ; 0–1 for a and b; 0–17.25 for f; and 0–2π for φ), before selecting the best fit. These fits were not intended to provide rigorous quantitative tests of Eqs 1 and 2, but rather were designed to facilitate our qualitative assessment of the ability of these models to describe the main and interaction effects in our data.
Results
Of 142 isolated single units tested, 130 (92%) responded to spectral Gabor stimulation with a significant change in spike count from the spontaneous level (signed-rank, P < 0.05). Of these 130 neurons, most showed effects of ripple frequency (93, 72%) or bandwidth (110; 85%), or both (87, 67%) (F ratio, P < 0.05). A significant interaction was also found for a majority (82, 63%) of cells (see Table 1). For almost all neurons sensitive to spectral Gabor stimulation, the net effect (the mean response over all conditions) was an increase in response (121/130, 93%). There was no obvious relationship between cortical recording location and any main or interaction effects. Nor did we find any clear relationship between cortical location and any of the tuning parameters (e.g., ripple high or low pass) described in Section “Materials and Methods”.
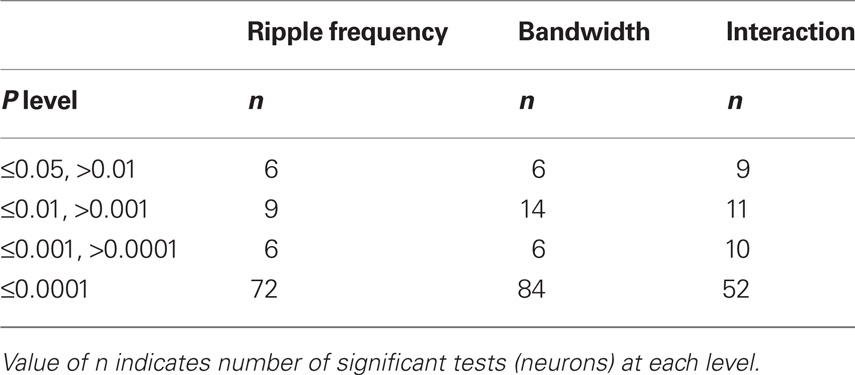
Table 1. P levels for the ANOVA tests (F ratios) for effects of ripple frequency, bandwidth, and the interaction between these factors.
In Section “Results”, we will first describe the simple or main effects of varying spectral bandwidth and pattern, and then examine the interaction effects between these variables. Finally, we will examine the ability of the models (Eqs 1 and 2) explained in Section “Materials and Methods” to describe these results.
An Example of Stimulus Effects from One Neuron
Figure 3 illustrates the behavior of one neuron in several ways. Figure 3A displays a response-time histogram for each ripple frequency-bandwidth stimulus combination. The plots are arrayed in order of increasing ripple frequency and bandwidth, from the lower left to the upper right. This neuron is relatively insensitive to low ripple frequencies and narrow bandwidths, increasing its response as both variables increase in value. Figure 3B depicts responses evoked during the 200-ms stimulus (the regions between the dashed lines in Figure 3A) in the form of a contour plot. In Figure 3C factorial plots depict the neuron’s responses as a function of one or the other variable (—); symbols (•) designate the mean firing rate over levels of bandwidth as a function of ripple frequency, and over levels of ripple frequency as a function of bandwidth, and the ▬ indicate the best exponential fits to the mean firing rates.
This neuron increased its response rate as a function of both ripple frequency [F(24,5) = 25.57; P < 0.0001] and bandwidth [F(24,5) = 6.62; P < 0.0001]. Inspection of the factorial plots indicates that there might be an interaction between bandwidth and ripple frequency, but the interaction effect does not reach significance. This is likely due to variability (noise) in spike rate across conditions: The absence of an interaction means that the variance in the dependent variable attributable to the combination of the two factors (the mean square for interaction) is small relative to the variance over all observations (the mean square error).
Effects of Ripple Frequency
Almost 75% (93/130) of the neurons sensitive to spectral Gabor stimulation modulated their responses as a function of ripple frequency. Most showed tuning for ripple frequency in the sense that they displayed selectivity for a particular range of frequencies. The neuron in Figure 3 is an example of a high-pass neuron. Other neurons could be classified as primarily low pass, band pass or band reject.
Examples of a low-pass, band-pass, and band-reject neuron are illustrated in Figure 4. The cell of Figure 4A responded with higher rates to low ripple frequencies [F(24,5) = 4.560; P = 0.0006]. The neuron of Figure 4B favored mid-range ripple frequencies, peaking at 8.25 cyc/oct [F(24,5) = 5.943; P < 0.0001]. Figure 4C shows a band-reject cell with a trough at ∼8.25 cyc/oct [F(24,5) = 9.93; P < 0.0001]. Though this neuron may look more low pass than band reject, the response at 8.25 cyc/oct is significantly less than that at 17.25 cyc/oct (P < 0.01). All of these neurons also displayed bandwidth effects (P ≤ 0.0008), though none showed a significant interaction between bandwidth and ripple frequency. On the basis of the function-fit criteria, 14 neurons were classified as high pass, 14 as low pass, 10 as band pass, and 16 as band reject in response to ripple frequency.
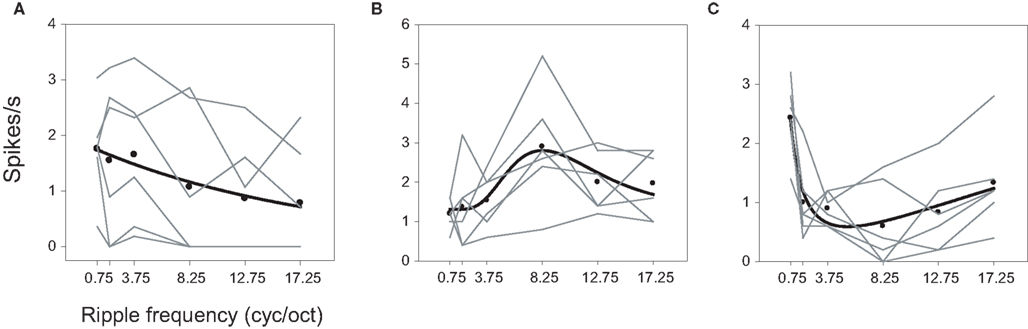
Figure 4. Ripple frequency tuning. Examples of (A) low-pass, (B) band-pass, and (C) band-reject neurons. The ▬ represent fits to spike rates averaged over bandwidth A: exponential decay, y = y0 + a exp (−x/b), B: log normal, y = y0 + a exp {−0.5 [ln(x/μ)/σ]2}, C: log normal where a is negative.
The parameters from the fitted functions characterizing ripple frequency tuning are described in detail in the Supplementary Material and in Figures S2 and S3, which illustrate the variety of tuning curve shapes. Some low- or high-pass neurons exhibited very sharp, almost step-like tuning to ripple frequency, while in other cases tuning was quite gradual. The band-pass functions were tuned over a large range that was centered over lower ripple frequencies (median = 3.78 cyc/oct), while band-reject neurons revealed a slightly more restricted range also centered on lower frequencies (median = 5.44 cyc/oct). Band-pass and band-reject tuning widths extended over large ranges as well, and were unrelated to the peaks or troughs of the tuning functions. In general, these results demonstrate a large degree of heterogeneity in A1 tuning to ripple frequency.
Table 2 summarizes the counts for the classifications based on function fits and on pair-wise comparisons (see Data Analysis). Almost 70% (64/93) of all neurons showing significant ripple frequency effects could be assigned to one of these four categories. In sum, across all neurons showing these effects, most responded more strongly to low ripple frequencies, as shown in Figure 5 
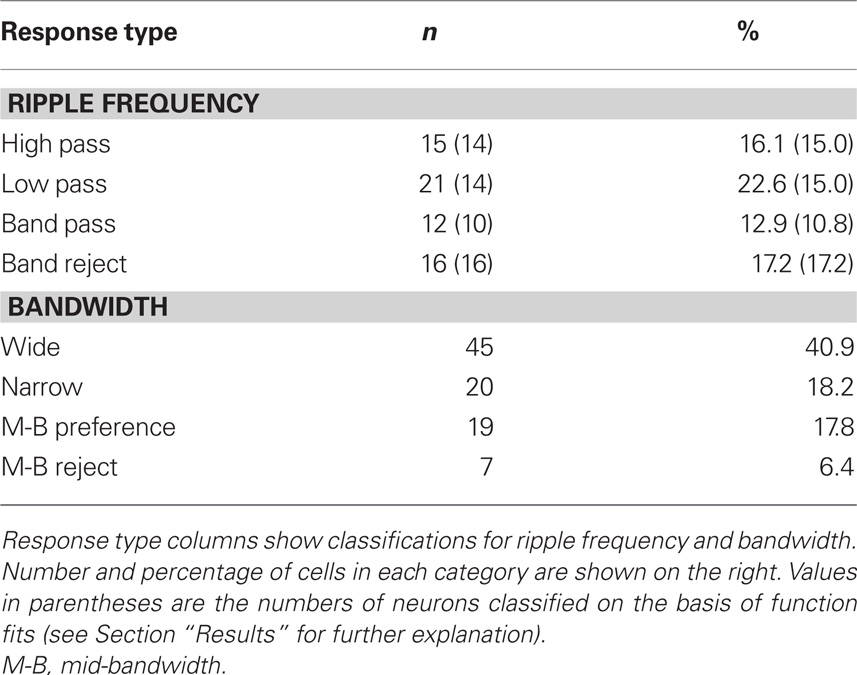
Table 2. Ripple frequency and bandwidth tuning.
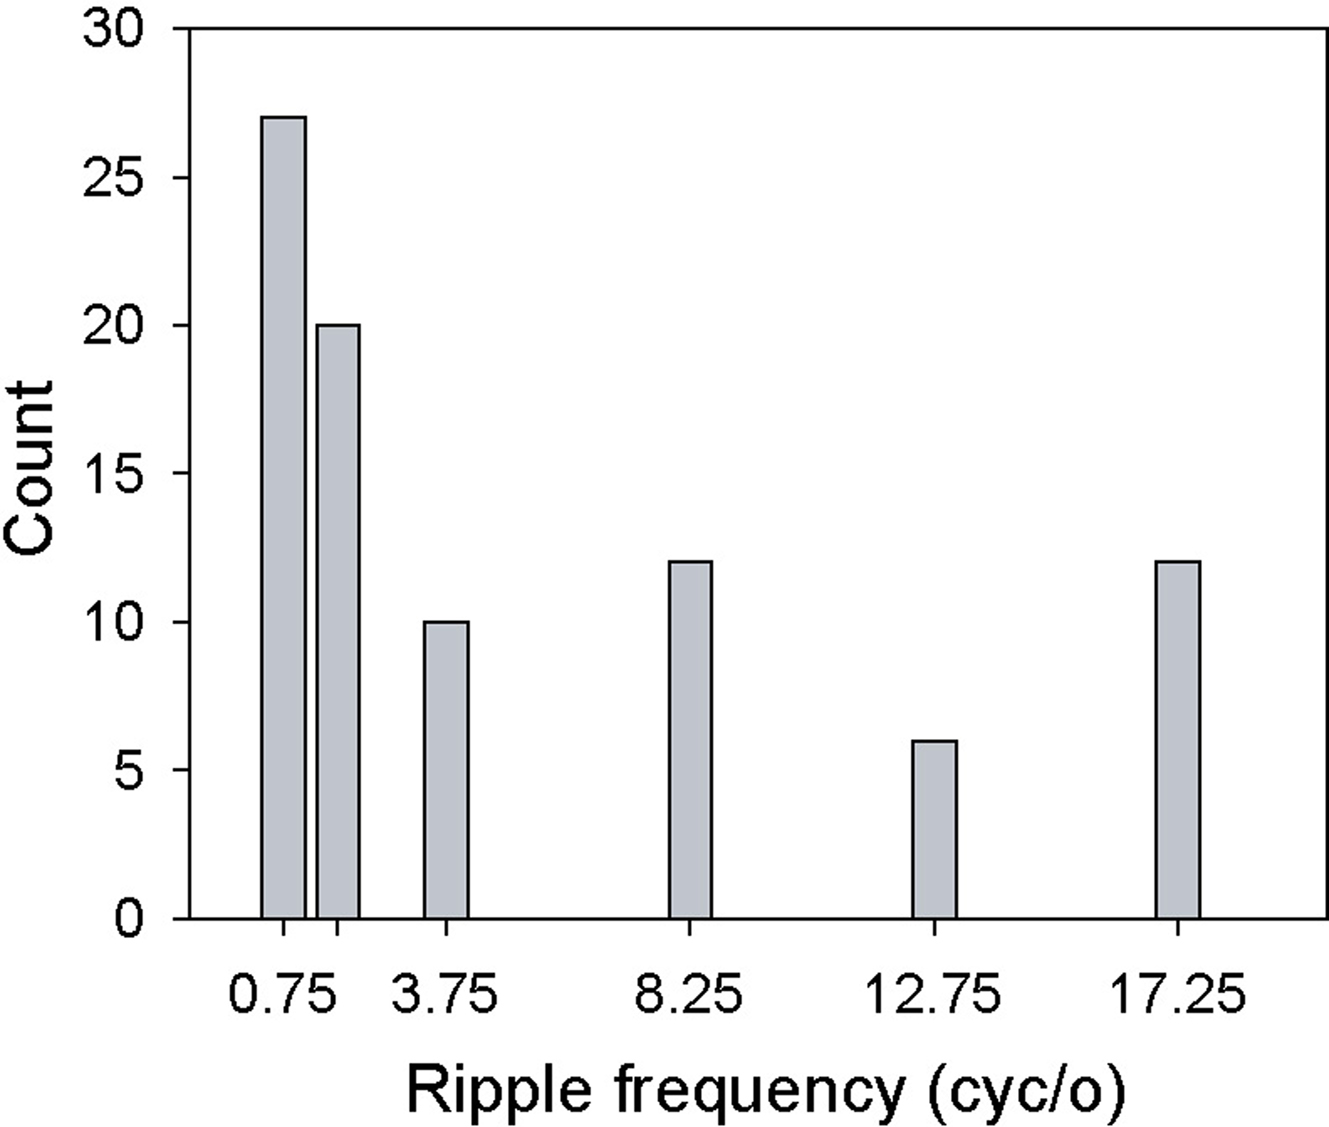
Figure 5. Selectivity for ripple frequency. Histogram displays the number of cells whose maximum response (spikes/s) fell at the specified ripple frequency.
Effects of Bandwidth
Inspection of contour and factorial plots indicated that most neurons were also selective for bandwidth, responding primarily to wide (Figure 3C), narrow [Figure 6A; F(24,5) = 13.10; P < 0.0001], or intermediate [Figure 6B; F(24,5) = 19.44; P < 0.0001] bandwidth stimuli. A few neurons favored both wide and narrow bandwidths, but exhibited low response levels to mid-bandwidth stimuli [Figure 6C; F(24,5) = 29.89; P < 0.0001]. The neurons in Figures 6A,C, but not Figure 6B, also exhibited significant effects of ripple frequency. None showed a significant interaction. Unlike the case with ripple frequency, all of the neurons that could be readily classified by eye could also be successfully fit by one of these functions.
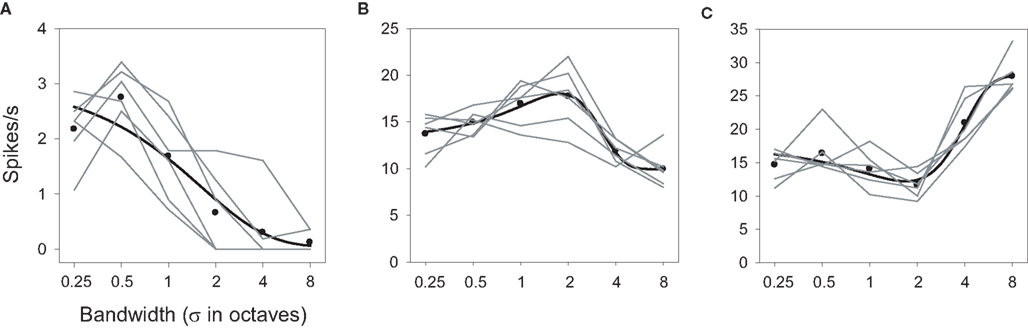
Figure 6. Bandwidth tuning. Examples of (A) narrow-band preference, (B) mid-bandwidth preference, and (C) bandwidth reject. The ▬ are best fitting functions as described in Figures 3 and 4.
The parameters from the bandwidth tuning functions are detailed in the Supplementary Material and Figures S4 and S5. As was the case with ripple frequency, sharpness of tuning varied over a large extent. For neurons selective for narrow or broad bandwidths, tuning slopes ranged from quite sharp to far more gradual. The tuning peaks of mid-bandwidth selective cells tended to center on more narrow than broad bandwidths (median = 1.86 oct), as did the troughs of mid-bandwidth reject neurons (median = 2.14 oct). The tuning widths of mid-bandwidth selective cells extended over a large range (1–7 oct) while the trough widths of the mid-bandwidth-reject neurons were much less variable, clustering tightly around 2 oct. There was no relationship between the centers of the neurons’ tuning peaks and troughs and their widths.
On the basis of the function-fit criteria, 45 neurons were classified as selective for wide-band, 20 for narrow-band and 19 for mid-bandwidth stimuli. Seven units were classified as mid-bandwidth reject neurons. Table 2 summarizes the counts for the classifications. About 80% of all neurons showing significant bandwidth effects could be assigned to one of the four categories. Most of the neurons showing significant effects of bandwidth favored wide-band stimuli as shown in Figure 7  There was no correlation between the neurons’ bandwidth and ripple frequency selectivity. In the case of both ripple frequency and bandwidth, cells not classifiable were idiosyncratic, sometimes possessing characteristics of more than one class or dissimilar to all classes.
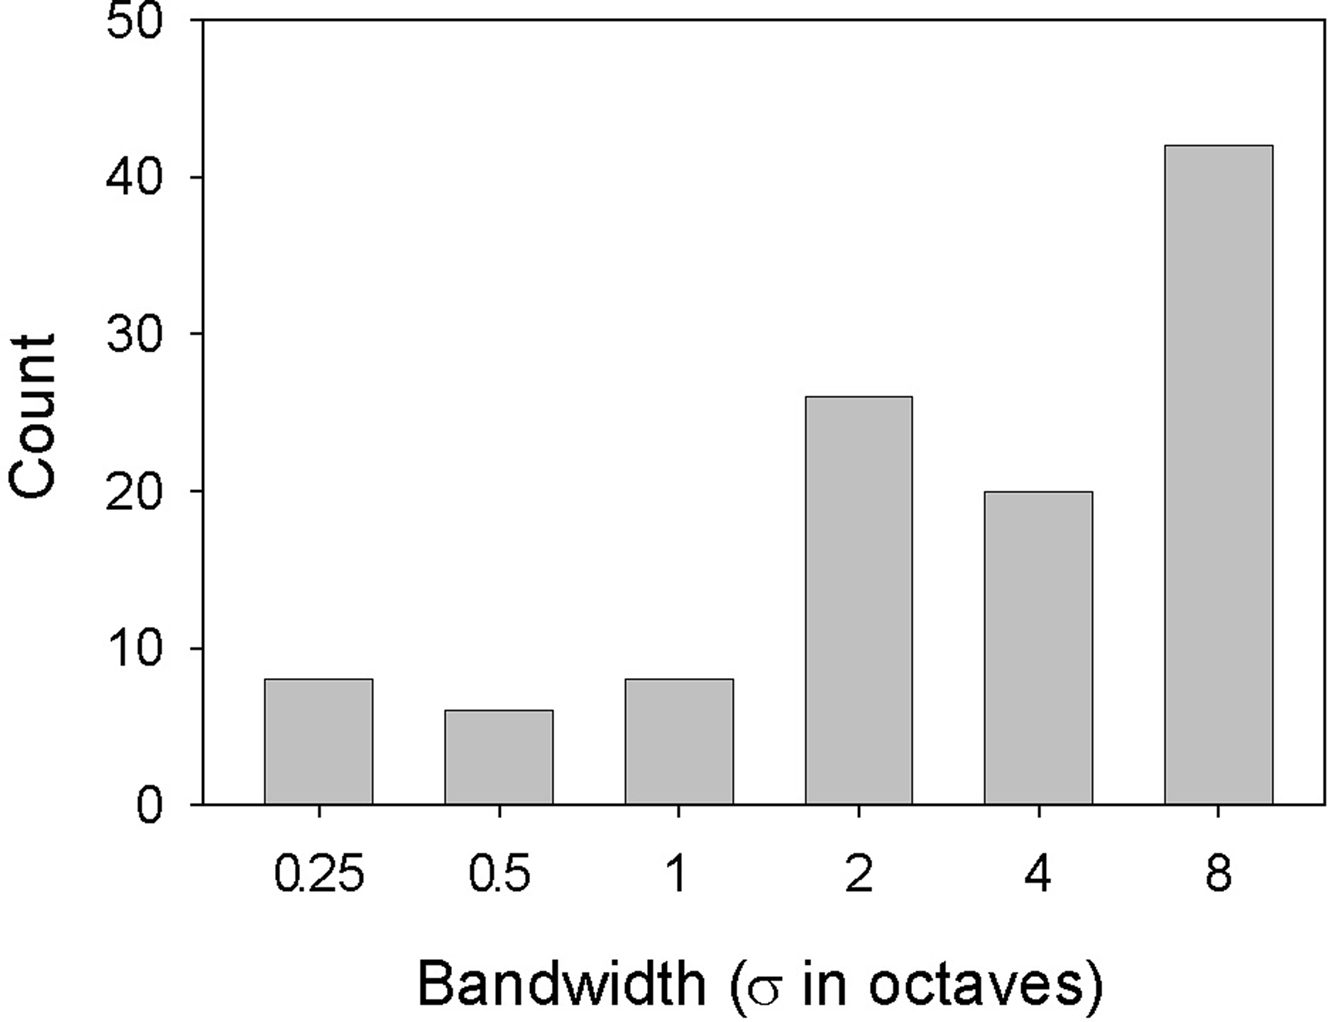
Figure 7. Selectivity for bandwidth. Histogram displays the number of cells whose maximum response (spikes/s) to each of the 36 spectral Gabor stimuli fell at the bandwidth for that stimulus.
Interactions between Ripple Frequency and Bandwidth
More than half (62%) of the neurons responsive to spectral Gabor stimulation also showed significant interactions between bandwidth and ripple frequency. The presence of an interaction implies that the effects of the two variables are not simply additive, but are either larger or smaller than that predicted from their sum.
The presence of interactions is apparent in the factorial plots of Figure 8 (shown in the center and right columns), revealed by a departure from parallel for the level functions (—). Unlike the results shown in Figure 6, here it is clear that the effect of one factor on responding depends on the value of the other factor. This is perhaps best seen in Figures 8A–C. The mean response over bandwidth (Figure 8B) reveals this neuron to be low pass with respect to ripple frequency [F(24,5) = 39.616; P < 0.0001], but the contour plot (Figure 8A) shows that this is true only for bandwidths >0.5 oct. Similarly, the mean response over ripple frequency (Figure 8C) indicates that the neuron favors narrow bandwidth stimuli [F(24,5) = 67.327; P < 0.0001], but the contour plot shows that this is true only for ripple frequencies >1.75 cyc/oct. It is also clear that the activity within the effective ranges is augmented over what one would predict from the averaged responses [F(24,5,5) = 13.847; P < 0.0001]; the selectivity of the neuron within these ranges is greater than that displayed by the means.
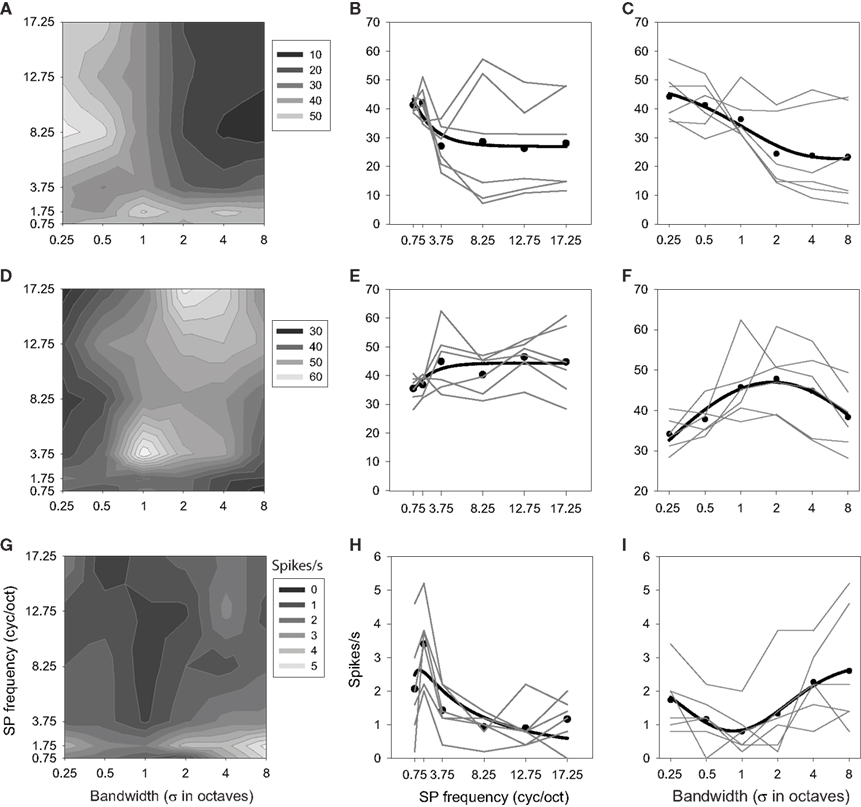
Figure 8. Interaction effects between ripple frequency and bandwidth. Each row depicts results from one neuron. Contour plots (A,D,G) and factorial plots (B,C,E,F,H,I) display responses as a function of both variables. Other details as in Figures 4 and 6.
Another neuron (Figures 8D–F) was classified as high pass for ripple frequency [F(24,5) = 25.718; P < 0.0001], but inspection of the factorial and contour plots reveals that the neuron only displays clear high-pass tuning at the largest bandwidths (4 and 8 oct). This unit was classified as selective for mid-bandwidth stimuli [F(24,5) = 23.697; P < 0.0001], but this tuning appears robust only at 3.75 and 17.25 cyc/oct, with a corresponding shift in peak bandwidth from 1 to 2–4 oct [F(24,5,5) = 5.507; P < 0.0001].
The third neuron (Figures 8G–I) was classified as band pass to ripple frequency [F(24,5) = 13.176; P < 0.0001], and band-pass tuning (to 1.75 cyc/oct) does appear at all bandwidths [F(24,5) = 8.516; P < 0.0001], though the strength and sharpness of this tuning depends on the bandwidth of the stimulus [F(24,5,5) = 1.570; P < 0.0398]. Similarly, this cell was classified as a bandwidth reject neuron and this general trend appears to occur at all ripple frequencies, though the magnitude of this effect, as well as the position of the trough, depends on this frequency.
These results are illustrative of the variety of responses displayed by neurons that showed an interaction. These results also illustrate that these cells display more complex behavior and greater selectivity than the main effects described in the previous sections would indicate.
The spike rates of neurons displaying an interaction tended to be higher than those that did not (median = 14.66 vs. 3.94 spikes/s, rank-sum P < 0.001, N = 82,39), a possible basis for the difference. This conclusion is supported by the fact that the neurons in the interaction group were more likely to show main effects of ripple frequency and bandwidth  a possible result of diminished effect size and statistical power in the non-interaction group. Another possible underlying difference is that the non-interaction neurons show greater trial-by-trial spike-count variance than those showing an interaction, such that stimulus driven effects are obscured. We used the Fano factor (the response variance divided by the mean) to test this hypothesis, which was not supported [median = 1.59 (interaction) vs. 1.39, rank-sum P = 0.212, N = 82,39]. Given these results, and that no difference in ripple frequency or bandwidth selectivity was found between the two sets of neurons it appears that the principal difference between these groups was response rate.
Modeling Results and Experimental Effects
We examined whether the sorts of main effects and interactions we found in these experiments were compatible with a simple model of spectral integration. The model, described formally by Eq. 1 and schematically in Figure 9A, consisted of a either a Gabor or DoG linear weighting function, or filter. As described in Section “Materials and Methods”, the response (R) of the filter is determined by computing the dot product between the vector representing the power spectrum for each stimulus and the filter vector. This output is proportional to the match between a spectral input pattern and the shape of the filter. The modified version in Eq. 2 subjects the filter output to rectification, and so restricts R to the positive portion of the output function in Figure 9A (solid line).
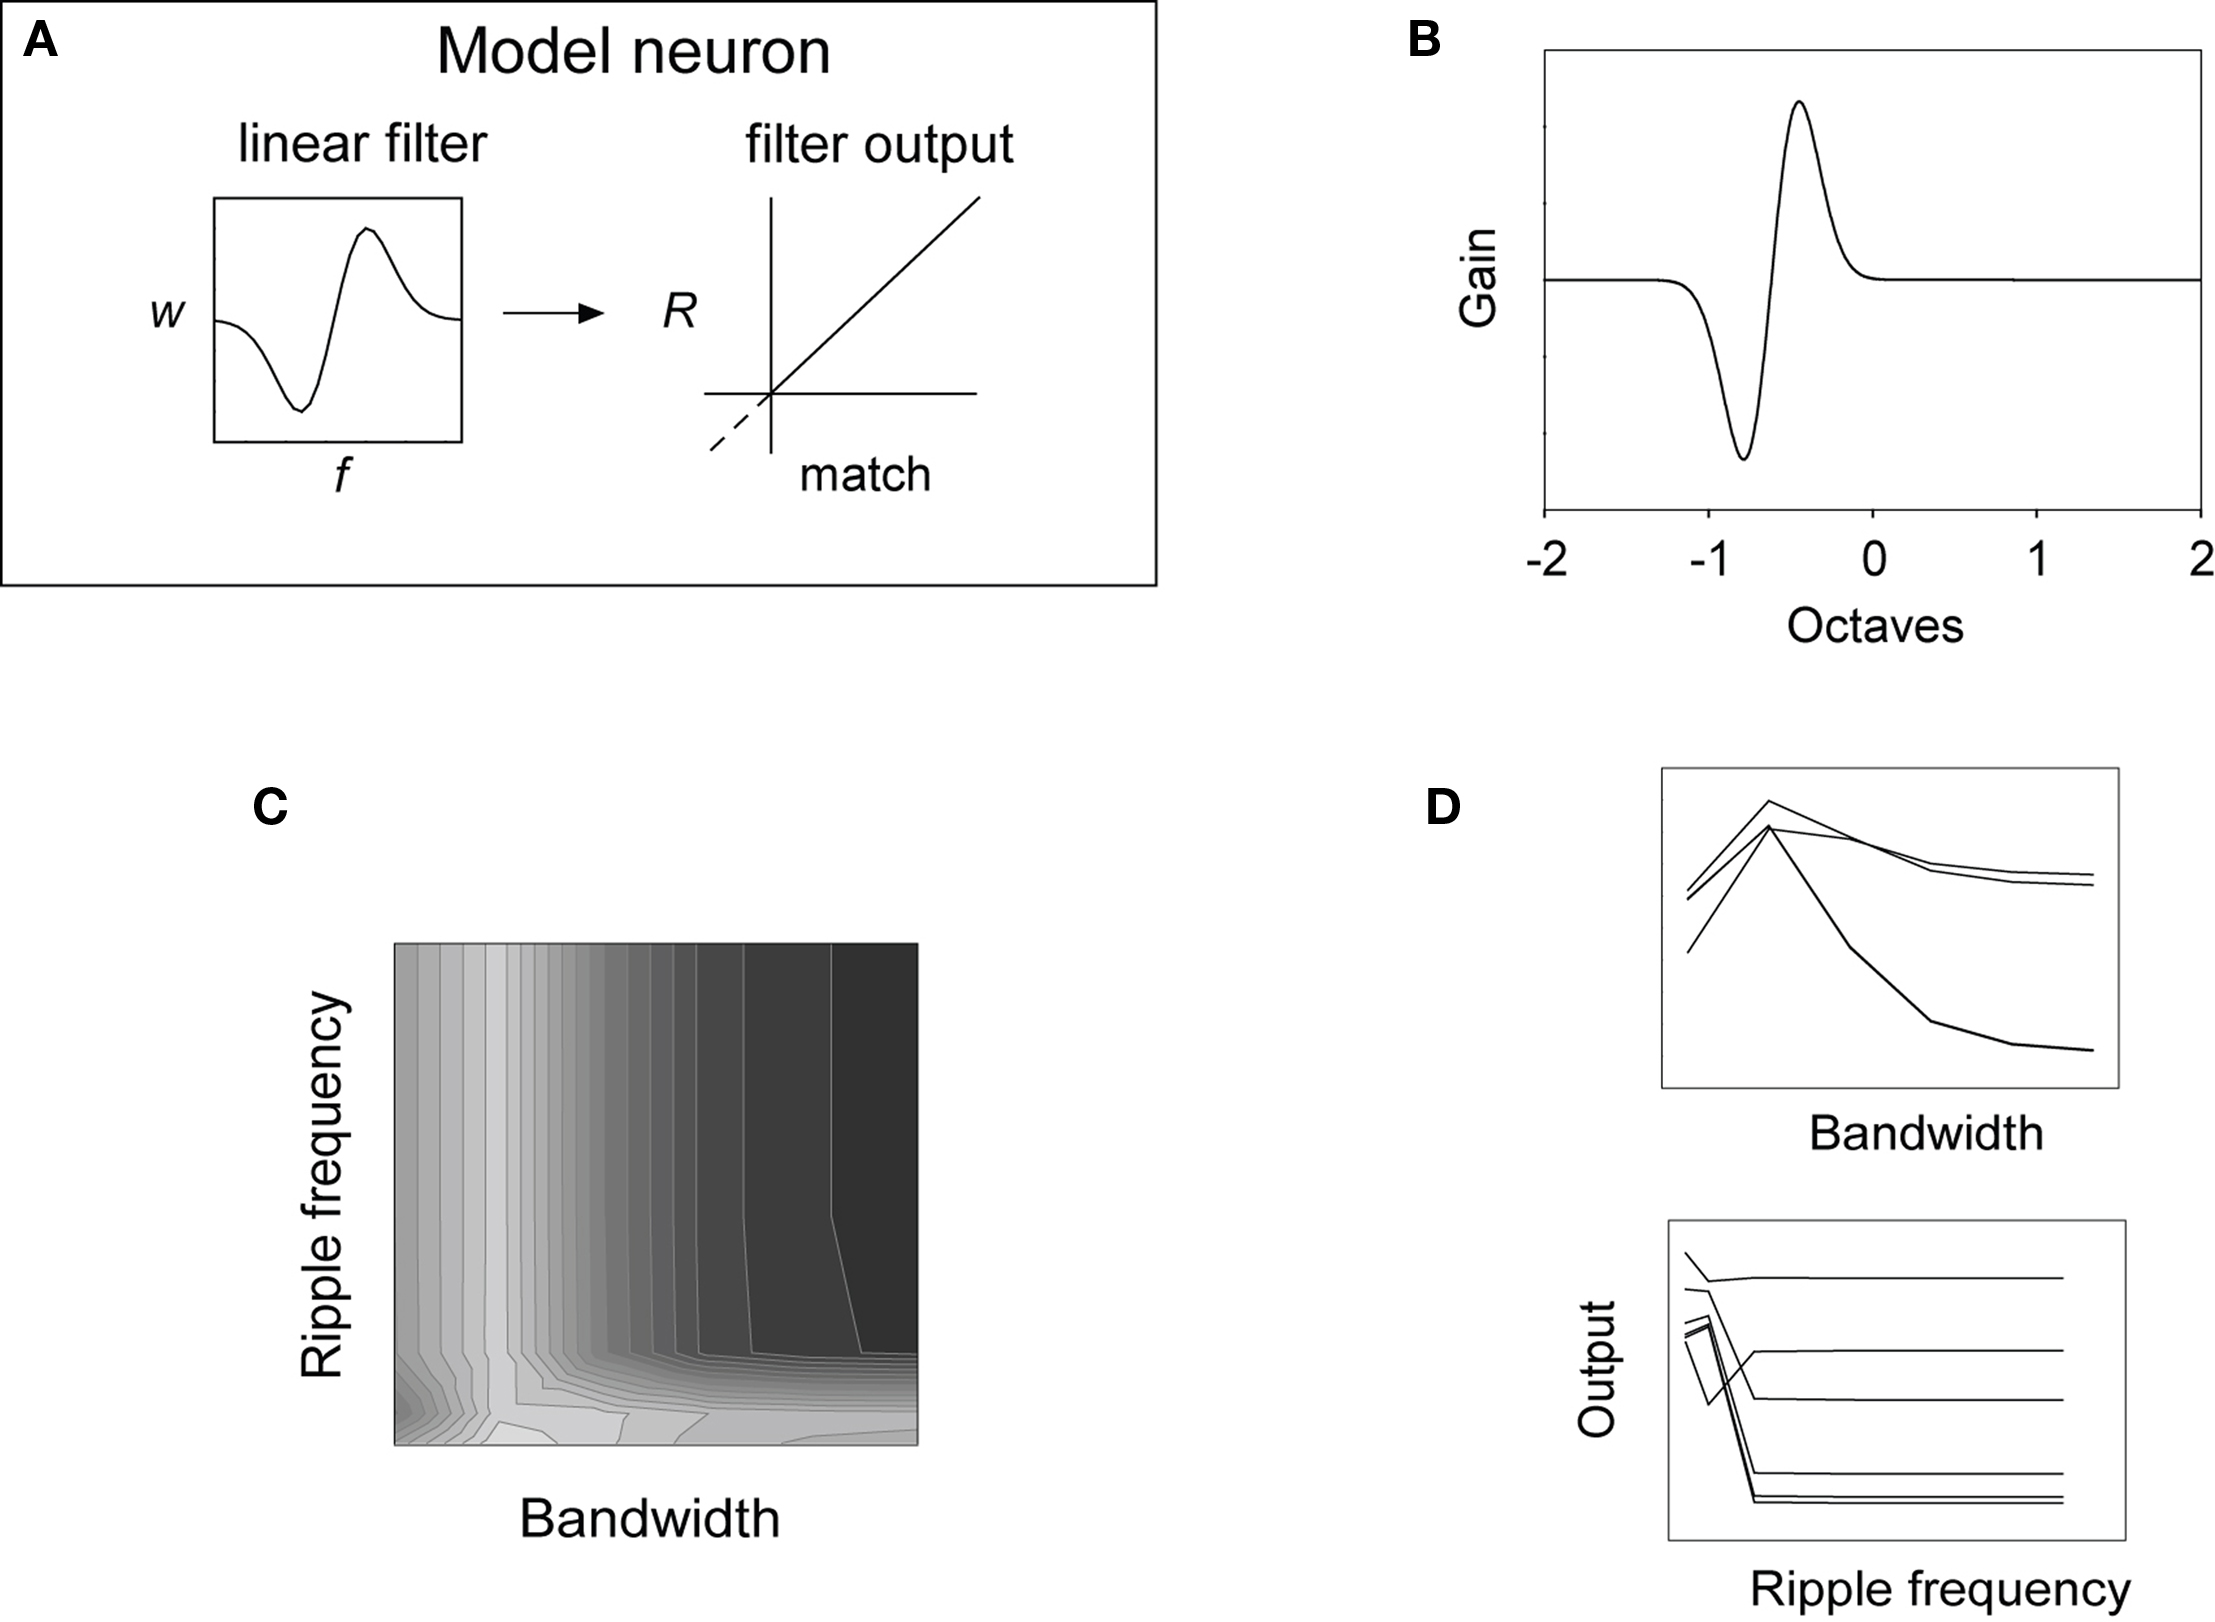
Figure 9. (A) Schematic of the neural model presented in Eq. 1, consisting of a linear filter (left) with output (right) represented by the dashed and solid lines. The solid line in the response plot represents the rectified output of Eq. 2. (B) Gabor filter consisting of 1024 weights [ripple frequency = 0.93 cyc/oct; bandwidth (σ) = 0.17 oct; 1/2 power bandwidth = 0.40 oct]. (C) Contour plot showing the response of the non-rectified filter in (B) to the 36 stimuli when implemented in the model above (A). The pattern of responding is similar to that of the neuron shown in Figures 8A–C. (D) Factorial plots showing filter response strength to each variable at each level of factor; the non-parallelism of the level functions is evidence of an interaction.
An example of a spectral Gabor filter is shown in Figure 9B. Its non-rectified output appears in the contour and factorial plots of Figures 9C,D, behavior that is similar to that of a subset of our neurons. This model neuron behaves essentially as a low-pass filter over the tested ripple frequency range, and is selective for narrow bandwidths, though these effects are not simple. The effects are not additively separable, indicative of an interaction, as is illustrated by the factorial plots in Figure 9D.
Inspection of the Gabor and DoG linear models showed that incremental shifts in the values of the parameters (Gabor phase, ripple frequency and width; DoG Gaussians’ relative amplitudes, means and absolute and relative widths), as well as the position of the filters relative to the stimuli, were likely to produce changes in both main and interaction effects. In some cases these effects were gradual, in other cases quite abrupt. With the appropriate parameter settings, both the Gabor and DoG filters were able to qualitatively reproduce the types of main effects and interactions we found (see Figure S6 in Supplementary Material for more examples).
The filters in Figures 9B and Figure S6 in Supplementary Material were derived from fitting the parameters of Eq. 1 to our neural response data (in the case of Figure 9B, to the neuron shown in Figures 8A–C). To give some indication of how closely the Gabor and DoG models were able to approximate the behavior of our neurons, a direct comparison of model output with the responses of several neurons is presented in Figures 10 and 11. These figures display the results from fitting parameters for the Gabor (Figure 10) and DoG (Figure 11) models for four cells. The Gabor filters (Figure 10) were typically circumscribed and comprised two or three lobes. The DoG filters (Figure 11) also tended to be circumscribed, but often displayed a large disparity in the size of the positive and negative lobes. This difference evidently enabled the DoG function to provide clearly better fits than the Gabor in a number of cases.
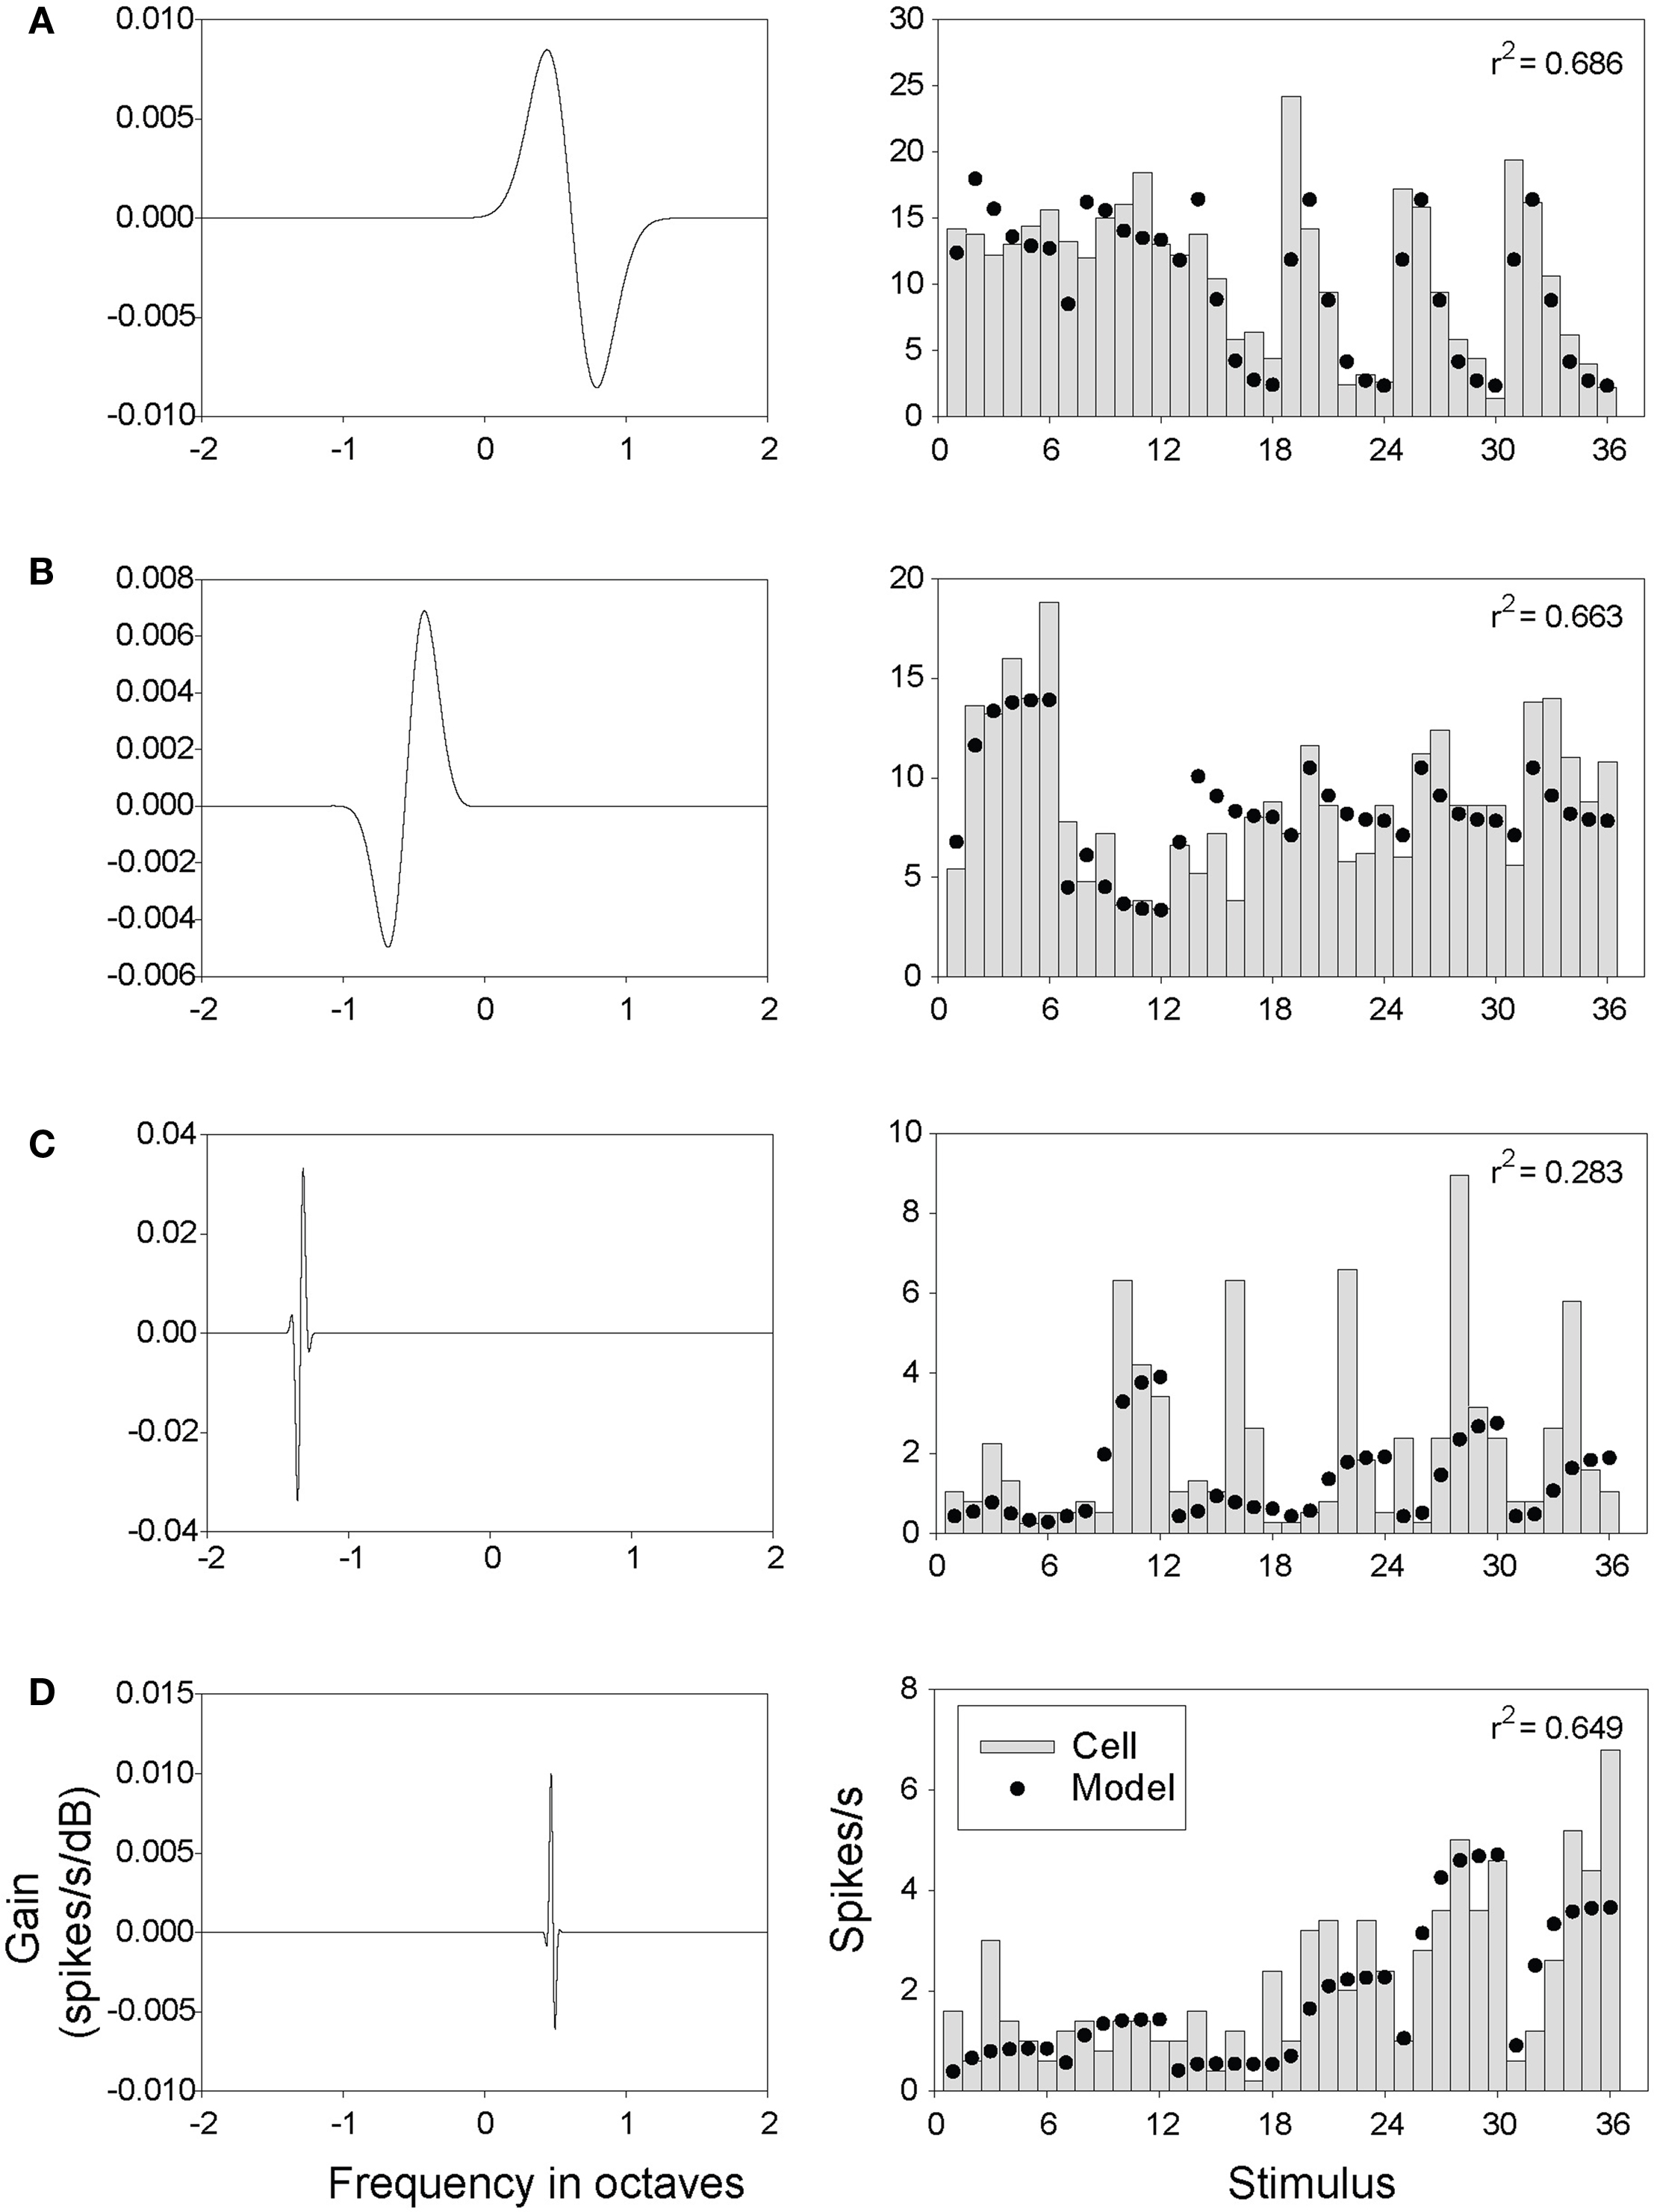
Figure 10. Gabor model filters and outputs. Each row represents the results from a single neuron (A–D, left column). Each plot depicts a Gabor filter (weight vector) obtained for a single neuron using the optimization procedure used with Eq. 1 and the Gabor function as described in Section “Materials and Methods”. The gain of each filter is plotted as a function of frequency (A–D, right column). Model (•) and neural responses (█) are plotted for each of the 36 spectral Gabor stimuli. Stimuli are ordered by bandwidth (0.25, 0.5,…,8 = 1, 2,…,6; 7, 8,…,12, etc.) embedded within ripple frequency (0.75 = 1–6, 1.75 = 7–12,…,17.25 = 31–36).
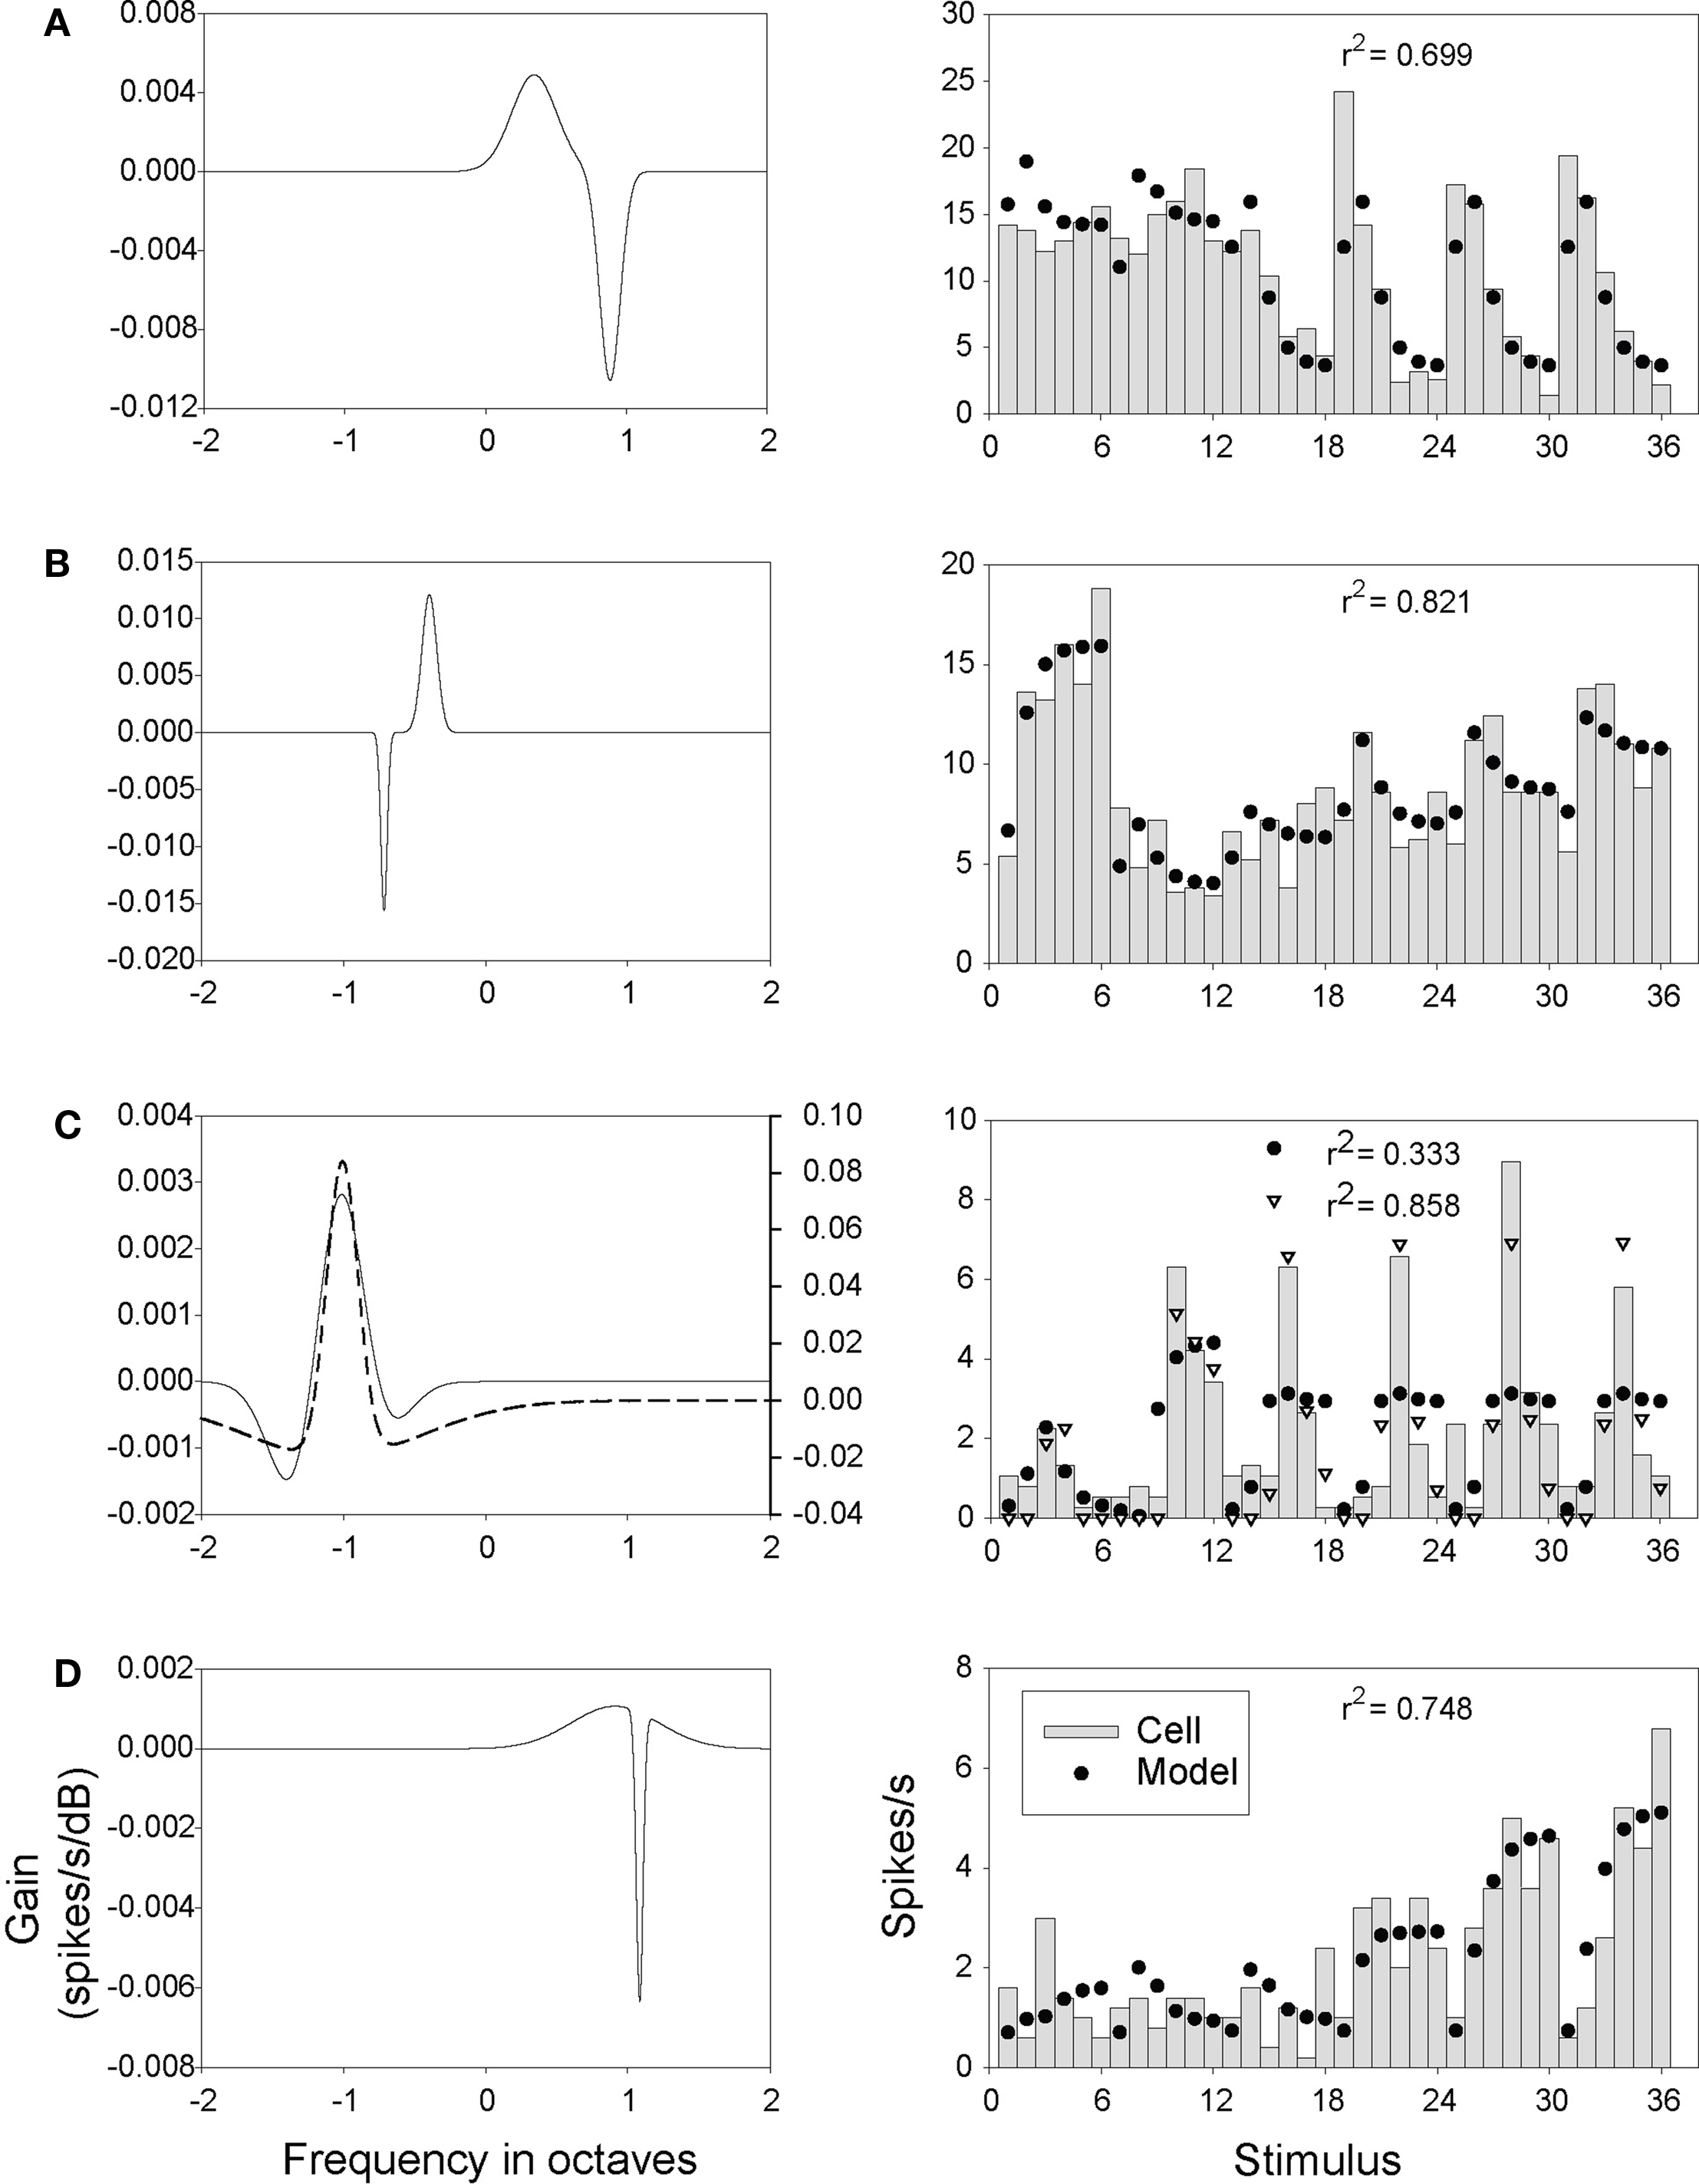
Figure 11. DoG model filters and outputs. Details as in Figure 10, except that the optimization procedure was applied to Eq. 1 using the DoG weight function to obtain the filters (A-D, solid lines). The filter represented by the dashed line (C) was obtained by applying the optimization procedure to Eq. 2 (which added rectification to Eq. 1). The output of this model (open triangles) is shown on the left.
Comparison of the Gabor (Figure 10) and DoG (Figure 11) models illustrates the fact that quite differently shaped filters could produce a similar response pattern (Figure 10C vs. Figure 11C, and Figure 10D vs. Figure 11D). This is evidence that our limited data set did not sufficiently constrain our search technique such that it was able to reliably differentiate between various plausible filter shapes. It did not, therefore, provide a rigorous quantitative test of the linear model, though it does provide qualitative support for the plausibility of the model for generating our data.
Depending on the choice of model parameters, the Gabor and DoG filters may be positively or negatively biased. The more negative the bias in filter weights, the more likely the dot product in Eq. 1 will be negative, which in Eq. 2 will yield a rectified output (R) set to 0. Equation 2 was expected to improve model performance in the case of neurons with low spontaneous spike rates, and poorly driven by some stimuli, and so having rates at or near zero in some instances. This was the case with the neuron shown in Figure 11C; in this case the rectified model was better able to capture both the high peak responses and near-zero lows. Most neurons, however, exhibited sufficiently high background rates and were responsive enough that there was no difference in performance found between the linear and rectified models.
Discussion
In these experiments we examined the responses of primary auditory cortical (A1) neurons to complex spectral stimuli varying in both bandwidth and pattern (ripple frequency). Most of the responsive neurons were tuned to either or both. Almost 2/3 of the cells showed an interaction between these variables meaning that, for these neurons, the effects of one variable were conditional on the value of the other. This result underscores the limitations of characterizing the bandwidth of A1 neurons without also specifying stimulus spectral pattern.
Selectivity for Ripple Frequency and Bandwidth
Studies on AC neurons employing static ripple stimuli are the most similar to our own, and so their results may be the most relevant to ours. These studies have shown that neurons’ best ripple frequencies range from ∼1 to 4 cyc/oct (tested range = 0–8 cyc/oct) (Schreiner and Calhoun, 1994; Calhoun and Schreiner, 1998), and 0.2 to 3 cyc/oct (tested range = 0–4 cyc/oct) (Shamma et al., 1995) with means of 1.1 and 1.0 cyc/oct, respectively. As Figure 5 shows, our neurons’ preferred ripple frequencies vary across the tested range, from 0.75 to 17.25 cyc/oct, with a mean (median) of 5.34 (1.75) cyc/oct. Figure 5, however, reveals a low-frequency (0.75–1.75 cyc/oct) peak close to the median, so it seems likely that the higher mean found in our study is due to the larger ripple-frequency values tested. Our results, however, demonstrate that selectivity for ripple frequency in a majority of A1 neurons is dependent on bandwidth. So, for example, a neuron displaying an interaction might exhibit tuning for two different ripple frequencies as a function of bandwidth (e.g., Figures 8A,B).
Studies have generally found quite a bit of diversity in A1 neurons’ stimulus bandwidth selectivity. It is not uncommon to hear that A1 cells prefer pure-tone stimulation over narrow- and broad-band noise stimuli, a statement that does find support (Rauschecker and Tian, 2004), although roughly equivalent responsiveness to these stimulus classes has also been found (Recanzone, 2000; Hromadka et al., 2008). In support of a narrow-band bias, Schreiner and Calhoun (1994) found a preference for narrow bandwidth stimuli; increasing the width of their ripple stimuli decreased the strength of responding in most cases. Narrow- and mid-bandwidth stimuli have also been found to be particularly effective when placed near the spectral edges of A1 neurons estimated STRFs (Gourevitch et al., 2009).
Numerous studies, however, show that at least some A1 neurons prefer more broad-band, complex sounds such as tone combinations (Suga et al., 1978; Schwarz and Tomlinson, 1990; Nelken et al., 1994a; Schulze and Langner, 1999; Misawa and Suga, 2001; Kadia and Wang, 2003), or band-limited noise (“edge”) stimuli (deCharms et al., 1998; Qin et al., 2004), which might be a consequence of prevalent intra-cortical, horizontal projections (Kaur et al., 2004, 2005). Amplitude and frequency modulation of sine waves produce signals having broader spectra than pure tones, and are known to be quite effective in driving many A1 cells (O’Neill and Suga, 1982; Schreiner and Urbas, 1986; Mendelson et al., 1993; Eggermont, 1994; Gaese and Ostwald, 1995; Bieser and Muller-Preuss, 1996; Heil and Irvine, 1998; Fishbach et al., 2001; Lu et al., 2001; Barbour and Wang, 2002; Bleeck et al., 2003). Many A1 neurons are also well driven by natural stimuli, which are usually broad-band but also typically have large amplitude and frequency modulations, which might account for their efficacy (Winter and Funkenstein, 1973; Creutzfeldt et al., 1980; Wang et al., 1995; Nelken et al., 1999; Rotman et al., 2001; Wang and Kadia, 2001; Bar-Yosef et al., 2002; Machens et al., 2004; DiMattina and Wang, 2006; Schnupp et al., 2006; Gourevitch and Eggermont, 2007).
The studies above portray a great deal of diversity in the sound selectivity of A1 neurons, and give little indication of a particular bandwidth preference. In contrast, our study shows a broad-band bias (Figure 7), with about three times as many neurons responding best to relatively wide (≥2 σ) than narrow bandwidths. As with ripple frequency, interactions affected bandwidth tuning, so this broad-band bias may have resulted from particularly effective combinations of the two variables at large bandwidths. If most A1 neurons simply integrated over signal energy without regard to a sound’s spectral structure, one would expect that broad-band, homogeneous noise would be the most effective stimulus for these cells, but it is not. One might argue for a facilitative effect of amplitude modulation in our results, but envelope variation tends to become less regularly modulated with increasing bandwidth in spectral Gabors (see Figure 1). Instead, our results show that is it not bandwidth per se that is important, rather the pattern of stimulation within that band. The results also show that broad-band stimuli can be generally more effective than narrow-band signals given the appropriate pattern of stimulation. Given our experimental results, it seems likely that this effectiveness derives from the appropriate juxtaposition of the peaks and troughs of a spectral Gabor stimulus with the interleaved excitatory/inhibitory bands of a neuron’s RF. It appears, then, that a larger proportion of A1 neurons are able to spectrally integrate over broader frequency ranges than previously thought.
Interactions, Non-Additive Effects, and the Neural Model
An interactive effect implies that the responses of cells to stimuli varying in both bandwidth and pattern cannot be described by additively separable functions of the two factors. This point may be clarified by representing these ideas symbolically, by first describing the neural response as a function of two independent variables

In this equation, the terms α and β represent the effects of two variables on the response (spike count), over levels j and k. Equation 3 states that the response (y) is a sum of the effects of the two variables, plus a constant (μ, the mean over all observations) and an error term for each observation (εijk), and where i denotes the number of observations. Results showing both main effects and an interaction may be represented by

where the additional term (αβ)jk represents the joint effect or interaction between the variables. This is the standard model for a two-factor ANOVA (Hays, 1988). In this case, the dependent variable (the cell’s response) cannot be defined simply in terms of the sum of the effects of two independent variables; instead the interaction term is needed to represent the effect beyond that attributable to the main effects alone, at each level of factor.
This interaction can be understood in terms of the structure of the spectral Gabor and linear spectral filtering, which may not be obvious. Recall that the Gabor stimulus results from multiplying a sinusoid by a Gaussian function. If we consider the spectral RF of an A1 neuron to operate, in the simplest case, as a linear filter (as in Eq. 1), then the output of the neuron would be proportional to the match between an input spectral pattern and the shape of the RF. Because this pattern itself results from the product of two functions, we would not expect the neuron’s response to the pattern, across levels of factor, to be describable in terms of additively separable functions of the variables, such as in Eq. 3. Rather, a more complex relation such as that described by Eq. 4 would be needed, one that includes an interaction term to account for the response above (or below) the additive effects, at each combination of factor and level. Though the model we’ve described operates only in the spectral domain, these sorts of interactions would also be expected from any neuron whose response was well described by a linear STRF model.
If this interaction reflects a linear process in our neurons it raises the question of why an interaction was absent in almost half of the responsive cells. In many cases the answer may be response strength, since neurons with higher spike rates were more likely to exhibit an interaction, a possible consequence of effect size and statistical power. However, it is also possible that at least some of these neurons – ones that did respond robustly – were independently tuned to one or both of the variables. This would imply the existence of a significant neural non-linearity preventing transmission of the interaction inherent in the signal. Non-linearity may be a better explanation for the behavior of moderate- to high-rate neurons not showing an interaction, since there was considerable overlap between the two spike rate distributions, with 10 cells (∼1/4) in the non-interaction group having rates above the interaction-group median rate (e.g., Figures 6B,C). In this case low statistical power does not seem a reasonable explanation for the absence of an interaction for these neurons.
The fact that the linear model of Eq. 1 was able to produce interactions similar in form to those of our A1 neurons is an important point, because significant variable interactions have been previously found in cortical sensory single-unit studies (Gawne et al., 1991; Bizley et al., 2009), but the basis for these interactions is not clear. Bizley et al. (2009), for example, found interactions between pitch (number of spectral peaks) and timbre (peak position), in a large proportion (∼40%) of AC neurons. The authors conclude that these neurons respond non-linearly to feature combinations, but our results suggest that these responses may well be linear, with the non-linearity inherent in the signal transformations. Of course, our results do not necessarily imply that most of our neurons behave primarily as linear spectral filters. Comparison of our experimental results to the output generated by Eq. 1 (see Figures 10 and 11) shows that the neural responses across the stimulus set tend to be more complex than those produced by the model. However, it is notable that our results are congruent with studies showing that a large proportion of AC neurons exhibit linear spectral integration for ripple stimulation (Shamma and Versnel, 1995; Shamma et al., 1995; Kowalski et al., 1996; Calhoun and Schreiner, 1998; Ahmed et al., 2006; Klein et al., 2006).
There are also several neural sources of an interaction that may be operating in our experiments. One is response facilitation or enhancement above that predicted by linear summation across multiple excitatory areas of a cell’s RF. Enhancement of cortical cell responses to tonal stimuli has been most commonly identified in the bat (Suga et al., 1979; O’Neill and Suga, 1982; Suga and Tsuzuki, 1985; Tsuzuki and Suga, 1988; Schuller et al., 1991; Fitzpatrick et al., 1993; Paschal and Wong, 1994; Misawa and Suga, 2001), and evidence for it has also been found in the cat (McKenna et al., 1989; Sutter and Schreiner, 1991; Brosch and Schreiner, 2000), rat (Pandya et al., 2008), and primate (Brosch et al., 1999; Kadia and Wang, 2003). It should be noted that tonal facilitation is not unique to cortex, but has also been identified in IC (Portfors and Felix II, 2005; Mittmann and Wenstrup, 1995; Winter and Palmer, 1995; Finlayson, 1999; ) and medial geniculate (Olsen and Suga, 1991). Interactions may also obviously result from non-linearities such as saturation, or rectification due to thresholding.
Our model fits were not intended as a rigorous test of the validity of the linear model. The modeling is valuable, however, because it shows how a relatively simple model can qualitatively reproduce our basic experimental results – which have an often puzzling variety and complexity – and so places our results within a theoretical framework. It also demonstrates the utility of using a non-linear search technique for fitting formal models to neural responses. This method has an important advantage over traditional white-noise spike-triggered averaging techniques in that it does not require a spectrally white input stimulus, and so may be a potentially powerful tool when used with non-white noise signals such as natural stimuli.
Acoustic Interactions, Feature Invariance, and Coding of Natural Sounds
Although the analysis above might seem mathematically trivial, identifying the possible cause of an interaction with multi-parameter variations in an input signal is an essential step for understanding how simultaneous changes in the acoustic parameters defining natural sounds are encoded by auditory neurons. Information in many natural sounds is conveyed or affected by multiplicative operations on a signal’s spectrum, changes that are often governed by multiple factors. The complex spectral patterns of mammalian vocalizations, for example, result from vocal tract filtering of the vibrations produced by the vocal cords creating spectral peaks at the resonant frequencies (formants) of the vocal tract (Bradbury and Vehrencamp, 1998). The specific shape and bandwidth of these patterns depend upon the geometry of the vocal tract generating a particular sound (in humans, a phonetic unit), as well as factors such the sex and age of a vocalizer (Fant, 1973). Other examples involving multiplicative spectral transforms are the changes in intensity of a carrier signal that occur due to amplitude variations in a source (e.g., a vocalizer), or when the distance between a source and listener changes (spreading loss).
According to the linear model represented by Eq. 1, variations in an acoustic signal resulting from the product of two or more variables would produce an interaction between the factors, because the model simply performs a linear transformation of the input. It would not be surprising to find that a neuron whose response was at least moderately linear would exhibit interaction effects to these sorts of operations. Given that many AC neurons may be described as having both a linear and non-linear response component (Atencio et al., 2008; Pienkowski et al., 2009) the interactions reported here are not unexpected. If this is the case, it raises the question of whether AC neurons are able to invariantly code for certain information-bearing parameters (such as a particular configuration of spectral peaks as in formant analysis) and, if so, how.
To understand the behavior of our neurons it may help to draw a parallel between “interaction” and “non-interaction neurons”, and the distinction between simple and complex cells in primary visual cortex. The behavior of the “interaction cells” appears consistent with that of a linear spectral filter, and may be analogous to that of simple cells with respect to spatial summation. Like simple cells they would be expected to respond vigorously to specific, local changes in stimulus energy and so should display little if any feature invariance. “Non-interaction neurons” selective for bandwidth and/or ripple frequency do not shift their tuning to one variable when the value of the other variable changes, and so display a type of feature invariance. This behavior is more akin to that of complex cells, which also show a kind of feature invariance (insensitivity to phase in a grating stimulus).
Feature invariance has generally been modeled as a conjunction or logical “AND” operation, wherein outputs from several (linear) filters, each coding for a particular stimulus transformation (e.g., translation), are non-linearly combined (Hubel and Wiesel, 1962; Grossberg, 1973; Fukushima et al., 1983; Riesenhuber and Poggio, 1999; Geman, 2006; Cadieu et al., 2007; Ison and Quiroga, 2008; Kouh and Poggio, 2008). Computationally this non-linear operation can also be considered a divisive normalization, and can be neurally implemented by means of feedforward shunting or lateral inhibition acting on a central excitatory unit (Kouh and Poggio, 2008). Functionally this circuitry is able to exhibit a high degree of selectivity and invariant tuning for higher-order features, particularly when employed in a multiple-layered hierarchy.
Although this computational circuitry has primarily been used to explain feature selectivity and invariant object recognition in visual cortical neurons, a similar process may explain invariant coding in auditory cortex as well. Recent work suggests that some AC neurons respond invariantly to co-varying parameters that define particular “auditory objects” such as an echolocation target or vocalization. In bat AC, a small proportion of AC cells respond invariantly to covariations in echo intensity and duration (Firzlaff et al., 2007), or to echo intensity and spectral interference pattern (Firzlaff and Schuller, 2007), variations that are consistent with object scaling (a change in object size with distance). In gerbil A1 and IC, a small proportion of neurons show invariant tuning to particular vowel sounds under different degrees of (log) frequency translation (which produce linear bandwidth changes), variations that correspond to the vocal tract length (size) of a talker (Schebesch et al., 2010). This invariant behavior requires non-linear computations of the sort described above. In all of these cases, however, the percentage of neurons showing invariant behavior is quite small, implying that invariant coding is sparse in AC. This finding, and the fact that we found interaction effects in most of our neurons, suggests that the majority of A1 neurons are involved in relatively low-level feature encoding that is not invariant to scaling. It is also possible however, that invariant coding is more prevalent than these studies suggest, but that the relevant acoustic parameters have not yet been tested, a challenge for future research.
Conflict of Interest Statement
The authors declare that the research was conducted in the absence of any commercial or financial relationships that could be construed as a potential conflict of interest.
Acknowledgments
This work was supported by the National Institutes of Health (National Institute of Deafness and Communication Disorders Grant DCO2514) and the J. S. McDonnell Foundation. We thank P. Barruel for assistance in performing some of the experiments, A. Graziano, P. Nyugen, M. Niwa, and E. A. Marshall for perfusion and histology work, and J. S. Johnson for valuable comments on the manuscript.
References
Abeles, M., and Goldstein, M. H. Jr. (1970). Functional architecture in cat primary auditory cortex: columnar organization and organization according to depth. J. Neurophysiol. 33, 172–187.
Ahmed, B., Garcia-Lazaro, J. A., and Schnupp, J. W. (2006). Response linearity in primary auditory cortex of the ferret. J. Physiol. 572, 763–773.
Atencio, C.A., Sharpee, T. O., and Schreiner, C. E. (2008). Cooperative nonlinearities in auditory cortical neurons. Neuron 58, 956–966.
Barbour, D. L., and Wang, X. (2002). Temporal coherence sensitivity in auditory cortex. J. Neurophysiol. 88, 2684–2699.
Barbour, D. L., and Wang, X. (2003). Auditory cortical responses elicited in awake primates by random spectrum stimuli. J. Neurosci. 23, 7194–7206.
Bar-Yosef, O., Rotman, Y., and Nelken, I. (2002). Responses of neurons in cat primary auditory cortex to bird chirps, effects of temporal and spectral context. J. Neurosci. 22, 8619–8632.
Bieser, A., and Muller-Preuss, P. (1996). Auditory responsive cortex in the squirrel monkey, neural responses to amplitude-modulated sounds. Exp. Brain Res. 108, 273–284.
Bizley, J. K., Walker, K. M., Silverman, B. W., King, A. J., and Schnupp, J. W. (2009). Interdependent encoding of pitch, timbre, and spatial location in auditory cortex. J. Neurosci. 29, 2064–2075.
Bleeck, S., Patterson, R. D., and Winter, I. M. (2003). Using genetic algorithms to find the most effective stimulus for sensory neurons. J. Neurosci. Methods 125, 73–82.
Bradbury, J. W., and Vehrencamp, S. L. (1998). The Principles of Animal Communication. Sunderland, MA: Sinauer Associates.
Brosch, M., and Schreiner, C. E. (2000). Sequence sensitivity of neurons in cat primary auditory cortex. Cereb. Cortex 10, 1155–1167.
Brosch, M., Schulz, A., and Scheich, H. (1999). Processing of sound sequences in macaque auditory cortex: response enhancement. J. Neurophysiol. 82, 1542–1559.
Cadieu, C., Kouh, M., Pasupathy, A., Connor, C. E., Riesenhuber, M., and Poggio, T. (2007). A model of V4 shape selectivity and invariance. J. Neurophysiol. 98, 1733–1750.
Calhoun, B. M., and Schreiner, C. E. (1998). Spectral envelope coding in cat primary auditory cortex: linear and non-linear effects of stimulus characteristics. Eur. J. Neurosci. 10, 926–940.
Creutzfeldt, O., Hellweg, F. C., and Schreiner, C. (1980). Thalamocortical transformation of responses to complex auditory stimuli. Exp. Brain Res. 39, 87–104.
deCharms, R. C., Blake, D. T., and Merzenich, M. M. (1998). Optimizing sound features for cortical neurons. Science 280, 1439–1443.
DiMattina, C., and Wang, X. (2006). Virtual vocalization stimuli for investigating neural representations of species-specific vocalizations. J. Neurophysiol. 95, 1244–1262.
Efron, B., and Tibshirani, R. J. (1993). An Introduction to the Bootstrap. New York, NY: Chapman & Hall.
Eggermont, J. J. (1994). Temporal modulation transfer functions for AM and FM stimuli in cat auditory cortex. Effects of carrier type, modulating waveform and intensity. Hear. Res. 74, 51–66.
Finlayson, P. G. (1999). Post-stimulatory suppression, facilitation and tuning for delays shape responses of inferior colliculus neurons to sequential pure tones. Hear. Res. 131, 177–194.
Firzlaff, U., Schuchmann, M., Grunwald, J. E., Schuller, G., and Wiegrebe, L. (2007). Object-oriented echo perception and cortical representation in echolocating bats. PLoS Biol. 5, e100. doi: 10.1371/journal.pbio.0050100.
Firzlaff, U., and Schuller, G. (2007). Cortical responses to object size-dependent spectral interference patterns in echolocating bats. Eur. J. Neurosci. 26, 2747–2755.
Fishbach, A., Nelken, I., and Yeshurun, Y. (2001). Auditory edge detection: a neural model for physiological and psychoacoustical responses to amplitude transients. J. Neurophysiol. 85, 2303–2323.
Fitzpatrick, D. C., Kanwal, J. S., Butman, J. A., and Suga, N. (1993). Combination-sensitive neurons in the primary auditory cortex of the mustached bat. J. Neurosci. 13, 931–940.
Fukushima, K., Miyake, S., and Ito, T. (1983). Neocognitron: a self-organizing network model for a mechanism of visual pattern recognition. IEEE Trans. Syst. Man Cybern. 13, 826–834.
Gaese, B. H., and Ostwald, J. (1995). Temporal coding of amplitude and frequency modulation in the rat auditory cortex. Eur. J. Neurosci. 7, 438–450.
Gawne, T. J., Richmond, B. J., and Optican, L. M. (1991). Interactive effects among several stimulus parameters on the responses of striate cortical complex cells. J. Neurophysiol. 66, 379–389.
Geman, S. (2006). Invariance and selectivity in the ventral visual pathway. J. Physiol. (Paris) 100, 212–224.
Gourevitch, B., and Eggermont, J. J. (2007). Spatial representation of neural responses to natural and altered conspecific vocalizations in cat auditory cortex. J. Neurophysiol. 97, 144–158.
Gourevitch, B., Norena, A., Shaw, G., and Eggermont, J. J. (2009). Spectrotemporal receptive fields in anesthetized cat primary auditory cortex are context dependent. Cereb. Cortex 19, 1448–1461.
Grossberg, S. (1973). Contour enhancement, short term memory, and constancies in reverberating neural networks. Stud. Appl. Math. 52, 213–257.
Heil, P., and Irvine, D. R. (1998). Functional specialization in auditory cortex: responses to frequency-modulated stimuli in the cat’s posterior auditory field. J. Neurophysiol. 79, 3041–3059.
Hromadka, T., Deweese, M. R., and Zador, A. M. (2008). Sparse representation of sounds in the unanesthetized auditory cortex. PLoS Biol. 6, e16. doi: 10.1371/journal.pbio.0060016.
Hubel, D. H., and Wiesel, T. N. (1962). Receptive fields, binocular interaction and functional architecture in the cat’s visual cortex. J. Physiol. 160, 106–154.
Ison, M. J., and Quiroga, R. Q. (2008). Selectivity and invariance for visual object perception. Front. Biosci. 13, 4889–4903.
Kadia, S. C., and Wang, X. (2003). Spectral integration in A1 of awake primates: neurons with single- and multipeaked tuning characteristics. J. Neurophysiol. 89, 1603–1622.
Kaur, S., Lazar, R., and Metherate, R. (2004). Intracortical pathways determine breadth of subthreshold frequency receptive fields in primary auditory cortex. J. Neurophysiol. 91, 2551–2567.
Kaur, S., Rose, H. J., Lazar, R., Liang, K., and Metherate, R. (2005). Spectral integration in primary auditory cortex: laminar processing of afferent input, in vivo and in vitro. Neuroscience 134, 1033–1045.
Klein, D. J., Simon, J. Z., Depireux, D. A., and Shamma, S. A. (2006). Stimulus-invariant processing and spectrotemporal reverse correlation in primary auditory cortex. J. Comput. Neurosci. 20, 111–136.
Kouh, M., and Poggio, T. (2008). A canonical neural circuit for cortical nonlinear operations. Neural Comput. 20, 1427–1451.
Kowalski, N., Depireux, D. A., and Shamma, S. A. (1996). Analysis of dynamic spectra in ferret primary auditory cortex. II. Prediction of unit responses to arbitrary dynamic spectra. J. Neurophysiol. 76, 3524–3534.
Lu, T., Liang, L., and Wang, X. (2001). Neural representations of temporally asymmetric stimuli in the auditory cortex of awake primates. J. Neurophysiol. 85, 2364–2380.
Machens, C. K., Wehr, M. S., and Zador, A. M. (2004). Linearity of cortical receptive fields measured with natural sounds. J. Neurosci. 24, 1089–1100.
McKenna, T. M., Weinberger, N. M., and Diamond, D. M. (1989). Responses of single auditory cortical neurons to tone sequences. Brain Res. 481, 142–153.
Mendelson, J. R., Schreiner, C. E., Sutter, M. L., and Grasse, K. L. (1993). Functional topography of cat primary auditory cortex: responses to frequency-modulated sweeps. Exp. Brain Res. 94, 65–87.
Misawa, H., and Suga, N. (2001). Multiple combination-sensitive neurons in the auditory cortex of the mustached bat. Hear. Res. 151, 15–29.
Mittmann, D. H., and Wenstrup, J. J. (1995). Combination-sensitive neurons in the inferior colliculus. Hear. Res. 90, 185–191.
Morton, E. S. (1977). On the occurrence and significance of motivation-structural rules in some bird and mammal sounds. Am. Nat. 111, 855–869.
Nelder, J.A. and Mead, R. (1965). A simplex method for function minimization. Comput. J. 7, 308–313.
Nelken, I., Prut, Y., Vaadia, E., and Abeles, M. (1994a). In search of the best stimulus: an optimization procedure for finding efficient stimuli in the cat auditory cortex. Hear. Res. 72, 237–253.
Nelken, I., Prut, Y., Vaddia, E., and Abeles, M. (1994b). Population responses to multifrequency sounds in the cat auditory cortex: four-tone complexes. Hear. Res. 72, 223–236.
Nelken, I., Rotman, Y., and Bar Yosef, O. (1999). Responses of auditory-cortex neurons to structural features of natural sounds. Nature 397, 154–157.
O’Connor, K. N., Petkov, C. I., and Sutter, M. L. (2005). Adaptive stimulus optimization for auditory cortical neurons. J. Neurophysiol. 94, 4051–4067.
O’Neill, W. E., and Suga, N. (1982). Encoding of target range and its representation in the auditory cortex of the mustached bat. J. Neurosci. 2, 17–31.
Olsen, J. F., and Suga, N. (1991). Combination-sensitive neurons in the medial geniculate body of the mustached bat: encoding of target range information. J. Neurophysiol. 65, 1275–1296.
Oonishi, S., and Katsuki, Y. (1965). Functional organization of and integrative mechanism on the auditory cortex of the cat. Jpn. J. Physol. 15.
Pandya, P. K., Rathbun, D. L., Moucha, R., Engineer, N. D., and Kilgard, M. P. (2008). Spectral and temporal processing in rat posterior auditory cortex. Cereb. Cortex 18, 301–314.
Paschal, W. G., and Wong, D. (1994). Frequency organization of delay-sensitive neurons in the auditory cortex of the FM bat, Myotis lucifugus. J. Neurophysiol. 72, 366–379.
Petkov, C. I., O’Connor, K. N., and Sutter, M. L. (2007). Encoding of illusory continuity in primary auditory cortex. Neuron 54, 153–165.
Pienkowski, M., Shaw, G., and Eggermont, J. J. (2009). Wiener-Volterra characterization of neurons in primary auditory cortex using poisson-distributed impulse train inputs. J. Neurophysiol. 101, 3031–3041.
Portfors, C. V., and Felix, R. A. II. (2005). Spectral integration in the inferior colliculus of the CBA/CaJ mouse. Neuroscience 136, 1159–1170.
Press, W. H. (2000). Numerical Recipes in C the Art of Scientific Computing. Cambridge, England/New York/Los Alamos, CA: Cambridge University Press [distributed by] Los Alamos National Laboratory.
Qin, L., Sakai, M., Chimoto, S., and Sato, Y. (2004). Spectral-edge sensitivity of primary auditory cortex neurons in alert cats. Brain Res. 1014, 1–13.
Qiu, A., Schreiner, C. E., and Escabi, M. A. (2003). Gabor analysis of auditory midbrain receptive fields: spectrotemporal and binaural composition. J. Neurophysiol. 90, 456–476.
Rauschecker, J. P., and Tian, B. (2004). Processing of band-passed noise in the lateral auditory belt cortex of the rhesus monkey. J. Neurophysiol. 91, 2578–2589.
Recanzone, G. H. (2000). Response profiles of auditory cortical neurons to tones and noise in behaving macaque monkeys. Hear. Res. 150, 104–118.
Riesenhuber, M., and Poggio, T. (1999). Hierarchical models of object recognition in cortex. Nat. Neurosci. 2, 1019–1025.
Rotman, Y., Bar-Yosef, O., and Nelken, I. (2001). Relating cluster and population responses to natural sounds and tonal stimuli in cat primary auditory cortex. Hear. Res. 152, 110–127.
Sadagopan, S., and Wang, X. (2009). Nonlinear spectrotemporal interactions underlying selectivity for complex sounds in auditory cortex. J. Neurosci. 29, 11192–11202.
Schebesch, G., Lingner, A., Firzlaff, U., Wiegrebe, L., and Grothe, B. (2010). Perception and neural representation of size-variant human vowels in the Mongolian gerbil (Meriones unguiculatus). Hear. Res. 261, 1–8.
Schnupp, J. W., Hall, T. M., Kokelaar, R. F., and Ahmed, B. (2006). Plasticity of temporal pattern codes for vocalization stimuli in primary auditory cortex. J. Neurosci. 26, 4785–4795.
Schreiner, C. E., and Calhoun, B. M. (1994). Spectral envelope coding in cat primary auditory cortex: properties of ripple transfer functions. Aud. Neurosci. 1, 39–61.
Schreiner, C. E., and Urbas, J. V. (1986). Representation of amplitude modulation in the auditory cortex of the cat. I. The anterior auditory field (AAF). Hear. Res. 21, 227–241.
Schuller, G., O’Neill, W. E., and Radtke-Schuller, S. (1991). Facilitation and delay sensitivity of auditory cortex neurons in CF–FM bats, Rhinolophus rouxi and Pteronotus p. parnellii. Eur. J. Neurosci. 3, 1165-1181.
Schulze, H., and G. Langner. (1999). Auditory cortical responses to amplitude modulations with spectra above frequency receptive fields: evidence for wide spectral integration. J. Comp. Physiol. A 185, 493–508.
Schwarz, D. W., and Tomlinson, R. W. (1990). Spectral response patterns of auditory cortex neurons to harmonic complex tones in alert monkey (Macaca mulatta). J. Neurophysiol. 64, 282–298.
Shamma, S. A., and Versnel, H. (1995). Ripple analysis in ferret primary auditory cortex. II. Prediction of unit responses to arbitrary spectral profiles.. Aud. Neurosci. 1, 255–270.
Shamma, S. A., Versnel, H., and Kowalski, N. (1995). Ripple analysis in ferret primary auditory cortex. I. Response characteristics of single units to sinusoidally rippled spectra. Aud. Neurosci. 1, 233–254.
Suga, N., and Manabe, T. (1982). Neural basis of amplitude-spectrum representation in auditory cortex of the mustached bat. J. Neurophysiol. 47, 225–255.
Suga, N., O’Neill, W. E., and Manabe, T. (1978). Cortical neurons sensitive to combinations of information-bearing elements of biosonar signals in the mustache bat. Science 200, 778–781.
Suga, N., O’Neill, W. E., and Manabe, T. (1979). Harmonic-sensitive neurons in the auditory cortex of the mustache bat. Science 203, 270–274.
Suga, N., and Tsuzuki, K. (1985). Inhibition and level-tolerant frequency tuning in the auditory cortex of the mustached bat. J. Neurophysiol. 53, 1109–1145.
Supin, A., Popov, V. V., Milekhina, O. N., and Tarakanov, M. B. (1999). Ripple depth and density resolution of rippled noise. J. Acoust. Soc. Am. 106, 2800–2804.
Supin, A. Y., Popov, V. V., Milekhina, O. N., and Tarakanov, M. B. (2003). Rippled-spectrum resolution dependence on level. Hear. Res. 185, 1–12.
Sutter, M. L., and Schreiner, C. E. (1991). Physiology and topography of neurons with multipeaked tuning curves in cat primary auditory cortex. J. Neurophysiol. 65, 1207–1226.
Sutter, M. L., Schreiner, C. E., McLean, M., O’Connor, K. N., and Loftus, W. C. (1999). Organization of inhibitory frequency receptive fields in cat primary auditory cortex. J. Neurophysiol. 82, 2358–2371.
Theunissen, F. E., Sen, K., and Doupe, A. J. (2000). Spectral-temporal receptive fields of nonlinear auditory neurons obtained using natural sounds. J. Neurosci. 20, 2315–2331.
Tsuzuki, K., and Suga, N. (1988). Combination-sensitive neurons in the ventroanterior area of the auditory cortex of the mustached bat. J. Neurophysiol. 60, 1908–1923.
Wang, X., and Kadia, S. C. (2001). Differential representation of species-specific primate vocalizations in the auditory cortices of marmoset and cat. J. Neurophysiol. 86, 2616–2620.
Wang, X., Merzenich, M. M., Beitel, R., and Schreiner, C. E. (1995). Representation of a species-specific vocalization in the primary auditory cortex of the common marmoset: temporal and spectral characteristics. J. Neurophysiol. 74, 2685–2706.
Winter, I. M., and Palmer, A. R. (1995). Level dependence of cochlear nucleus onset unit responses and facilitation by second tones or broadband noise. J. Neurophysiol. 73, 141–159.
Winter, P., and Funkenstein, H. H. (1973). The effect of species-specific vocalization on the discharge of auditory cortical cells in the awake squirrel monkey (Saimiri sciureus). Exp. Brain Res. 18, 489–504.
Keywords: auditory cortex, spectral interactions, ripple, spectral Gabor
Citation: O’Connor KN, Yin P, Petkov CI and Sutter ML (2010) Complex spectral interactions encoded by auditory cortical neurons: relationship between bandwidth and pattern. Front. Syst. Neurosci. 4:145. doi: 10.3389/fnsys.2010.00145
Received: 26 July 2010;
Accepted: 09
September 2010;
Published online: 05 November 2010.
Edited by:
Federico Bermudez-Rattoni, Universidad Nacional Autónoma de México, MexicoReviewed by:
Valentin Dragoi, University of Texas Medical School at Houston, USA;Victor Hugo de Lafuente Flores, University of Washington School of Medicine, USA
Copyright: © 2010 O’Connor, Yin, Petkov and Sutter. This is an open-access article subject to an exclusive license agreement between the authors and the Frontiers Research Foundation, which permits unrestricted use, distribution, and reproduction in any medium, provided the original authors and source are credited.
*Correspondence: Kevin N. O’Connor, Center for Neuroscience, 1544 Newton Ct., Davis, CA 95616, USA. e-mail: knoconnor@ucdavis.edu