Neural underpinnings of distortions in the experience of time across senses
- 1 Research Service, Veterans Affairs San Diego Healthcare System, San Diego, CA, USA
- 2 Department of Radiology, University of California San Diego, San Diego, CA, USA
Auditory signals (A) are perceived as lasting longer than visual signals (V) of the same physical duration when they are compared together. Despite considerable debate about how this illusion arises psychologically, the neural underpinnings have not been studied. We used functional magnetic resonance imaging (fMRI) to investigate the neural bases of audiovisual temporal distortions and more generally, intersensory timing. Adults underwent fMRI while judging the relative duration of successively presented standard interval–comparison interval (CI) pairs, which were unimodal (A–A, V–V) or crossmodal (V–A, A–V). Mechanisms of time dilation and compression were identified by comparing the two crossmodal pairs. Mechanisms of intersensory timing were identified by comparing the unimodal and crossmodal conditions. The behavioral results showed that auditory CIs were perceived as lasting longer than visual CIs. There were three novel fMRI results. First, time dilation and compression were distinguished by differential activation of higher-sensory areas (superior temporal, posterior insula, middle occipital), which typically showed stronger effective connectivity when time was dilated (V–A). Second, when time was compressed (A–V) activation was greater in frontal cognitive-control centers, which guide decision making. These areas did not exhibit effective connectivity. Third, intrasensory timing was distinguished from intersensory timing partly by decreased striatal and increased superior parietal activation. These regions showed stronger connectivity with visual, memory, and cognitive-control centers during intersensory timing. Altogether, the results indicate that time dilation and compression arise from the connectivity strength of higher-sensory systems with other areas. Conversely, more extensive network interactions are needed with core timing (striatum) and attention (superior parietal) centers to integrate time codes for intersensory signals.
Introduction
Humans possess a remarkable ability to estimate the passage of time, which is vital for behavior. Yet the experience of time is not isomorphic to physical time and depends on many factors including properties of stimuli, past experiences, and behavioral contexts. For example, emotionally charged, larger magnitude, and more intense stimuli are known to expand estimates of time whereas events that are repeated, higher probability, and non-salient tend to compress perceived duration (Tse et al., 2004; Droit-Volet and Meck, 2007; van Wassenhove et al., 2008; Eagleman and Pariyadath, 2009; Matthews et al., 2011). Decades of psychophysical studies have debated the mechanisms of temporal distortions. By pacemaker-counter models (Penney et al., 2000; Ulrich et al., 2006), attention is a central factor that causes time to speed up or slow down by closing or opening a switch, which allows pulses generated from a clock during event timing to be accumulated and counted. Arousal is another factor that ostensibly increases the speed of the pacemaker. Indeed, the level of attention devoted to timing influences perceived duration (Casini and Macar, 1997; Coull et al., 2004) as does heightened physiological arousal induced by emotionally negative sounds (Mella et al., 2011). However, a more complete understanding of how temporal distortions arise has been hampered by scant investigations into the underlying neural mechanisms.
The present study used functional magnetic resonance imaging (fMRI) to investigate the neural underpinnings of the illusion that auditory (A) signals are perceived as lasting longer than visual (V) signals of the same physical duration when they are compared together (Wearden et al., 1998; Gamache and Grondin, 2010). This temporal distortion is of considerable interest because an understanding of its mechanisms may help elucidate how synchrony is maintained across senses to form coherent representations of multisensory events. The modality effect on perceived duration is often attributed to a pacemaker–accumulator “clock” system that runs faster for auditory than visual stimuli, possibly due to an attentional switch that allows pulses to accumulate faster for auditory information (Penney et al., 2000; Wearden et al., 2006). Audiovisual distortions are classically studied using the temporal bisection procedure. However, the present study employed a comparison procedure wherein a standard interval (SI) and a comparison interval (CI) were successively presented, and participants judged whether the CI was longer or shorter in duration than the SI (Ulrich et al., 2006). SI–CI pairs were either unimodal (A–A, V–V) or crossmodal (V–A, A–V). Using this method, V–A pairs are perceived as lasting longer than A–V pairs, which is due to the longer interpulse time for visual than auditory CIs (Ulrich et al., 2006).
Our primary aim was to identify neural systems underlying time dilation and compression by comparing activation patterns in the crossmodal conditions (V–A versus A–V) where the amount of visual and auditory stimulation was the same. Our hypotheses were motivated by the striatal beat frequency (SBF) model (Matell and Meck, 2004), which suggests that audiovisual differences in timing could arise from cortical oscillatory patterns in the cortex or from the striatum. Specifically, the time code for signal duration is thought to arise from the firing of cortical neurons that have different oscillation rates, which should produce distinct temporal and spatial signatures for auditory and visual signals. On the other hand, the striatum serves as a core timer by detecting and integrating cortical oscillatory states over time. Thus, activation in auditory and visual centers should differ between the crossmodal conditions if modality effects are related to different temporal signatures in sensory and association regions of the cortex. Alternatively, striatal activation should differ between the crossmodal conditions if modality effects are related to differences in the rate of detecting and integrating auditory and visual oscillatory states. We also were interested in whether interactions of the brain with key regions that modulated modality effects were stronger for the time dilation than the compression condition (i.e., effective connectivity). If time dilation is due to an attentional mechanism that favors auditory signals (Penney et al., 2000; Wearden et al., 2006), connectivity might be stronger for V–A than A–V comparisons.
A secondary aim was to investigate neural mechanisms that distinguish intrasensory from intersensory timing by comparing the unimodal and crossmodal conditions in regions that did not exhibit time dilation or compression effects. Current knowledge of the neural underpinnings of temporal processing comes solely from studies of intrasensory timing. Intersensory timing presumably differs in that attention must be switched between senses and time codes must be integrated across senses. Although not explicitly addressed by the SBF model, the detection and integration of oscillatory states by the striatum might be enhanced when timing signals within the same modality because they share similar spatial signatures, which facilitates temporal integration, thereby producing a more robust neuronal response relative to crossmodal timing. If the striatum differentially modulates intra- and intersensory timing, we also speculated that the strength of striatal interactions with the cortex would differ for unimodal and crossmodal timing.
Materials and methods
Participants
Twenty healthy adults participated in the study (8 female and 12 male; mean age = 24.4 years, range: 19–35 years, SD = 4.5; mean education = 15.5 years, range: 13–20 years, SD = 1.6). Participants were excluded if they had a history of neurologic disturbance (e.g., seizures, head injury), learning disability, major psychiatric disturbance, or substance abuse. All participants gave their written informed consent according to guidelines of the Human Research Protections Program at the University of California San Diego (UCSD).
fMRI Task
Participants performed a time perception task while undergoing fMRI scanning. The task involved presentation of filled-auditory (1000 Hz pure tones) and visual (blue ellipse) stimuli. Tone stimuli were delivered binaurally through a headphone that together with earplugs attenuated background scanner noise by about 40 db. Visual stimuli were viewed through a NordicNeuroLab goggle system. Participants made a two-choice key-press response on a button box using the index or middle finger of their right hand.
Figure 1A shows the experimental design and trial events. Pairs of auditory (A) and/or visual (V) stimuli were successively presented. In two unimodal conditions, the SI and the CI were of the same modality (A–A, V–V) and in two crossmodal conditions they were different (A–V, V–A). Throughout the experiment, the subject maintained fixation on a white cross at the center of the display. Prior to trial onset, a warning signal (i.e., flashing yellow cross and mixed 700-Hz tone) appeared for 350 ms followed by a 500-ms delay. A trial began with the presentation of the SI, followed by a 1.5-s delay, and then the CI. The participant indicated if the CI was shorter or longer than the SI by pressing a key with the right index or middle finger, respectively. Four SIs (1467, 1540, 1620, and 1710 ms) were used to increase the demands of encoding an interval on each trial (Figure 1B). For each SI, there were three shorter and three longer CIs that differed from the SI by successive increments of ±7%. Accuracy and reaction time (RT; measured from CI offset to the key press) were recorded.
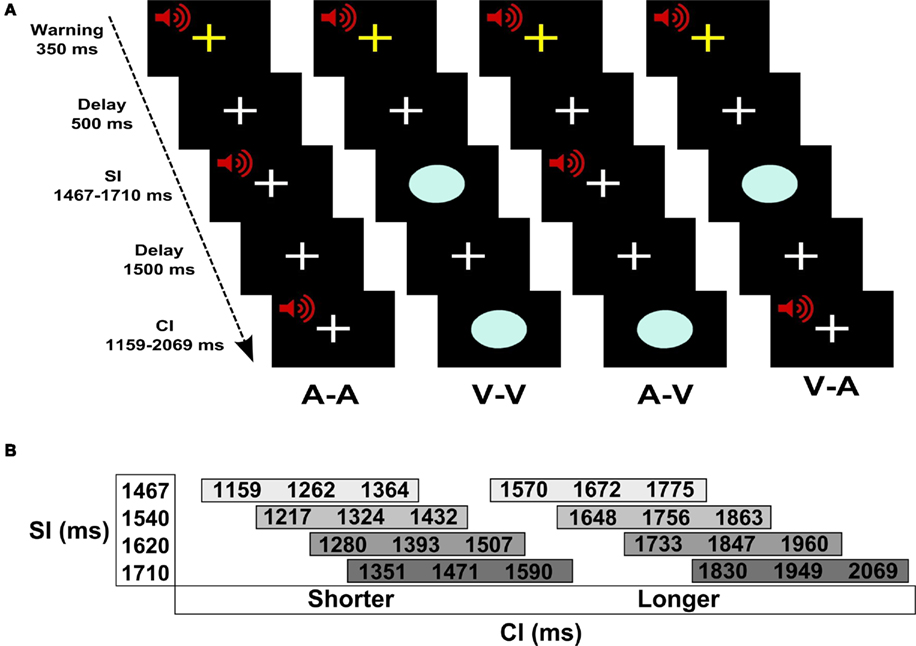
Figure 1. Time perception task. (A) Trial of events for each of the four conditions. Pairs of auditory (A) and/or visual (V) stimuli were successively presented. The standard (SI) and the comparison (CI) intervals were of the same modality in the unimodal conditions (A–A, V–V) and were different modalities in the crossmodal conditions (A–V, V–A). Prior to trial onset, a warning signal (flashing yellow cross and mixed 700-Hz tone) appeared for 350 ms followed by a 500-ms delay. A trial began with the presentation of the SI, followed by a 1.5-s delay, and then the CI. The participant indicated if the CI was shorter or longer than the SI by pressing a key with the right index or middle finger, respectively. (B) SI and CI durations. There were four different SIs. Each SI was paired with three shorter and three longer CIs that differed from the SI by successive increments of ±7%.
There were 24 trials per condition (i.e., A–A, V–V, A–V, V–A). Within each of the conditions there were four trials per CI (i.e., 7, 14, and 21% shorter or longer than the SI). These trials were equally divided among the four different SI–CI combinations (Figure 1B). The order of the conditions was randomized across four runs, each of which contained 24 trials. At the end of the CI, there was a 3-s “filler” epoch (i.e., fixation) wherein subjects made their response. At the end of this response window, the inter-trial interval was jittered between 3 and 7 s to allow for the best sampling of the hemodynamic response and establishment of a baseline resting state in the model (i.e., fixation plus ambient scanner noise). Six additional filler images were added to the beginning and the end of each run to respectively allow for T1 equilibration and the delayed hemodynamic response of the final trial. Each run consisted of 180 images acquired over 6 min.
MRI Methods
Image acquisition
Event-related fMRI was conducted at the UCSD Center for FMRI using a GE 3-T Excite MRI system equipped with an 8-channel head coil. Foam padding was used to limit head motion within the coil. Prior to functional imaging, high-resolution T1-weighted anatomic images were collected for anatomic localization and co-registration (TE 3.0 ms, TR 7.8 ms, 12° flip angle, NEX 1, 1-mm axial slice thickness, FOV 25 cm, 256 × 256 matrix). Echo-planar images were acquired using a single-shot, blipped, gradient-echo, echo-planar pulse sequence (TE 30 ms, TR 2.0 s, 90° flip angle, FOV 24 cm, 64 × 64 matrix, NEX 1, interleaved slice acquisition). Each functional imaging volume included 37 contiguous, axial 4-mm slices (3.75-mm × 3.75-mm × 4-mm voxel size) to provide coverage of the entire brain.
Image analysis
Functional images were generated using Analysis of Functional NeuroImages (AFNI) software. Time series images were spatially registered in three-dimensional space and corrected for time-slice acquisition differences. The time series for each participant was deconvolved using trial onset (i.e., presentation of the SI) separately for each of the four conditions (A–A, V–V, A–V, V–A). This analysis produces hemodynamic response functions (HRFs) of the fMRI signal on a voxel-wise basis. The HRFs are estimates of the hemodynamic response for each condition relative to the baseline state (i.e., filler images), and are generated without making a priori assumptions about the shape, delay, or magnitude of the HRF. The deconvolution was modeled for 8 time points (i.e., 16 s). Six head-motion parameters were included as covariates of no interest. Area under the curve (AUC) was calculated using the volumes that captured peak activation during the SI (volumes 2 and 3 beginning at 4.0 and 6.0 s post-trial onset) and the CI and response (volumes 4 and 5 beginning at 8.0 and 10.0 s post-trial onset). AUC maps were then interpolated to volumes with 1-mm3 voxels, co-registered, converted to Talairach coordinate-space, and blurred using a 6-mm Gaussian full-width half maximum filter.
Repeated-measures analyses of variance (ANOVAs) were performed on a voxel-wise basis to generate statistical parametric maps that identified voxels that showed main effects of timing condition (unimodal, crossmodal), CI modality (auditory, visual), and the interaction. Voxel-wise thresholds were derived from 3000 Monte Carlo simulations (AFNI AlphaSim), which computed the voxel-probability and minimum cluster-size threshold needed to obtain a 0.05 familywise alpha. Because spatial thresholds are biased against smaller activation clusters of a priori interest (i.e., basal ganglia), statistical thresholds were derived separately for basal ganglia and cortical volumes (Worsley et al., 1996). This was accomplished by creating a basal ganglia mask (i.e., putamen, globus pallidus, caudate) using the Talairach Daemon dataset; the mask was then expanded to include any voxels within a 2-mm radius. The cortical mask included all other regions of the brain. Each mask was used in the Monte Carlo simulations to determine the appropriate combination of individual voxel-probability and minimum cluster-size threshold. For the basal ganglia volume, we used a voxel-wise threshold of p < 0.006 and a minimum cluster size of 0.338 ml. For the cortical volume, we used a voxel-wise threshold of p < 0.004 and a minimum cluster size of 0.675 ml.
The objectives of our study were to investigate regional differences associated with (1) signal modality (A–A versus V–V), (2) timing condition (unimodal versus crossmodal), and (3) the interaction of modality × timing condition. Planned comparisons of significant interactions focused on the contrast between the two crossmodal pairs (A–V versus V–A) since this directly tests for regional activation associated with the time dilation effect while controlling for sensory processing demands. To accomplish these objectives, a functional region of interest (fROI) analysis was conducted to directly evaluate regional differences associated with each of these effects. The fROI map was generated by conjoining activated regions associated with the main effect and interaction tests that were identified in the above voxel-wise analyses. As some fROI were quite large, we separated them into smaller regions along minimum contour lines of the voxel-wise map using a watershed algorithm. This algorithm first uses AFNI 3dExtrema to find a set of local maxima separated by at least 20 mm and then creates boundaries for clusters containing these maxima along the minimum value contour lines (Cox, 1996). The watershed algorithm was applied to the conjoined fROI map using the normalized maximum intensity value from each voxel. The results from F tests conducted on the fROI were the focus of the study.
Effective connectivity analyses
We also asked if connectivity of key regions with the entire brain were modulated by the timing condition (unimodal versus crossmodal) or by dilation/compression effects on perceived duration (V–A versus A–V). This was achieved by conducting voxel-based tests of psychophysiological interactions (PPI; Friston et al., 1997) for key regions, which were identified by the above fROI analyses. For PPI analyses pertaining to timing condition, key regions were selected that (1) exhibited differences between the unimodal and crossmodal conditions, (2) did not show a timing condition × CI modality interaction, and (3) have been implicated in temporal processing. For PPI analyses pertaining to time dilation/compression, key regions were selected that exhibited a timing condition × CI modality interaction that was related to differences in activation between the two crossmodal pairs (V–A versus A–V). Voxels in these key regions were the seed ROI and were selected for each subject based on the conjunctive maps generated for the fROI analyses. Seeds were constructed by drawing a 5-mm radius sphere that was centered close to the peak activation within a fROI. In one PPI analysis, the experimental variable was the timing condition (unimodal versus crossmodal). In the other PPI analysis, the experimental variable was the time dilation/compression effect (V–A versus A–V). Multiplication of the deconvolved time series for the seed areas with each experimental variable formed the interaction term (i.e., PPI regressor), which tested whether connectivity of a key region with the whole brain was modulated by the experimental variable. A p < 0.006 voxel-wise threshold and a 0.338-ml minimum cluster size was the criterion for significance.
Results
Behavioral Results
The analyses collapsed across SI duration. Hence, CIs that were ±7, 14, and 21% increments of the SI duration were also averaged. The main dependent measure was accuracy, which was converted to the percent longer responses for each CI. A repeated-measures ANOVA tested the main effect of CI modality (auditory, visual), timing condition (unimodal, crossmodal), CI duration (±7, 14, 21%), and the interactions. The Huynh–Feldt correction was applied to multiple DOF effects to adjust for violations of sphericity. The main results are graphed in Figure 2.
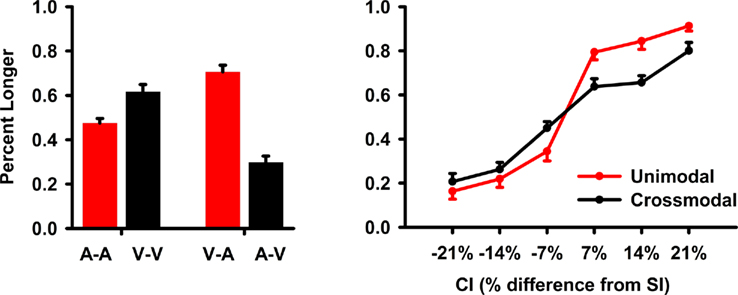
Figure 2. Task performance during fMRI scanning. Accuracy data were converted to the mean (standard error bars) percent longer and then averaged across the standard interval (SI) conditions and their respective comparison intervals (CIs). The left graph shows the mean percent longer responses for each unimodal (A–A, V–V) and crossmodal (V–A, A–V) condition. The right graph plots the mean percent longer responses for the unimodal and crossmodal conditions as a function of the CI duration. On the x axis, ±7, 14, and 21 designate CIs that were 7, 14, and 21% shorter (negative values) or longer (positive values) than the SI.
All first-order interactions were significant [CI modality × timing condition: F(1,19) = 96.3, p < 0.0001, η2 = 0.84; timing condition × CI duration: F(4.4, 83) = 8.3, p < 0.0001, η2 = 0.30; CI modality × CI duration: F(5,95) = 2.8, p < 0.025, η2 = 0.13]. Planned comparisons of the CI modality × timing condition interaction (Figure 2, left graph) showed that in the unimodal condition, visual CIs were perceived as lasting longer than auditory CIs [V–V > A–A; F(1,19) = 21.0, p < 0.0001, η2 = 0.53]. Though no differences were expected between A–A and V–V pairs, this was found previously (Ulrich et al., 2006) and relates to the greater variability in timing visual signals (Merchant et al., 2008; Grondin and McAuley, 2009). In contrast, auditory CIs were perceived as lasting longer than visual CIs in the crossmodal conditions [V–A > A–V; F(1,19) = 70.6, p < 0.0001, η2 = 0.79]. Pairwise comparisons between the unimodal and crossmodal conditions indicated that perceived duration was dilated for intersensory timing of auditory CIs [A–A < V–A; F(1,19) = 47.8, p < 0.0001, η2 = 0.72; V–V < V–A; F(1,19) = 6.7, p < 0.02, η2 = 0.26] and was compressed for intersensory timing of visual CIs [A–A > A–V; F(1,19) = 22.9, p < 0.0001, η2 = 0.55; V–V > A–V; F(1,19) = 79.9, p < 0.0001, η2 = 0.81]. The timing condition × CI duration interaction showed that differences between the two timing conditions grew as CI duration increased (Figure 2, right graph). The CI modality × CI duration interaction showed that CI modality differences also grew as CI duration increased. The second-order interaction was not significant [F(3.9,75) = 1.8, p = 0.14].
Secondary analyses of the RT data showed a trend for a CI modality × timing condition interaction [F(1,19) = 3.8, p = 0.067, η2 = 0.17]. Planned comparisons showed the interaction was due to faster RTs for V–A (mean = 776.3 ms, SE = 50.5) than A–V pairs (mean = 899.9 ms, SE = 51.0) [t(1,19) = 3.1, p < 0.01], but not for A–A (mean = 861.7 ms, SE = 50.2) than V–V pairs (mean = 874.1 ms; SE = 52.1).
MRI Results
Functional ROI results
The conjoined fMRI activation masks in Figures 3 and 4 display 25 regions that exhibited effects of CI modality, timing condition, and/or an interaction. Table 1 provides the details of these activation foci. For each fROI, the table also summarizes the results from statistical analyses that tested for the effects of signal modality (A–A versus V–V), timing condition (unimodal versus crossmodal), and the interaction of modality × timing condition.
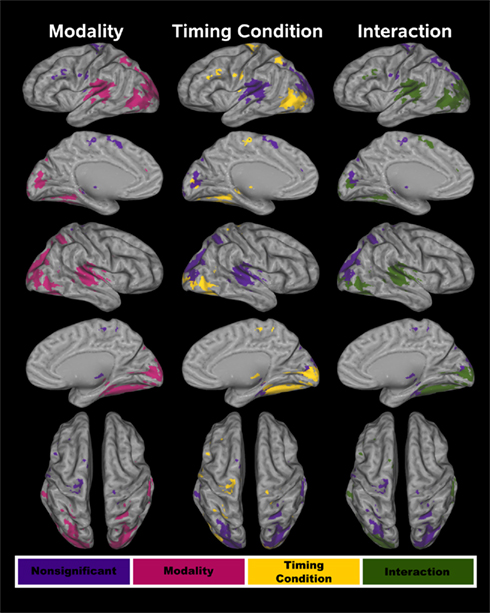
Figure 3. Cortical functional ROI (fROI). Twenty-one cortical fROI were identified by conjoining activation maps from the voxel-wise analyses. Tests of modality, timing condition, and the interaction were conducted on these fROI. The fROI are color coded according to whether activation was affected by each of these factors. In all three columns, purple denotes no effect of a particular factor on activation. For the test of modality (left column), red designates a significant difference between the A–A and V–V conditions. For the test of timing condition (middle column), yellow signifies a significant difference between the unimodal and the crossmodal conditions. In the right column, green signifies a significant CI modality × timing condition interaction.
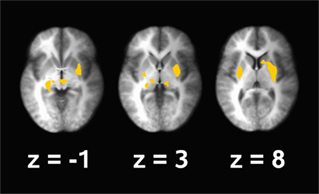
Figure 4. Subcortical functional ROI (fROI). Four subcortical fROI were identified by conjoining the activation maps from the voxel-wise analyses. In all of the fROI, activation was greater in the unimodal than the crossmodal timing condition. No other effects were significant. z coordinates are the superior (+)/inferior (−) distance in millimeter from the anterior commissure.
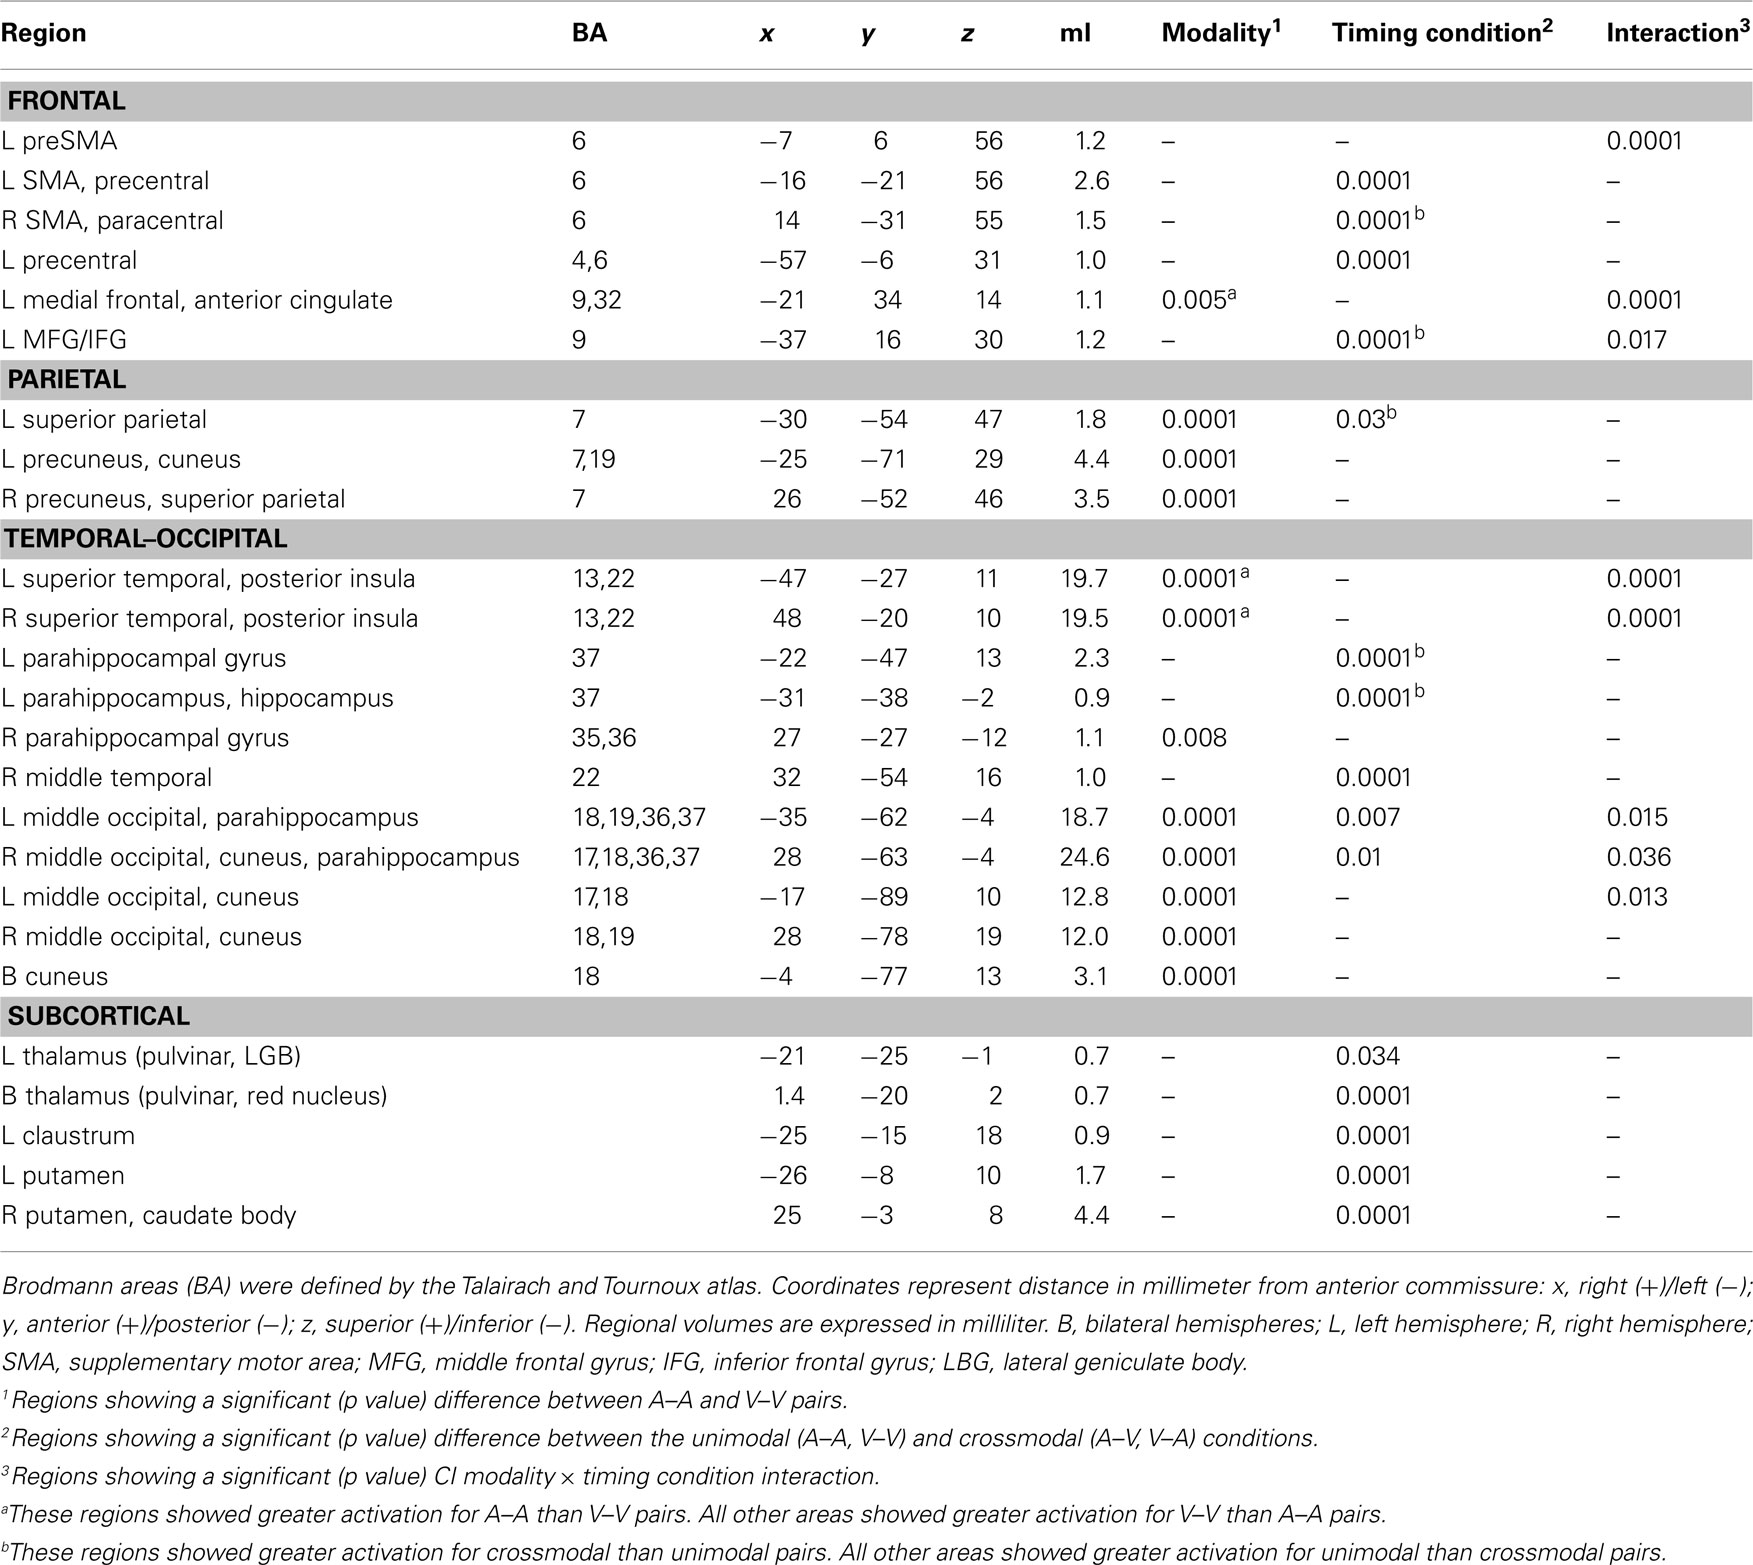
Table 1. Regions showing significant effects of modality, timing condition, and the interaction.
Audition versus vision. Table 1 and Figure 3 (left column; red) show that the modality of unimodal pairs affected activation largely in posterior cortical areas including in the parietal (superior parietal cortex and precuneus), temporal (posterior portions of superior temporal cortex and insula, middle temporal cortex, parahippocampus, hippocampus), and occipital cortices (middle-occipital cortex and cuneus). An exception was the modality effect on activation of the medial frontal/anterior cingulate areas. In most regions activation was greater for visual than auditory unimodal pairs, except for the medial frontal/anterior cingulate and superior temporal/insular cortices wherein activation was greater for auditory than visual pairs.
Intrasensory versus intersensory timing. Table 1, Figure 3 (middle column; yellow), and Figure 4 show that the timing condition also affected activation of the frontal [SMA, precentral, paracentral, middle frontal gyrus (MFG)/ inferior frontal gyrus (IFG)], superior parietal, temporal [middle temporal gyrus (MTG), parahippocampus, hippocampus], and middle-occipital cortices, the thalamus (pulvinar nucleus, lateral geniculate body) and the basal ganglia (putamen, caudate body). Figure 5 displays graphs of signal change for the unimodal and crossmodal conditions in representative regions. For most regions, activation was greater for unimodal than crossmodal pairs. Exceptions included the MFG/IFG and superior parietal cortex, wherein activation was greater for crossmodal than unimodal pairs. Activation was also greater for the crossmodal than the unimodal condition, but negative, in the right SMA/paracentral lobule and the left parahippocampus/hippocampus (Table 1, clusters 14 and 15).
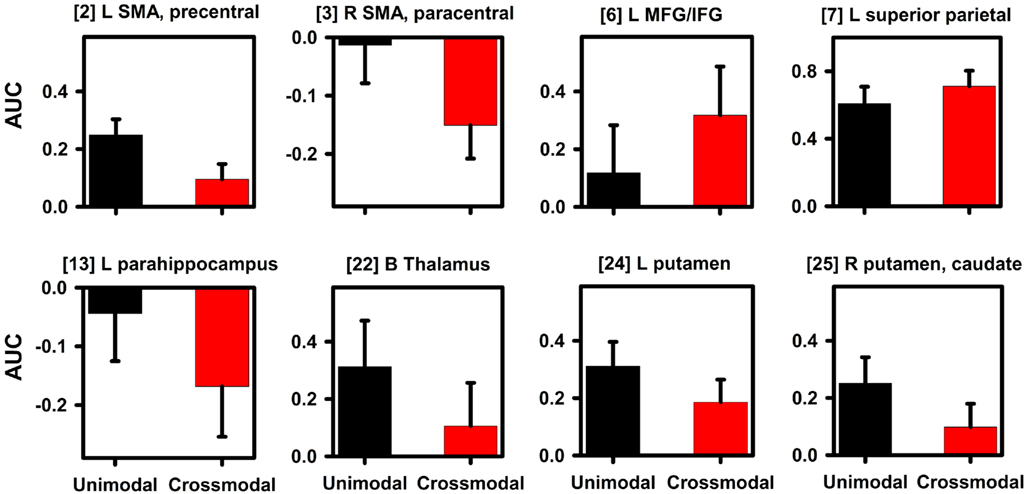
Figure 5. Signal change in regions showing an effect of timing condition. Graphs display representative regions showing differences in activation between the unimodal (A–A, V–V) and crossmodal (V–A, A–V) conditions. Mean (standard error bars) area under the curve (AUC) is plotted for each condition. Bracketed numbers reference regions detailed in Table 1. L, left hemisphere; R, right hemisphere; B, bilateral hemispheres; SMA, supplementary motor area; MFG, middle frontal gyrus; IFG, inferior frontal gyrus.
Time Dilation and Compression. Table 1 and Figure 3 (right column; green) display regions wherein CI modality interacted with the timing condition. All posterior, but not anterior, regions that showed an interaction also showed modality effects (A–A versus V–V; Figure 3, left column; red). However, we were principally interested in whether activation differed between the two crossmodal pairs (V–A versus A–V) since this contrast directly tests for regional activation associated with time dilation and compression, while controlling for the amount of auditory and visual stimulation. There were three patterns of interactions. First, for the left medial frontal/anterior cingulate, the interaction was due to greater activation in the auditory than the visual unimodal condition (Table 1), yet no difference between A–V and V–A pairs (p > 0.10). Second, Figure 6 shows that for the left preSMA and MFG/IFG, the interaction was due to greater activation for the A–V than the V–A pairs (p < 0.0001 and p < 0.02, respectively); auditory and visual unimodal conditions did not differ. For the third interaction pattern, Table 1 and Figure 6 show that large regional biases for timing unimodal auditory (right and left superior temporal/insula cortex) or visual pairs (right and left middle-occipital cortex) translated into smaller, but significant differences between the two crossmodal conditions. Specifically, activation was greater for V–A pairs in the right and left superior temporal/insula cortex (p < 0.006 and p < 0.02, respectively) and greater for A–V pairs in the right and left middle-occipital cortex (Table 1, clusters 16, 17, 19; p < 0.002, p < 0.007, and p < 0.01, respectively). Finally, for all other regions listed in Table 1, post hoc comparisons between A–V and V–A pairs were non-significant.
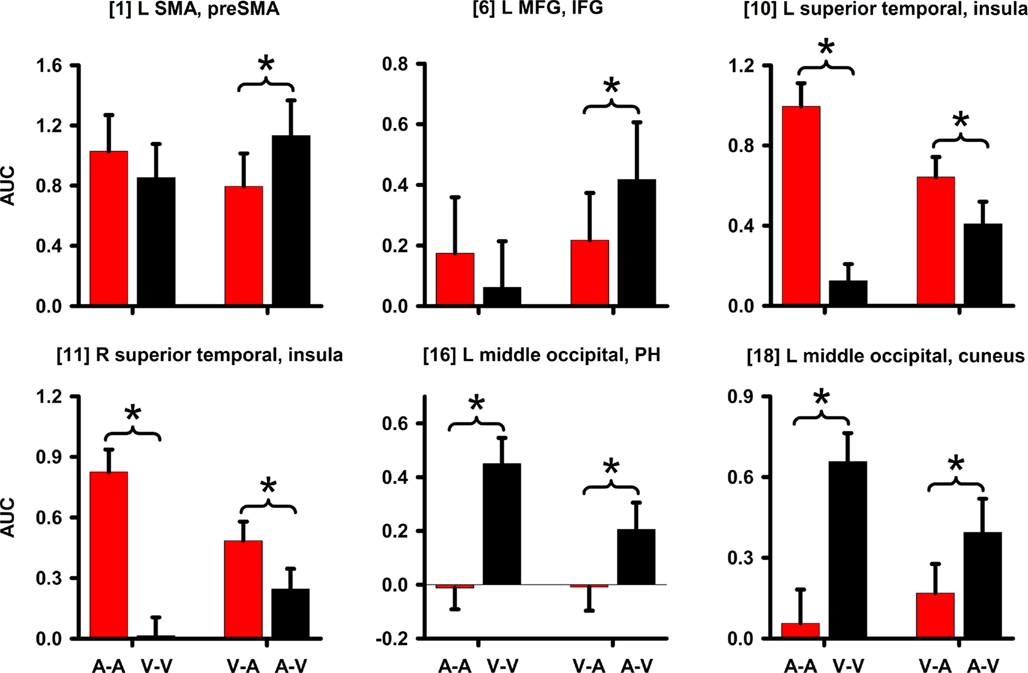
Figure 6. Signal change in regions showing an interaction. Graphs display regions showing a CI modality × timing condition interaction. Mean (standard error bars) area under the curve (AUC) is plotted for each condition. An asterisk designates the significance of key follow-up planned comparisons between the unimodal (A–A versus V–V) and crossmodal (V–A versus A–V) conditions. Bracketed numbers reference regions detailed in Table 1. L, left hemisphere; R, right hemisphere; SMA, supplementary motor area; MFG, middle frontal gyrus; IFG, inferior frontal gyrus; PH, parahippocampus.
Effective connectivity results
Intrasensory versus intersensory timing. For the connectivity analyses that used timing condition as an experimental variable, six seed ROI were selected including the left and right putamen (−26, −8, 11; 23, 0, 8), right caudate body (10, 10, 8), left and right SMA (−11, −16, 66; 5, −26, 55), and left superior parietal cortex (−34, −55, 50). The left putamen failed to show significant connectivity with other regions. Figure 7 displays spatial maps of regions exhibiting significant effective connectivity with each seed that was modulated by the timing condition. Table 2 describes the details of these interacting regions. For all seeds, effective connectivity was stronger in the crossmodal than the unimodal condition. The striatum and most cortical ROI showed connectivity with encoding/retrieval hubs (posterior cingulate, precuneus). The right caudate also showed connectivity with cognitive control [rostral medial frontal (BA 10), higher association (inferior parietal), and visual centers (MTG, lingual gyrus, vermis; Figure 7A)]. Connectivity of the left and/or right SMA was found with cognitive control [e.g., preSMA, precentral gyrus, MFG/superior frontal gyrus (SFG; BA 10, 47), IFG (BA 45, 47), memory (parahippocampus), and visual centers (fusiform and lingual gyrus), and with the ventral putamen and cerebellum (declive/culmen; Figure 7B)]. Left superior parietal cortex showed connectivity with cognitive control [preSMA/SMA, MFG (6), IFG (BA 9)] and visual centers (MTG), and with the thalamus (Figure 7C).
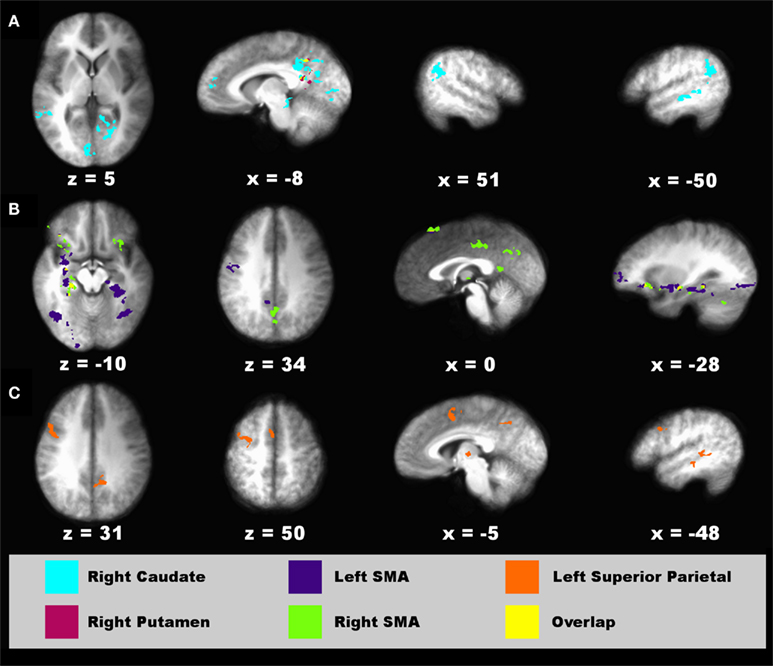
Figure 7. Regions showing connectivity with the striatum, SMA, and parietal cortex that was modulated by timing condition. Spatial locations of regions showing interactions with a seed fROI are displayed on sagittal and axial sections (neurological view). (A) Right caudate (turquoise) and right putamen (red) seeds. (B) Left (blue) and right (green) supplementary motor area (SMA) seeds. (C) Left superior parietal cortex seed (orange). The spatial overlap between two seeds in their interacting regions (A,B) is shown in yellow. Coordinates beneath sagittal and axial sections represent the distance in millimeter from the anterior commissure: x, right (+)/left (−); superior (+)/inferior (−). See Table 2 for details about individual activation foci.
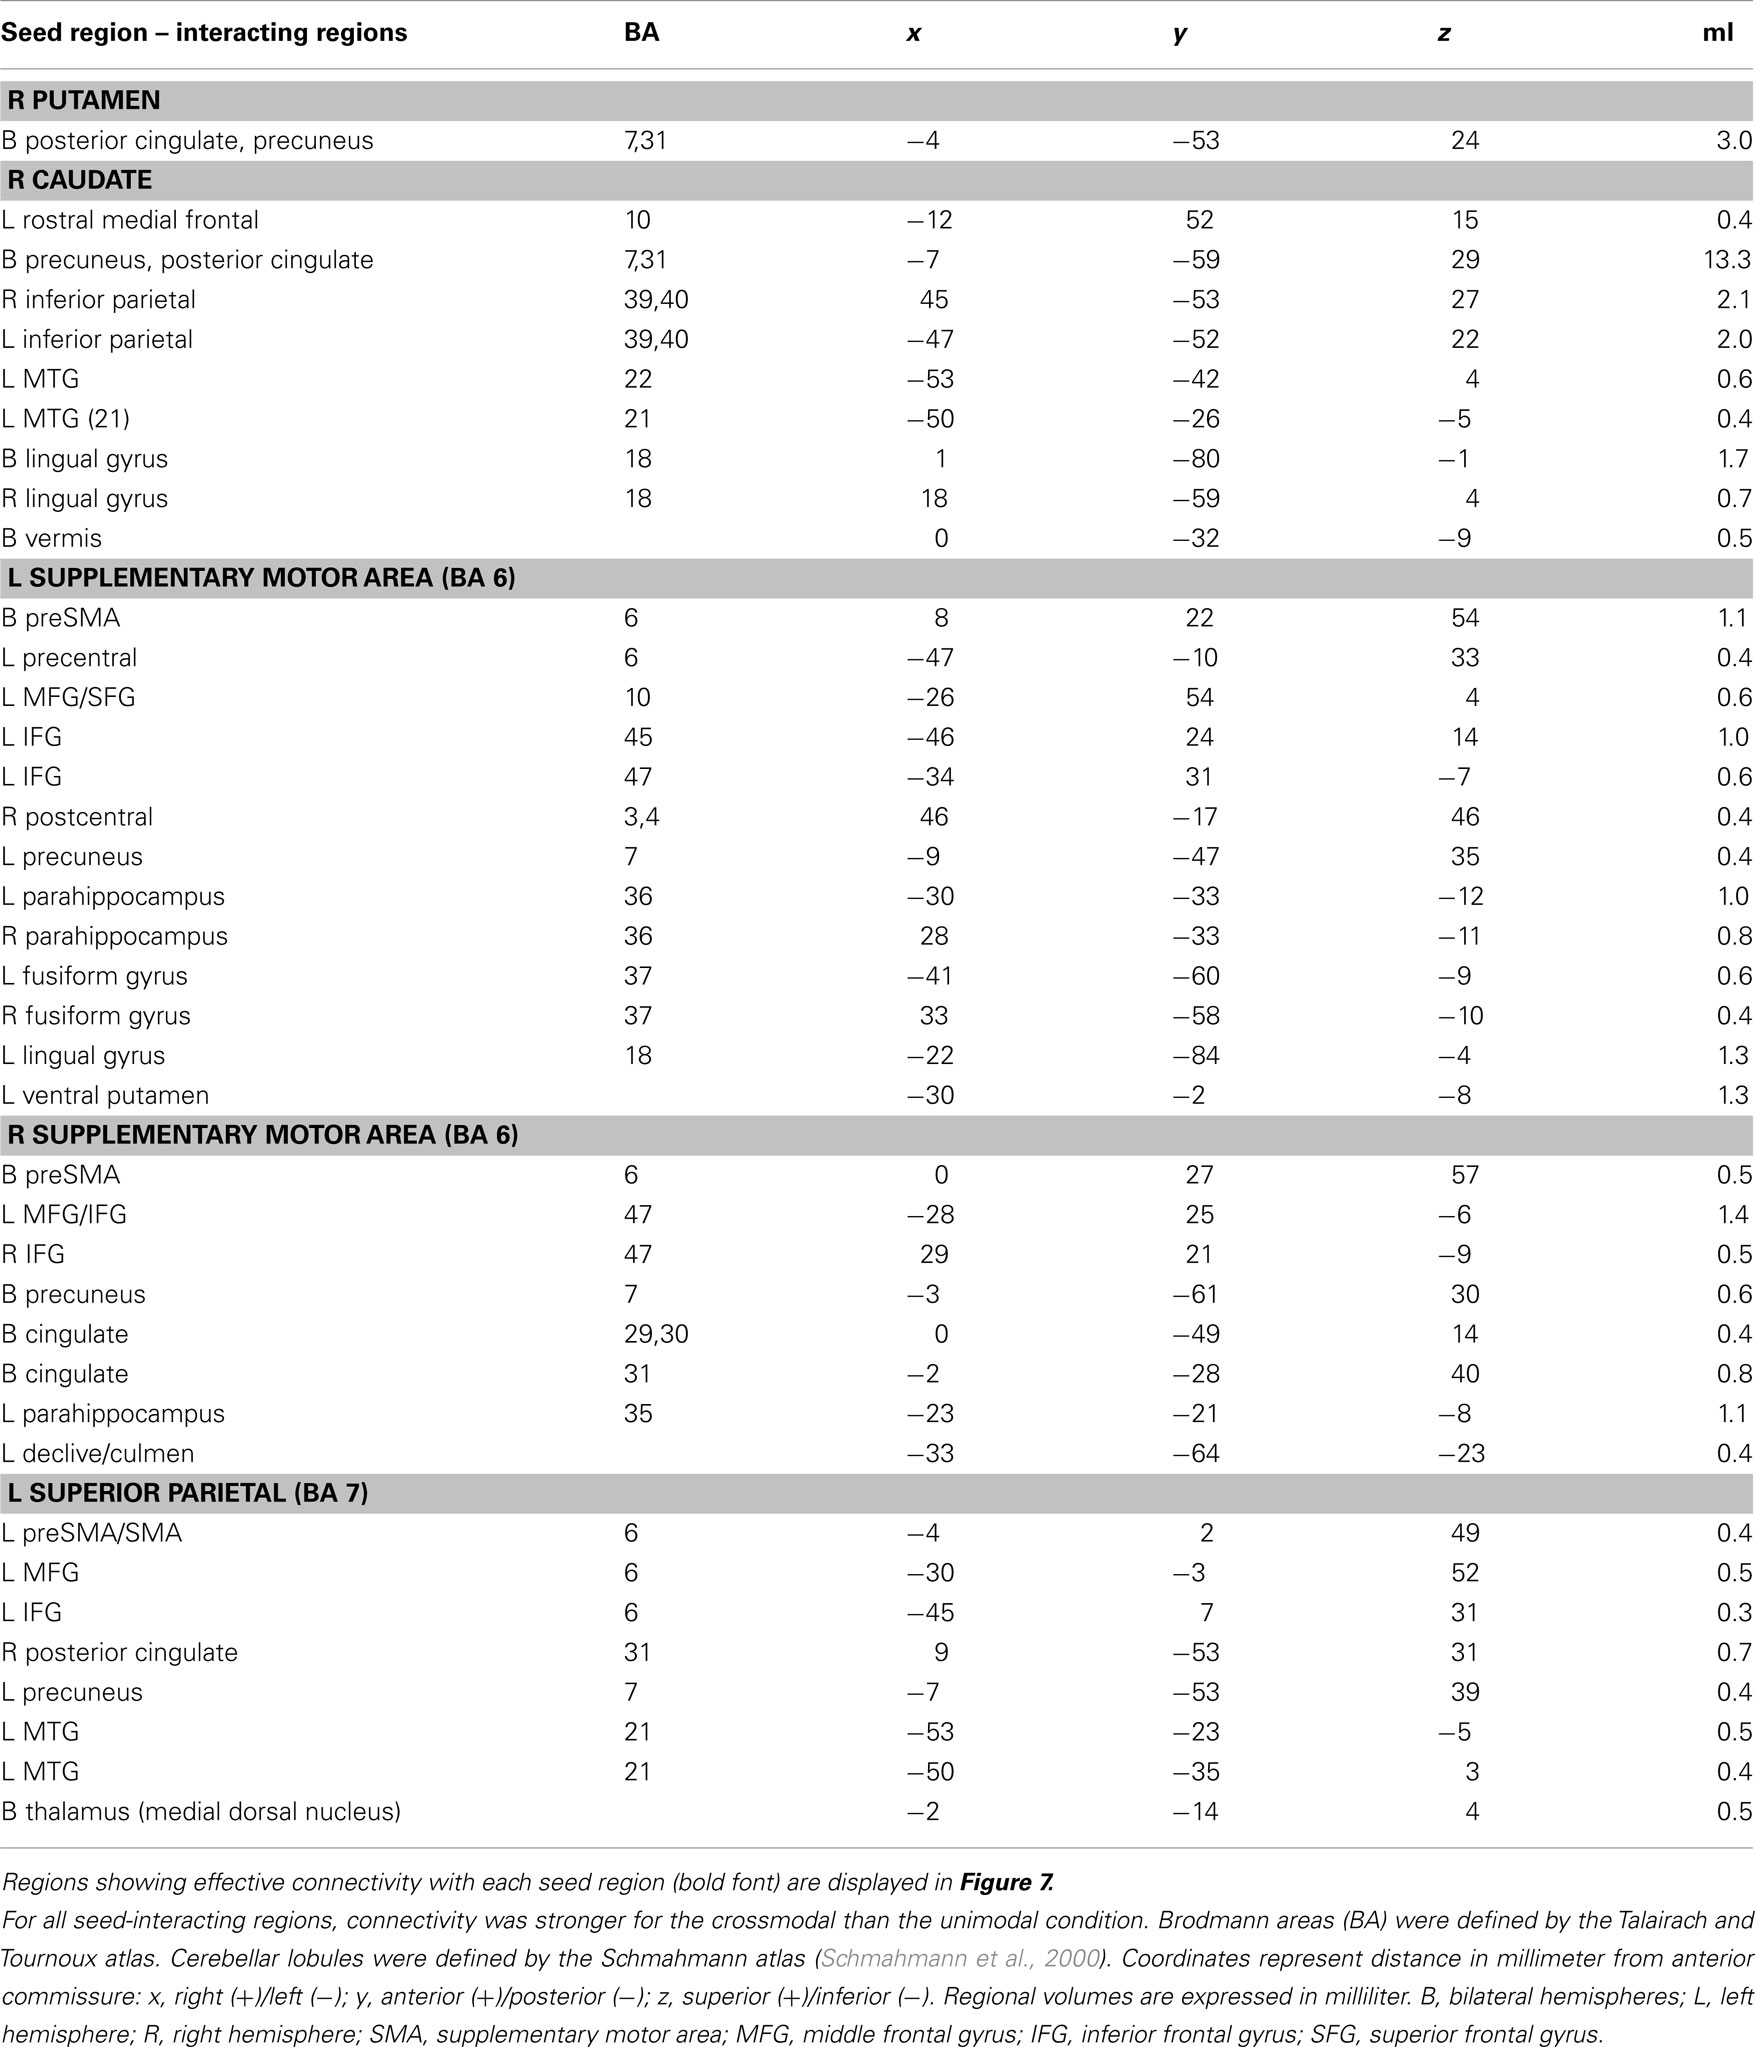
Table 2. Regions showing effective connectivity with the striatum and cortical ROI that was modulated by the timing condition (unimodal versus crossmodal).
Time Dilation and Compression. For the connectivity analyses that used the two crossmodal conditions as an experimental variable, nine seed ROI were selected including the left preSMA (−4, 11, 50), left MFG (−45, 14, 32), left and right superior temporal cortex (−55, −22, 10; 57, −21, 10), left and right posterior insula (−42, −13, 3; 43, −14, 5), and two left and one right middle-occipital areas (−5, −95, 4; −37, −77, −9; 30, −80, 1). Of these seeds, effective connectivity was not found for the left preSMA, left MFG, and two occipital seeds (Table 1, clusters 1, 6, 16, and 17). Figure 8 displays spatial maps of regions showing significant effective connectivity with each seed that was modulated by the time dilation and compression conditions. Table 3 describes the details of these interacting regions. Two patterns of effective connectivity were found. First, the predominant pattern was characterized by stronger connectivity in the V–A “time dilation” condition. For this pattern, the right and/or left superior temporal cortex showed connectivity with cognitive control [MFG (BA 6, 9, 10), IFG (6), SMA, preSMA], attention/association (superior/inferior parietal), sensory integration (anterior insula, claustrum), and visual centers, and with the caudate body and culmen (Figure 8A). Similarly, the left and/or right insula showed connectivity with cognitive control (SMA, preSMA), higher association (inferior parietal), and sensory integration areas (anterior insula), and with the putamen (Figure 8B). By comparison, the left middle-occipital seed showed more limited connectivity with sensory integration (anterior insula) and visual centers (cuneus; Figure 8C). Second, a less common pattern was characterized by stronger connectivity of some seeds with medial cortical areas in the A–V “time compression” condition (Figures 8A,B, sagittal views). Specifically, the left superior temporal cortex and the left and right insula showed stronger connectivity with rostral medial frontal cortex (9, 10) for A–V pairs. The right superior temporal cortex also showed stronger connectivity with the cingulate (BA 30, 31).
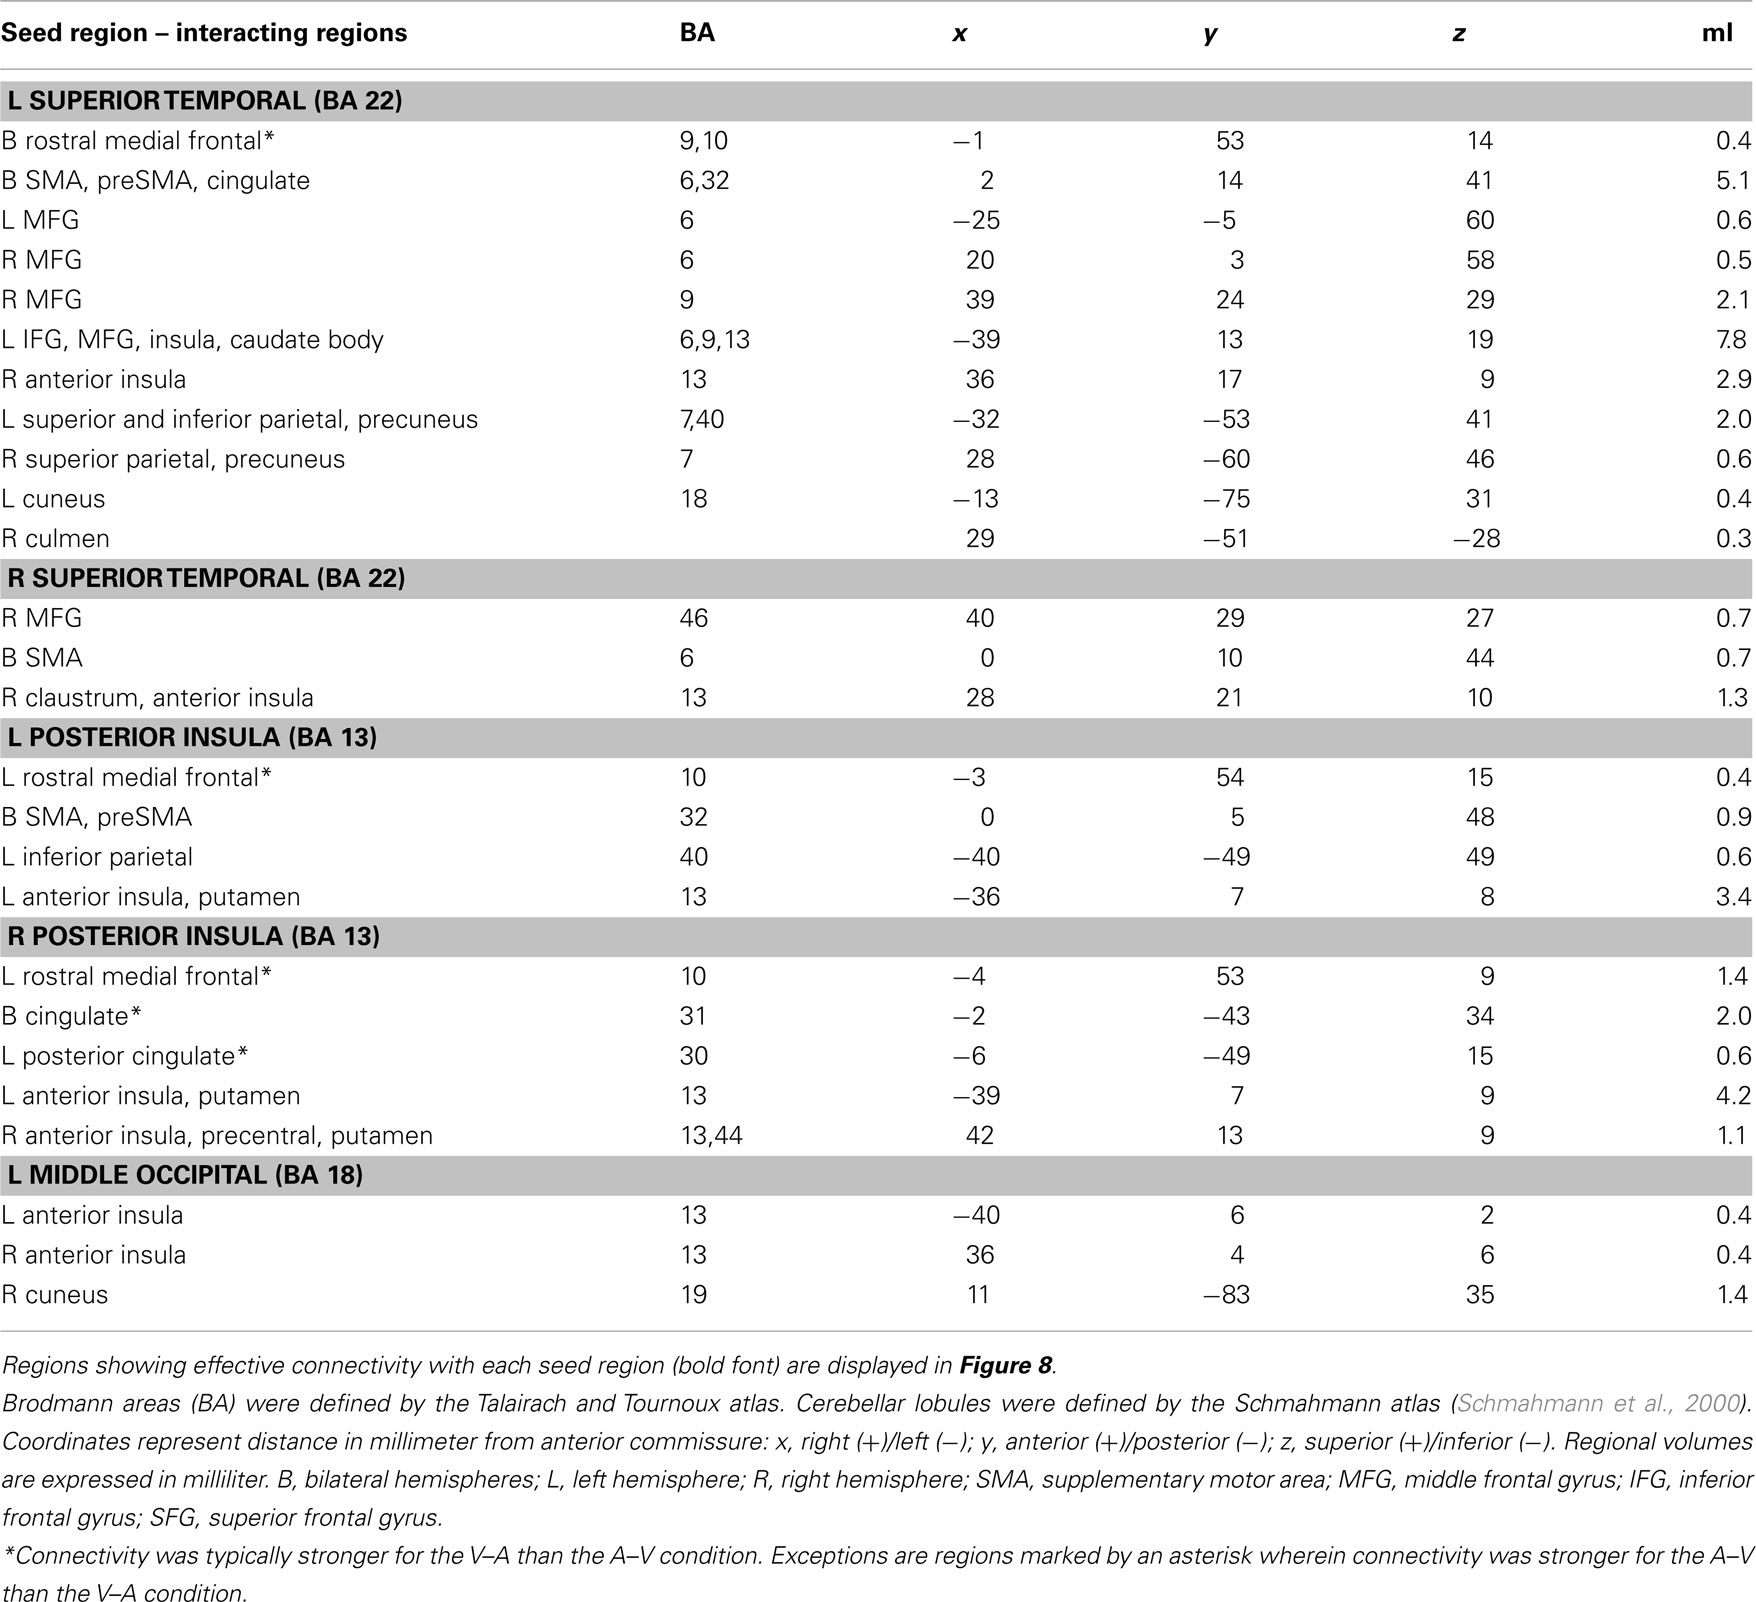
Table 3. Regions showing effective connectivity with cortical ROI that was modulated by the effects of time dilation and compression on perceived duration (V–A versus A–V).
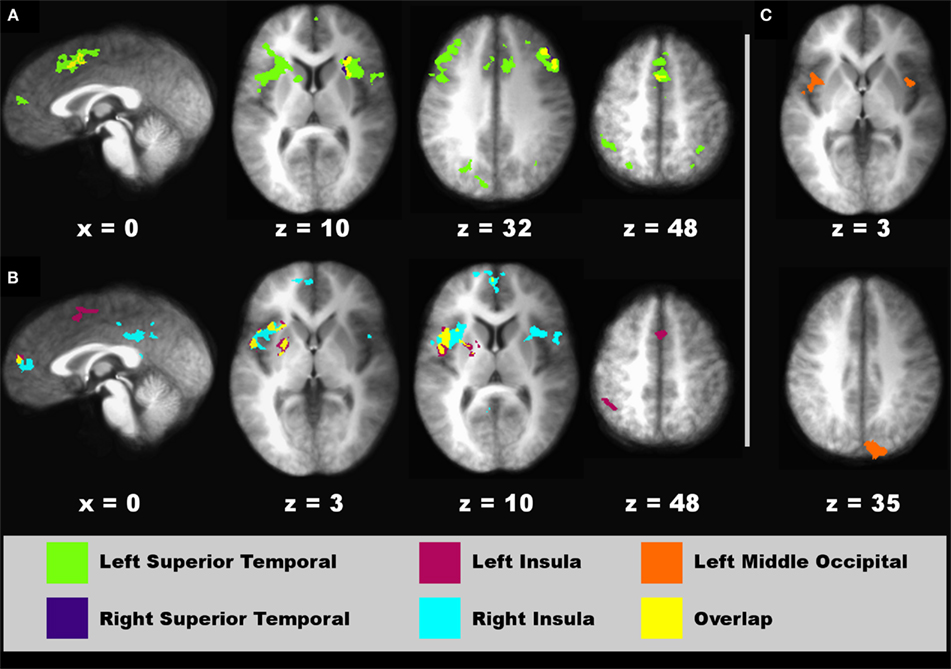
Figure 8. Regions showing connectivity with higher-sensory areas that was modulated by the time dilation and compression conditions. Spatial locations of regions showing interactions with a seed fROI are displayed on sagittal and axial sections (neurological view). (A) Left (green areas) and right superior temporal (blue areas) seeds. (B) Left (red) and right (turquoise) posterior insula seeds. (C) Left middle-occipital seed (orange). The spatial overlap between two seeds in their interacting regions (A,B) is shown in yellow. Coordinates beneath sagittal and axial sections represent the distance in millimeter from the anterior commissure: x, right (+)/left (−); superior (+)/inferior (−). See Table 3 for details about individual activation foci.
Discussion
Our behavioral findings confirmed that auditory CIs were perceived as lasting longer than visual CIs in the crossmodal condition (Ulrich et al., 2006). Moreover, pairwise comparisons of each crossmodal and unimodal condition demonstrated that perceived duration was dilated when the CI was auditory (V–A) and compressed when it was visual (A–V). Additionally, crossmodal RTs were faster when perceived duration was dilated, possibly because auditory signals are more salient in the context of temporal processing, wherein audition dominates vision (Repp and Penel, 2002; Recanzone, 2003; Mayer et al., 2009). We also found that differences between the unimodal and crossmodal conditions in judgments of time grew with CI duration, irrespective of CI modality. By pacemaker-accumulator models, this result suggests that intersensory timing affects the flow of pulses from the pacemaker rather than a delay in the start of the clock, which would have a constant effect across CI durations (Wearden et al., 1998, 2010; Penney et al., 2000).
The neural underpinnings of these behavioral findings were elucidated for the first time by the present study, which uncovered four main findings. First, we showed that time dilation and compression were distinguished by differential activation of higher-sensory areas (superior temporal/insula, middle occipital) associated with the modality of the CI. Effective connectivity of these areas with middle frontal and parietal cortices, anterior insula, and the striatum was typically stronger when perceived duration was dilated (V–A). We suspect that this result is due to the engagement of distributed neural networks when timing more salient auditory signals. Second, time compression (A–V) was characterized by greater activation of cognitive-control centers (preSMA, MFG/IFG), although these centers did not exhibit effective connectivity with other regions. This finding suggests that A–V comparisons required more cognitive effort, consistent with the longer RTs when perceived duration was compressed. Third, audiovisual distortions in subjective duration were not mediated by the striatum, suggesting that the rate of detection or integration of cortical oscillatory states is not faster for auditory than visual signals. Fourth, intersensory timing was distinguished from intrasensory timing by decreased activation of the striatum and SMA, but increased activation of an attention center (superior parietal cortex). These regions showed stronger connectivity with frontal, parietal, and visual areas during crossmodal than unimodal timing, which may signify the greater demands on core timing and attention systems in integrating audiovisual time codes. We now turn to a more complete discussion of these findings.
Time Dilation and Compression
Audiovisual distortions in perceived duration were largely distinguished by activity in higher-sensory areas, wherein the magnitude of activation and the strength of effective connectivity both depended on the time dilation/compression conditions. Despite equivalent stimulation of the two senses, activation was greater in bilateral superior temporal and posterior insular cortex when perceived duration was dilated (V–A) and greater in bilateral middle-occipital cortex when it was compressed (A–V). These results indicated that the modality of the CI drove differential activation in these areas, consistent with their respective bias for timing unimodal auditory or visual signals. At the same time, secondary auditory and visual centers are multisensory (Ghazanfar and Schroeder, 2006) and are thought to support audiovisual integration (Calvert, 2001; Klemen and Chambers, 2011). This prospect was suggested by our effective connectivity results wherein higher-sensory areas typically showed stronger connectivity when time was dilated rather than compressed.
Common to all of these higher-sensory areas was stronger connectivity with the anterior insula. The insula integrates processing from disparate domains (e.g., interoception, working memory, emotion) including time (Nenadic et al., 2003; Harrington et al., 2010; Kosillo and Smith, 2010; Wittmann et al., 2010a). It has also been linked to the dilation of perceived duration by salient features of visual signals (Wittmann et al., 2010b). Importantly, the insula mediates the perception of audiovisual asynchrony (Bushara et al., 2001; Calvert et al., 2001), implicating it in the synthesis of crossmodal signals based on their temporal correspondence. The anterior insula is also thought to be an attentional hub that assists central executive networks in generating accurate responses to salient or task-relevant events (Menon and Uddin, 2010). Auditory signals are more salient than visual signals in the context of temporal processing (Repp and Penel, 2002; Recanzone, 2003; Mayer et al., 2009). This is likely due to past experiences in timing principally via audition (e.g., music, speech), which over time may build up the connectivity strength of networks that mediate temporal processing of auditory signals. Thus, enhanced sensitivity in the anterior insula to auditory oscillatory patterns may contribute to time dilation. Time dilation was also related to stronger connectivity of superior temporal and insular cortices with the striatum (caudate and putamen), an alleged core-timing system (Matell and Meck, 2004), and with higher association areas (parietal cortex), sensorimotor areas (cerebellum), and cognitive-control centers (preSMA, MFG, IFG), which are also involved in audiovisual integration (Lewis et al., 2000; Bushara et al., 2001; Calvert et al., 2001). By comparison, only one of three middle-occipital fROI showed effective connectivity, which was inter-regionally restricted to the anterior insula. Taken together, these results indicate that a mechanism underlying audiovisual temporal distortions is the strength of superior temporal/posterior insular cortex connectivity with distributed networks that mediate multisensory integration, cognitive control, and timekeeping.
A less common finding was stronger connectivity in the time compression condition of the left superior temporal and bilateral insular cortices with medial cortical regions involved in more abstract decision making (rostral medial frontal; BA 9, 10) and executive control (posterior cingulate). This circumscribed connectivity pattern may reflect the greater difficulty of A–V than V–A judgments, consistent with their longer RTs. This prospect was also supported by our fROI analyses, wherein activation was greater in classic working memory and attention regions (preSMA, MFG, IFG) when time was compressed than when it was dilated. These regions, however, did not exhibit significant effective connectivity. This leads us to conclude that the preSMA and MFG/IFG are supramodal centers that direct attention and working memory resources during intersensory timing, but do not give rise to audiovisual effects on perceived duration per se.
Intersensory and Intrasensory Timing
Our fROI results did not suggest that audiovisual distortions in subjective duration were mediated by the striatum. Rather, we found that putamen and caudate activation was greater when timing unimodal than crossmodal signals, irrespective of the CI modality. This result was not consistent with classic attentional switching accounts of striatal function (van Schouwenburg et al., 2010), wherein greater activation would be expected in the crossmodal than the unimodal condition. Attentional switching should also produce a constant effect on perceived duration across CI durations for the crossmodal condition, which was not found.
The mechanisms by which time is synthesized across the senses are not understood. Crossmodal stimulation often enhances neuronal responses in multisensory integration centers (e.g., superior colliculus, association areas; Calvert et al., 2001), including the striatum (Nagy et al., 2006), but depression of neuronal responses is also found, especially when intersensory signals are spatially incongruent or asynchronous as in our study (Calvert et al., 2001). Increased striatal activation during unimodal timing may relate to the role of the striatum in detecting and integrating cortical oscillatory states, which provide the temporal code for signal duration (Matell and Meck, 2004). Stronger striatal responses might arise when timing unimodal signals because they share similar spatial signatures. Detection and temporal integration of oscillatory states might therefore speed up because evidence for the time code accumulates faster when the CI duration can be mapped onto the neural time-code of the SI modality, which is active in memory. Conversely, different spatial signatures for crossmodal signals may render temporal integration noisy, resulting in a diminished striatal response. Though speculative, this account may also relate to the increased activation and reduced suppression in the left and right SMA for unimodal than crossmodal timing. The SMA is sensitive to elapsed time (Pouthas et al., 2005; Mita et al., 2009; Wencil et al., 2010), but unlike the striatum, it mediates maintenance of temporal and non-temporal information (Harrington et al., 2010). The SMA may therefore maintain temporal representations online for other networks to make use of to affect behavior. Stronger SMA activation when timing unimodal than crossmodal signals may signify a stronger neural representation of the time code.
Despite the increased activation of the striatum and SMA during intrasensory timing, connectivity of these areas with the brain was stronger during crossmodal timing. For example, these regions showed stronger connectivity with a core memory hub (precuneus, posterior cingulate, parahippocampus), possibly signifying the greater dependence of striatum and SMA on output from encoding and retrieval systems during intersensory timing. The caudate and SMA also showed stronger connectivity with visual (fusiform and lingual gyrus, MTG), but not auditory centers, and frontal cognitive-control centers (medial frontal, MFG, SFG, IFG). These findings may relate in part to the more deliberate timing of visual signals (Repp and Penel, 2002; Mayer et al., 2009), which renders synthesis of audiovisual temporal codes more difficult.
Intersensory timing was also associated with increased activation of a frontal–parietal attention network. Though increased MFG/IFG activation was largely related to the more difficult A–V judgments, our results suggest that the synthesis of audiovisual temporal codes increases attentional processing in the superior parietal cortex, irrespective of the CI modality. This was consistent with the stronger connectivity of the superior parietal cortex with frontal control-systems (MFG, IFG) during crossmodal timing, but also with higher visual areas (MTG) and a memory encoding hub (precuneus, posterior cingulate). Altogether, these effective connectivity patterns suggest that more extensive network interactions with the striatum, SMA, and superior parietal cortex are needed to time intersensory than intrasensory signals.
Conclusion
Our results indicate that audiovisual effects on the experience of time emanate from higher-sensory areas, in which connectivity is stronger and far more inter-regionally distributed when timing auditory than visual signals. Though we found greater activation in cognitive-control centers for the more difficult (time compression) than easy (time dilation) crossmodal comparisons, effective connectivity of these regions was not modulated by the modality effect. This may suggest that cognitive-control centers play a supramodal role in directing attention or allocating working memory resources during decision making. We also found that audiovisual distortions in perceived duration were not driven by the striatum, suggesting that the presumed core-timing system (Matell and Meck, 2004) operates at the same rate for visual and auditory signals. Rather, during crossmodal timing, striatal activation was decreased and connectivity was stronger with visual, memory encoding and cognitive-control centers. These findings were attributed to the greater demands on striatal integration of crossmodal time codes. The present findings have implications for understanding neural mechanisms of temporal processing distortions in maturation and disease. For example, enhanced modality effects in children (Droit-Volet et al., 2007) and in individuals at risk for schizophrenia (Penney et al., 2005) are due to impaired timing of visual signals. Our results suggest that this might arise from developmental differences and preclinical changes in frontal cognitive-control centers, but also the connectivity of higher-sensory association areas with executive control centers (medial cortex). Conversely, audiovisual distortions in perceived duration are diminished in diagnosed schizophrenics, largely due to inaccurate timing of auditory signals (Carroll et al., 2008). This is consistent with changes in temporal cortex in schizophrenia, which may well alter inter-regional connectivity. Altogether, the present study demonstrates that intersensory synthesis of temporal information and time dilation and compression effects are mediated by different patterns of regional activation and inter-regional connectivity. Future studies are needed that further elucidate interactions among multiple brain regions, which are fundamental to temporal processing and likely breakdown in certain neurological and psychiatric disorders.
Conflict of Interest Statement
The authors declare that the research was conducted in the absence of any commercial or financial relationships that could be construed as a potential conflict of interest.
Acknowledgments
This research was supported by grants from the Department of Veterans Affairs (#1IO1CX000146-01 and #B501R), NIH/NINDS #NS040068, an ONR DURIP award (#N000140811114), and the McDonnell Foundation (#220020185).
References
Bushara, K. O., Grafman, J., and Hallett, M. (2001). Neural correlates of auditory-visual stimulus onset asynchrony detection. J. Neurosci. 21, 300–304.
Calvert, G. A. (2001). Crossmodal processing in the human brain: insights from functional neuroimaging studies. Cereb. Cortex 11, 1110–1123.
Calvert, G. A., Hansen, P. C., Iversen, S. D., and Brammer, M. J. (2001). Detection of audio-visual integration sites in humans by application of electrophysiological criteria to the BOLD effect. Neuroimage 14, 427–438.
Carroll, C. A., Boggs, J., O’Donnell, B. F., Shekhar, A., and Hetrick, W. P. (2008). Temporal processing dysfunction in schizophrenia. Brain Cogn. 67, 150–161.
Casini, L., and Macar, F. (1997). Effects of attention manipulation on judgments of duration and of intensity in the visual modality. Mem. Cognit. 25, 812–818.
Coull, J. T., Vidal, F., Nazarian, B., and Macar, F. (2004). Functional anatomy of the attentional modulation of time estimation. Science 303, 1506–1508.
Cox, R. W. (1996). AFNI: software for analysis and visualization of functional magnetic resonance neuroimages. Comput. Biomed. Res. 29, 162–173.
Droit-Volet, S., and Meck, W. H. (2007). How emotions colour our perception of time. Trends Cogn. Sci. (Regul. Ed.) 11, 504–513.
Droit-Volet, S., Meck, W. H., and Penney, T. B. (2007). Sensory modality and time perception in children and adults. Behav. Processes 74, 244–250.
Eagleman, D. M., and Pariyadath, V. (2009). Is subjective duration a signature of coding efficiency? Philos. Trans. R. Soc. Lond B Biol. Sci. 364, 1841–1851.
Friston, K. J., Buechel, C., Fink, G. R., Morris, J., Rolls, E., and Dolan, R. J. (1997). Psychophysiological and modulatory interactions in neuroimaging. Neuroimage 6, 218–229.
Gamache, P. L., and Grondin, S. (2010). The lifespan of time intervals in reference memory. Perception 39, 1431–1451.
Ghazanfar, A. A., and Schroeder, C. E. (2006). Is neocortex essentially multisensory? Trends Cogn. Sci. (Regul. Ed.) 10, 278–285.
Grondin, S., and McAuley, D. (2009). Duration discrimination in crossmodal sequences. Perception 38, 1542–1559.
Harrington, D. L., Zimbelman, J. L., Hinton, S. C., and Rao, S. M. (2010). Neural modulation of temporal encoding, maintenance, and decision processes. Cereb. Cortex 20, 1274–1285.
Klemen, J., and Chambers, C. D. (2011). Current perspectives and methods in studying neural mechanisms of multisensory interactions. Neurosci. Biobehav. Rev. doi: 10.1016/j.neubiorev.2011.04.015. [Epub ahead of print].
Kosillo, P., and Smith, A. T. (2010). The role of the human anterior insular cortex in time processing. Brain Struct. Funct. 214, 623–628.
Lewis, J. W., Beauchamp, M. S., and DeYoe, E. A. (2000). A comparison of visual and auditory motion processing in human cerebral cortex. Cereb. Cortex 10, 873–888.
Matell, M. S., and Meck, W. H. (2004). Cortico-striatal circuits and interval timing: coincidence detection of oscillatory processes. Cogn. Brain Res. 21, 139–170.
Matthews, W. J., Stewart, N., and Wearden, J. H. (2011). Stimulus intensity and the perception of duration. J. Exp. Psychol. Hum. Percept. Perform. 37, 303–313.
Mayer, A. R., Franco, A. R., Canive, J., and Harrington, D. L. (2009). The effects of stimulus modality and frequency of stimulus presentation on cross-modal distraction. Cereb. Cortex 19, 993–1007.
Mella, N., Conty, L., and Pouthas, V. (2011). The role of physiological arousal in time perception: psychophysiological evidence from an emotion regulation paradigm. Brain Cogn. 75, 182–187.
Menon, V., and Uddin, L. Q. (2010). Saliency, switching, attention and control: a network model of insula function. Brain Struct. Funct. 214, 655–667.
Merchant, H., Zarco, W., and Prado, L. (2008). Do we have a common mechanism for measuring time in the hundreds of millisecond range? Evidence from multiple-interval timing tasks. J. Neurophysiol. 99, 939–949.
Mita, A., Mushiake, H., Shima, K., Matsuzaka, Y., and Tanji, J. (2009). Interval time coding by neurons in the presupplementary and supplementary motor areas. Nat. Neurosci. 12, 502–507.
Nagy, A., Eordegh, G., Paroczy, Z., Markus, Z., and Benedek, G. (2006). Multisensory integration in the basal ganglia. Eur. J. Neurosci. 24, 917–924.
Nenadic, I., Gaser, C., Volz, H. P., Rammsayer, T., Hager, F., and Sauer, H. (2003). Processing of temporal information and the basal ganglia: new evidence from fMRI. Exp. Brain Res. 148, 238–246.
Penney, T. B., Gibbon, J., and Meck, W. H. (2000). Differential effects of auditory and visual signals on clock speed and temporal memory. J. Exp. Psychol. Hum. Percept. Perform. 26, 1770–1787.
Penney, T. B., Meck, W. H., Roberts, S. A., Gibbon, J., and Erlenmeyer-Kimling, L. (2005). Interval-timing deficits in individuals at high risk for schizophrenia. Brain Cogn. 58, 109–118.
Pouthas, V., George, N., Poline, J. B., Pfeuty, M., Vandemoorteele, P. F., Hugueville, L., Ferrandez, A.-M., Lehéricy, S., Lebihan, D., and Renault, B. (2005). Neural network involved in time perception: an fMRI study comparing long and short interval estimation. Hum. Brain Mapp. 25, 433–441.
Recanzone, G. H. (2003). Auditory influences on visual temporal rate perception. J. Neurophysiol. 89, 1078–1093.
Repp, B. H., and Penel, A. (2002). Auditory dominance in temporal processing: new evidence from synchronization with simultaneous visual and auditory sequences. J. Exp. Psychol. Hum. Percept. Perform. 28, 1085–1099.
Schmahmann, J., Doyon, J., Toga, A., Petrides, M., and Evans, A. (2000). MRI Atlas of the Human Cerebellum. San Diego: Academic Press.
Tse, P. U., Intriligator, J., Rivest, J., and Cavanagh, P. (2004). Attention and the subjective expansion of time. Percept. Psychophys. 66, 1171–1189.
Ulrich, R., Nitschke, J., and Rammsayer, T. (2006). Crossmodal temporal discrimination: assessing the predictions of a general pacemaker-counter model. Percept. Psychophys. 68, 1140–1152.
van Schouwenburg, M. R., den Ouden, H. E., and Cools, R. (2010). The human basal ganglia modulate frontal-posterior connectivity during attention shifting. J. Neurosci. 30, 9910–9918.
van Wassenhove, V., Buonomano, D. V., Shimojo, S., and Shams, L. (2008). Distortions of subjective time perception within and across senses. PLoS ONE 3, e1437. doi: 10.1371/journal.pone.0001437
Wearden, J. H., Edwards, H., Fakhri, M., and Percival, A. (1998). Why “sounds are judged longer than lights”: application of a model of the internal clock in humans. Q. J. Exp. Psychol. B 51, 97–120.
Wearden, J. H., O’Rourke, S. C., Matchwick, C., Min, Z., and Maeers, S. (2010). Task switching and subjective duration. Q. J. Exp. Psychol. (Colchester) 63, 531–543.
Wearden, J. H., Todd, N. P., and Jones, L. A. (2006). When do auditory/visual differences in duration judgements occur? Q. J. Exp. Psychol. (Colchester) 59, 1709–1724.
Wencil, E. B., Coslett, H. B., Aguirre, G. K., and Chatterjee, A. (2010). Carving the clock at its component joints: neural bases for interval timing. J. Neurophysiol. 104, 160–168.
Wittmann, M., Simmons, A. N., Aron, J. L., and Paulus, M. P. (2010a). Accumulation of neural activity in the posterior insula encodes the passage of time. Neuropsychologia 48, 3110–3120.
Wittmann, M., van Wassenhove, V., Craig, A. D., and Paulus, M. P. (2010b). The neural substrates of subjective time dilation. Front. Hum. Neurosci. 4:2. doi: 10.3389/neuro.09.002.2010
Keywords: temporal processing, audiovisual temporal distortions, crossmodal timing, fMRI, striatum, sensory integration, attention
Citation: Harrington DL, Castillo GN, Fong CH and Reed JD (2011) Neural underpinnings of distortions in the experience of time across senses. Front. Integr. Neurosci. 5:32. doi: 10.3389/fnint.2011.00032
Received: 01 June 2011; Paper pending published: 28 June 2011;
Accepted: 13 July 2011; Published online: 28 July 2011.
Edited by:
Warren H. Meck, Duke University, USAReviewed by:
Hugo Merchant, Universidad Nacional Autónoma de México, MexicoJohn F. Araujo, Federal University of Rio Grande do Norte, Brazil
Marc Wittmann, Institute for Frontier Areas of Psychology and Mental Health, Germany
Copyright: © 2011 Harrington, Castillo, Fong and Reed. This is an open-access article subject to a non-exclusive license between the authors and Frontiers Media SA, which permits use, distribution and reproduction in other forums, provided the original authors and source are credited and other Frontiers conditions are complied with.
*Correspondence: Deborah L. Harrington, Research Service, Veterans Affairs San Diego Healthcare System, 116A-13, San Diego, CA 92161, USA. e-mail: dharrington@ucsd.edu