
- 1 Social and Neural Systems Lab, University of Zurich, Zurich, Switzerland
- 2 Department of Economics, University of Zurich, Zurich, Switzerland
- 3 Department of Neurophysics, Philipps-University Marburg, Marburg, Germany
Our decisions are guided by the rewards we expect. These expectations are often based on incomplete knowledge and are thus subject to uncertainty. While the neurophysiology of expected rewards is well understood, less is known about the physiology of uncertainty. We hypothesize that uncertainty, or more specifically errors in judging uncertainty, are reflected in pupil dilation, a marker that has frequently been associated with decision making, but so far has remained largely elusive to quantitative models. To test this hypothesis, we measure pupil dilation while observers perform an auditory gambling task. This task dissociates two key decision variables – uncertainty and reward – and their errors from each other and from the act of the decision itself. We first demonstrate that the pupil does not signal expected reward or uncertainty per se, but instead signals surprise, that is, errors in judging uncertainty. While this general finding is independent of the precise quantification of these decision variables, we then analyze this effect with respect to a specific mathematical model of uncertainty and surprise, namely risk and risk prediction error. Using this quantification, we find that pupil dilation and risk prediction error are indeed highly correlated. Under the assumption of a tight link between noradrenaline (NA) and pupil size under constant illumination, our data may be interpreted as empirical evidence for the hypothesis that NA plays a similar role for uncertainty as dopamine does for reward, namely the encoding of error signals.
Introduction
From simple motor tasks to complex financial transactions, decisions are at the core of human behavior. It is often assumed that decisions are mainly driven by the desire to maximize expected reward. However, expected rewards are frequently uncertain. This uncertainty affects behavior and learning in addition to the expectation itself. When expectations are not met, surprise arises: The more certain one had been about an expectation that turned out to be wrong, the more surprised one will be. Thus, a full description of the decision making process requires – beyond measures of expected reward – robust markers of uncertainty and surprise. Here we investigate pupil dilation as an outwardly accessible, physiological marker of decision variables. Pupil dilation under constant illumination has been associated with a variety of cognitive functions. In the context of decision making, the pupil has been related to qualitative concepts such as arousal (Bradshaw, 1967), alertness (Yoss et al., 1970), or the decision process itself (Simpson and Hale, 1969). Despite decades of psychophysiological research, up to now, a quantitative link between the pupil and precisely defined decision variables has been lacking. Recently, Gilzenrat et al. (2010) as well as Jepma and Nieuwenhuis (2011) provided quantitative assessments of pupil dilation in the context of shifts between exploitation (task engagement) and exploration (disengagement). While decision variables were present in their paradigms, they were not the primary object of study and need to be estimated from the observers’ subjective choices. Out of the many studies that have considered the pupil in decision making, to the best of our knowledge, our study is the first that is designed explicitly to dissociate the contributions of distinct decision variables, here risk and reward and their errors, to the pupil response in a quantitative way.
Two lines of research inspired the present study. First, converging evidence from electrophysiology (Rajkowski et al., 1994), pharmacology (Phillips et al., 2000), anatomy (Samuels and Szabadi, 2008 for review), and human imaging (Sterpenich et al., 2006; but see Astafiev et al., 2010) points to a tight link between pupil dilation under constant illumination and the neurotransmitter noradrenaline (NA). Second, a recent modeling study reviewed primarily electrophysiological studies of the noradrenergic system and concluded that phasic NA activity may signal unexpected uncertainty (a form of surprise; Dayan and Yu, 2006). Linking these two lines of research, we hypothesized that the pupil signals surprise. To test this hypothesis, we asked participants to perform an auditory gambling task, while their pupil dilation was measured. Not only do we find a quantitative match between surprise and the pupil size, but we also dissociate it from expected reward, which contributes little to nothing to the pupil response. More intriguingly, the formalization of surprise (i.e., unexpected uncertainty) as risk prediction error (RE) allows us its dissociation from expected uncertainty (formalized as risk). As such, we explicitly link pupil data to mathematically well-defined decision variables. Using the purported link between pupil and NA, another intriguing corollary follows: in this view, NA takes the same function for risk as dopamine does for reward – signaling prediction error.
Materials and Methods
Participants
Twelve volunteers from the Philipps-University Marburg community participated in the study (5 male, 7 female; mean age: 25.7, age range: 19–47). All participants had normal or corrected to normal vision and gave written informed consent. All procedures conformed with national and institutional guidelines for the use of human subjects and with the Declaration of Helsinki.
Behavioral Paradigm
Participants played an auditory gambling task adapted from a previously used task (Preuschoff et al., 2006); to ensure constant low illumination, all stimuli (cards) and instructions were presented through speakers instead of being visually displayed (Figure 1). Two cards were drawn (without replacement within each trial) from a deck of 10, numbered 1 through 10. Before hearing either card, participants used a gamepad to place a $1 bet on whether the first or the second card would be higher. Five seconds after the bet was placed, card 1 was sounded through the speakers, followed 5 s later by card 2. Five seconds after the presentation of card 2, participants were asked to report through the gamepad whether they won $1 or lost $1. In case of an incorrect response participants lost $0.25, independent of whether their gamble had paid off. Reward level was kept constant across all trials. Because of this, expected reward and risk upon display of the first card change only as a function of the probability of winning. To ensure participants motivation, they started with $25 of gambling money, and $1 of gambling money was converted into €0.20 real money at the end of the experiment.
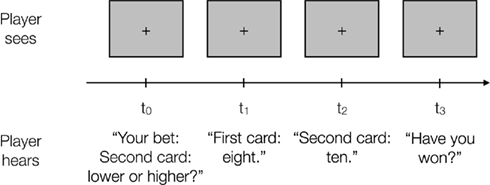
Figure 1. Auditory gambling task. In each trial auditory instructions ask participants to place a bet whether the second card will be lower or higher than the first one. Five seconds after the response the first card is drawn, 5 s later the second card and further 5 s later participants have to indicate whether they have lost or won. All instructions are given auditorily through speakers, while participants maintain fixation. All details for computation of reward, risk, and risk prediction error as well as the numerical values for all possible combinations of cards are given in the Section “Mathematical Details – Models of Expected Reward, Uncertainty (Risk), and Surprise (Risk Prediction Error).”
Participants reported their win/loss outcome reliably, with correct answers in at least 87/90 (96.7%) trials (average: 88.75/90). Only these trials (1065 in total, i.e., 98.6% of all trials) were used for analysis. Participants placed both bets about equally often, with in total 576 (53.2%) bets on “second card higher,” and there was no pronounced bias in any individual (range: 47.7–63.0% of “second card higher” bets).
Data Acquisition
Experiments were performed in a black, sound-proof room with negligible ambient light levels. During the whole experiment eye position and pupil diameter were monitored with an Eyelink-2000 (SR Research, Mississauga, ON, Canada) eye-tracking device. All data acquisition and analysis were performed in Matlab (The Mathworks, Natick, MA, USA) including its psychophysics and eyelink toolbox extensions (http://psychtoolbox.org; Cornelissen et al., 2002). Participants were instructed to fixate a central spot throughout each trial. Before each trial the calibration of the eyetracker was validated with four additional fixation points and re-calibrated if needed. Fixation spots were black (<0.01 cd/m2) on a dark gray background (6 cd/m2) presented on a 21″ screen located about 80 cm from the participants. Instructions and drawn cards were presented through speakers adjacent to the screen. To achieve standardized conditions, sound files were generated using the “Read Out Loud” tool of Adobe Acrobat Professional using a standard female voice (“Vicky”) of Mac OS X and stored in wav format for presentation. To familiarize participants with the sounds and ensure understanding of within trial presentations all sound files were played to the participants prior to the experiment, until participants were sure they understood the content.
Pupil Data
Traces of pupil dilation were recorded with at least 500 Hz sampling rate (higher sampling rates were used when SNR of the pupil detection allowed, but all data are downsampled to 500 Hz before any further analysis). Periods of blinks were detected using the manufacturer’s standard algorithms with default settings. Pupil dilation during blinks was interpolated by cubic spline interpolation. Responses (bet and indication of win/loss) were recorded with a gamepad device. For analysis of effects of the first card, pupil traces were aligned at the offset of the card’s presentation. To facilitate comparison within and across subjects, all traces were normalized by subtracting the diameter at this time point and dividing by it, resulting in a percentage signal change measure relative to card offset. By this normalization any generic effect that lasts longer than an individual trial (e.g., arousal, fatigue) cannot confound the results. Similarly, the data referring to the second card was normalized relative to the draw of the second card.
Statistics and Regression
The time-courses of pupil dilation are compared point-wise by two-sided t-tests. To correct for multiple comparisons the alpha-level is adjusted to an expected false-discovery rate of 5% using the method of Benjamini and Hochberg (1995). The corrected alpha-level is denoted as FDR0.05 and only time-points with p-values below this level are referred to as significant.
For data of Figures 2D,E, the best fit in the least-squares sense to the pupil data for the function

is sought, were c* denotes the bet-corrected first card, R1 risk after the first card (in units of $2) and pwin,1 the probability of winning after the first card, as detailed in the Section “Mathematical Details – Models of Expected Reward, Uncertainty (Risk), and Surprise (Risk Prediction Error)” below. The evaluation of the fit parameters u, v, w over the 5-s period after the first card represent the time course of the effect of risk, expected reward (proportional to pwin,1) and generic effects that are not related to manipulated decision variables, respectively.
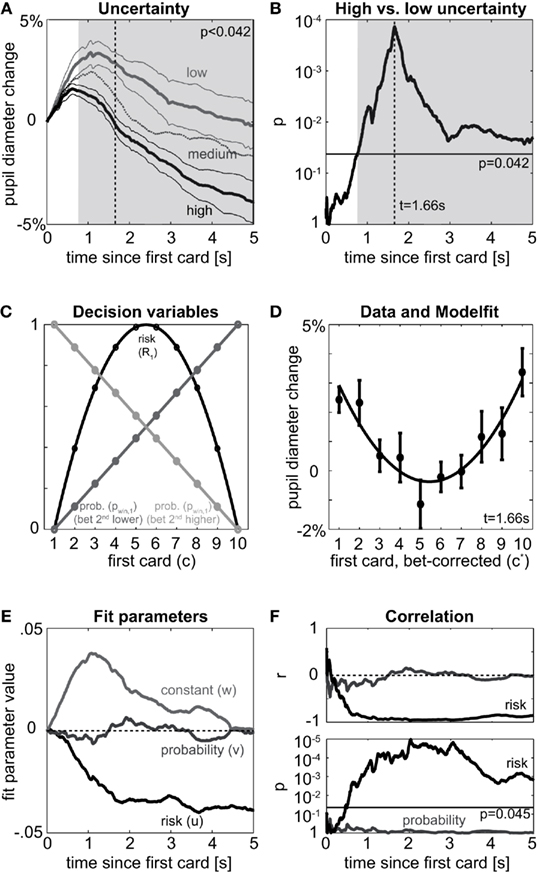
Figure 2. First card. (A) Pupil dilation between first and second card relative to the time of drawing the first card split by level of uncertainty after first card. Pupil dilates more if the outcome is sure (low uncertainty, light gray, card was 1 or 10) than for high uncertainty trials (black, cards 4,5,6,7), while medium uncertainty trials (dark gray, cards 2,3,8,9) fall in between. Thick lines denote means over participants, thin lines SEM for high and low uncertainty trials; shaded area denotes time when high uncertainty significantly differs from low uncertainty at an expected FDR of 5% (p < FDR0.05 = 0.042). (B) Significance of difference between high and low uncertainty trials as given in (A). Results of point-wise t-tests for equality of means; negative logarithmic scale implies values to the top to be more significant (lower p). Horizontal line denotes expected FDR of 5% (FDR0.05 = 0.042), times of significant differences fall above. (C) Model: Probability of winning (gray) and risk (black) after the first card is drawn as function of the first card. Expected reward is linear in the probability of winning. Units of $ (reward) and $2 (risk) omitted. Note that probability of winning depends on the bet, but risk does not. To pool data over both bets for the analysis of the first card, we exploit symmetry: in case of the bet “second card higher” the number representing the card is replaced by its mirror (1 → 10, 2 → 9,…,10 → 1) and all bets are treated as “second card lower.” Mathematically we denote the actual card as “c” and the bet-corrected card as “c*” [see Mathematical Details – Models of Expected Reward, Uncertainty (Risk), and Surprise (Risk Prediction Error)]. (D) Points: Pupil dilation [as in (A)] at time of peak significance between high and low uncertainty sorted by card (c*, adjusted for bet); mean and SEM over subjects. The parabola-shape resulting from the quadratic dependence of risk on c* [cf. (C)] is evident. Line: fit of a model including risk, probability of winning, and a constant offset, coefficients u, v, and w, respectively. (E) Evolution of fit parameters [as in (D)] over time. Quickly after the first card, the effect of risk (u) rises, while the effect of reward (and probability of winning, v) shows little systematic change over time. The contribution of the constant (w) reflects the general time course of pupil dilation over the trial, which happens irrespective of the card’s value and thus independent of any decision variables. (F) Correlation of pupil dilation to risk (black) or probability (gray). Top: correlation coefficient, bottom: probability of correlation being different from 0. Horizontal line denotes 5% expected FDR for risk (FDR0.05 = 0.045).
Mathematical Details – Models of Expected Reward, Uncertainty (Risk), and Surprise (Risk Prediction Error)
Notation
For each decision variable, we consider three different periods indicated by subscripts, the time after the bet prior to the first card (subscript 0), the time between the cards (subscript 1) and the time after the second card (subscript 2). We first define the quantities used. Below we explicitly compute them as functions of the drawn cards and tabulate the values for each possible constellation in Tables 1 and 2. E[x] denotes the expectation of x.
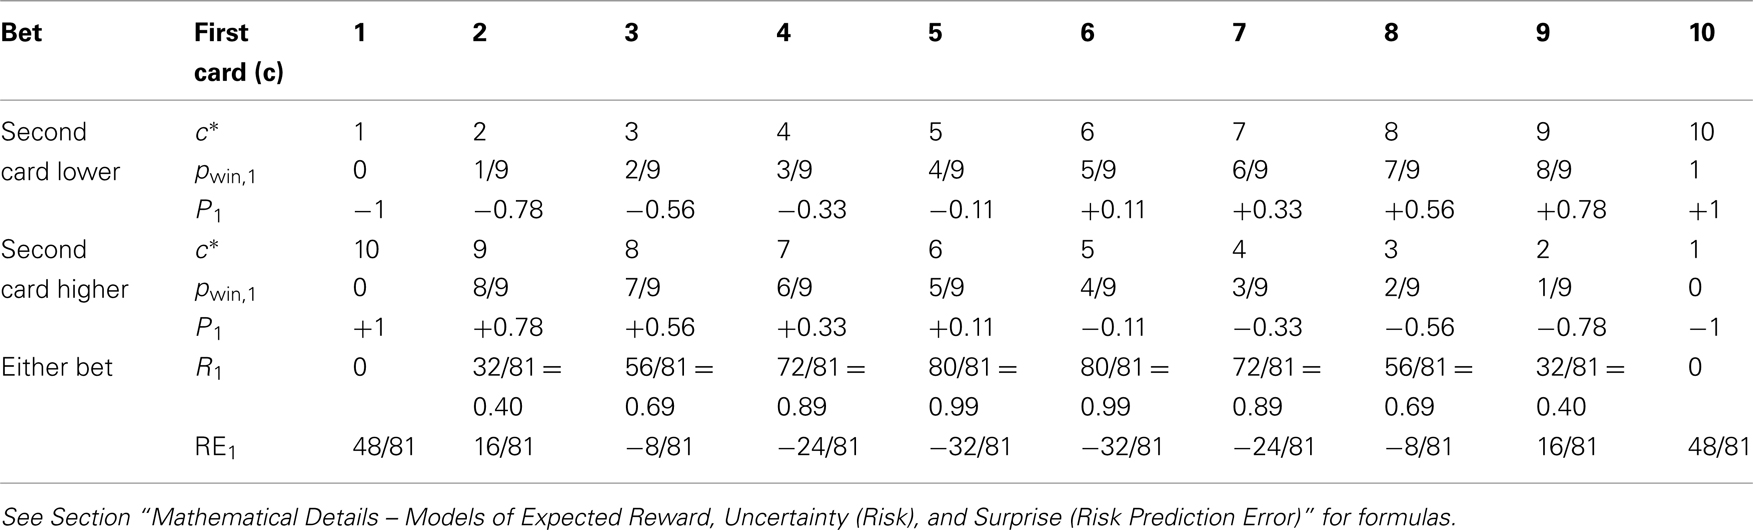
Table 1. Decision variables after the first card (units of $ and $2 are omitted).
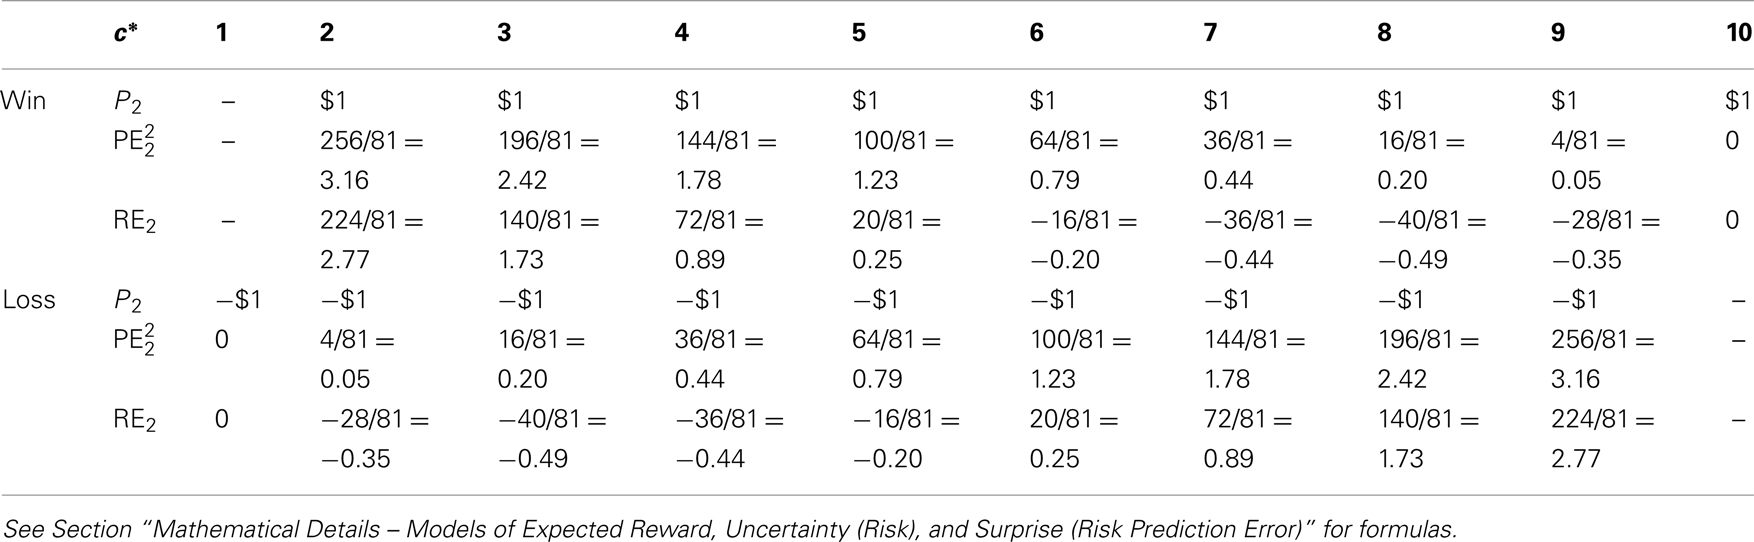
Table 2. Decision variables after the second card (units of $ and $2 are omitted); note that there is no win in case of c* = 1 (pwin = 0) and no loss in case of c* = 10 (pwin = 1).
c number of the first card
c* number of the first card adjusted for bet (c* = c if bet is “second card lower” and c* = 11 − c if bet is “second card higher”)
pwin,0 probability of winning before hearing card 1 (pwin,0 = 0.5 for all trials)
pwin,1 probability of winning after hearing card 1 (pwin,1 ∈ {0, 1/9,..., 8/9, 1})
pwin,2 probability of winning after hearing card 2 (pwin,2 ∈ {0, 1})
P0 expected reward before hearing card 1, prediction of P1, i.e., P0 = E[P1]
P1 expected reward after hearing card 1, prediction of P2, i.e., P1 = E[P2]
P2 actual reward, revealed upon display of card 2 (P2 ∈ {−$1, +$1})
PE1 reward prediction error after first card PE1 = (P1 − P0)
PE2 reward prediction error after second card PE2 = (P2 − P1)
R0 risk before hearing card 1 (R0 = E[(P1 − P0)2] = 33/81 for all trials)
R1 risk after hearing card 1 (R1 = E[(P2 − P1)2])
R2 risk after hearing card 2, R2 = 0 for all trials as outcome is known for certain
RE1 risk prediction error after hearing card 1 ( ), actual minus expected size of reward prediction error at card 1
RE2 risk prediction error after hearing card 2 ( ), actual minus expected size of reward prediction error at card 2
The values are a function of the bet placed and the cards drawn. The values for all possible constellations are given in Tables 1 and 2.
Note that reward, and absolute reward prediction error have the unit of $, whereas risk, squared reward prediction error and risk prediction error have the unit of $2. Both are omitted in tables, figures, and text for brevity.
Before hearing card 1
At t = 0, prior to the first card, the decision variables are independent of cards and choice. In particular, the probability of winning, pwin,0 = 0.5, and consequently the expected reward

Risk R0 is given by the variance (or more precisely, the second moment) of the expected reward
This is the expected size of the prediction error at card 1. There are 10 possible prediction errors that could obtain when card 1 is displayed, all of which are equally likely to occur. The risk is the same for all trials.
At hearing card 1
After the first card, the value of all variables depends on the card drawn (c*). The probability of winning and the expected reward can be expressed as
respectively.
The reward prediction error is PE1 = (P1 − P0) and thus equals the expected reward, P1.
Risk is the expectation of (P2 − P1)2 taken over P2 (which is either −1 or 1 depending on whether the subject lost or won). Risk is given as
The risk prediction error is given as
Note, that at the first card the correlation between risk and risk prediction error is −1.
At hearing card 2
Analogous computations can be made for risk prediction errors at card 2. The outcome P2 is either −1 (subject lost bet) or +1 (subject won). The risk prediction errors at card 2 are obtained by comparing the squared reward prediction error with the risk predicted before card 2 (but after card 1; Figure 4C; Table 2) and work out to
Results
Participants performed 90 trials of an auditory gambling task (Figure 1): before a sequence of two different cards (represented by numbers between 1 and 10) was drawn, participants had to bet whether the second card would be higher or lower than the first; 5 s after the bet, the first card is drawn, followed 5 s later by the second card. The experimental paradigm segregates the act of making a decision (before first card) from the availability of associated decision variables (after the first or second card). Since on each trial a fresh deck of 10 cards was used, participants started with no information on the outcome of the gamble and the outcome was independent of participants’ strategy. In each trial, before the first card, the probability of winning is 0.5 and the uncertainty is constant [refer to the section Mathematical Details – Models of Expected Reward, Uncertainty (Risk), and Surprise (Risk Prediction Error) for technical details, here and hereafter]. After the first card is drawn, participants update their estimates of the decision variables: for betting “second card lower” the probability of winning increases in the number of the first card, for betting “second card higher,” the probability decreases. Irrespective of the bet, the participant will be sure (no uncertainty) whenever the first card is a “1” or “10,” have medium uncertainty when a “2,” “3,” “8,” “9” is drawn and have high uncertainty when a “4,” “5,” “6,” or “7” is drawn. For a first qualitative view on uncertainty, we split the data according to these three levels and analyze their effect on changes in pupil dilation after the first card. A clear separation of pupil size arises quickly after the first card is drawn (Figure 2A). The less uncertainty there is about the outcome the more the pupil dilates relative to its size before drawing the first card. Significance of the difference between high and low uncertainty trials is assessed by point-wise t-tests with respect to an alpha-level adjusted for multiple testing to 0.05 expected false-discovery rate (denoted as FDR0.05). We find a significant effect from 0.77 s after the first card until the second card is drawn (p < 0.042 = FDR0.05). Peak significance (i.e., lowest p-value) is reached 1.66 s after the first card (Figure 2B). Hence, uncertainty has a quick and lasting effect on pupil dilation, which is robust across individuals (Figure 3).
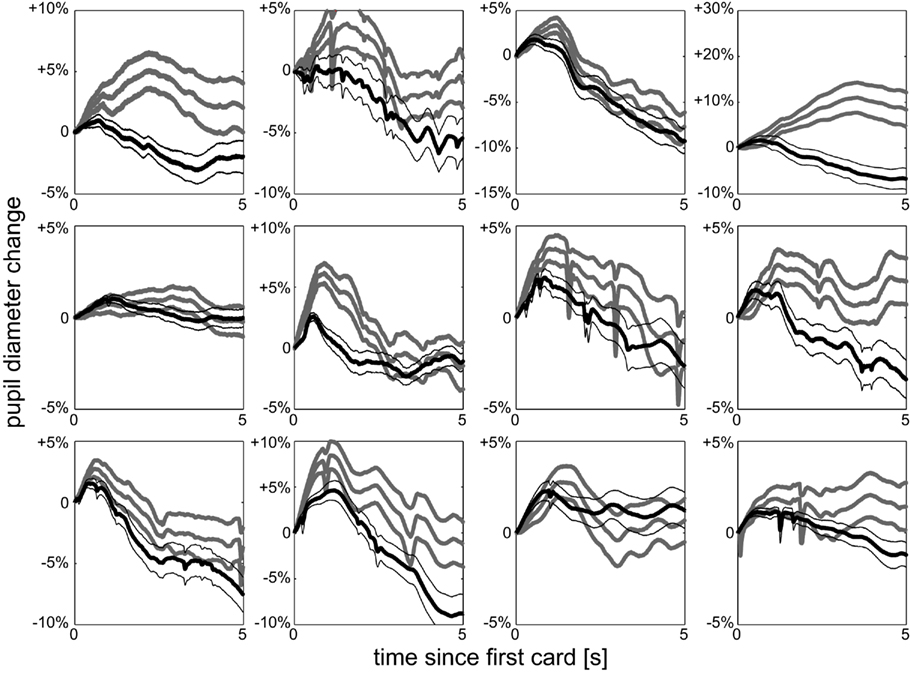
Figure 3. Individual uncertainty. Pupil dilation split according to high uncertainty (black) and low uncertainty (gray) after first card for each of the 12 individuals, mean and SEM over trials. All observers show the same qualitative behavior as the average effect shown in Figure 2A.
By splitting into three levels, the analysis was independent of any particular model of uncertainty used. The present gambling task involves risk, which neurally and behaviorally is the best studied form of uncertainty (Weber et al., 2004; Mohr et al., 2010). Risk arises in situations where outcomes are probabilistic and probabilities are known. The higher the risk, the less accurate are reward predictions; hence higher risk will lead the decision maker to expect larger and more frequent reward prediction errors.
Our formulation of risk [see Mathematical Details – Models of Expected Reward, Uncertainty (Risk), and Surprise (Risk Prediction Error)] has been successfully applied to functional imaging data (Preuschoff et al., 2008; d’Acremont et al., 2009), and readily extends to include a measure of surprise (risk prediction errors). After the first card, the probability of winning (and thus the expected reward) is linear in the first card drawn (Figure 2C, gray), while the risk is quadratic in the first card (Figure 2C, black). A coupling between pupil dilation and risk implies a quadratic relationship between pupil dilation and the first card. At the time-point of highest difference between low and high uncertainty (t = 1.66 s in Figure 2B) such a dependence is clearly visible (Figure 2D, dots). A second order polynomial provides an excellent fit of the data (Figure 2D, solid line, norm of residuals 0.015). When analyzing the temporal evolution of the effects of probability of winning and risk, respectively, we find that the effect of risk on pupil dilation increases rapidly reaching a plateau of −0.04 after about 1.6 s (Figure 2E). In contrast, the effect of probability meanders around zero. The constant offset peaks about 1 s after the first card and returns to baseline before the second card is drawn. This constant includes non-specific effects (such as arousal, novelty, etc.) that are independent of the first card’s value and thus independent of all decision variables. Although the fits are suggestive, technically, risk, reward, and offset are incommensurate, as they are measured in units of $2, $, and 1 respectively, and thus effect sizes could change based on a linear scaling of the reward. To assess the significance of the results independent of any linear scaling of the decision variables we studied the correlation between pupil dilation on the one hand and probability or risk on the other hand. This reveals a high negative correlation between risk and pupil dilation (Figure 2F, top), which is significantly different from 0 (p < FDR0.05 = 0.045) starting at t = 0.46 s till the second card is drawn (Figure 2F, bottom). No significant correlation between probability and pupil dilation is found at any point in time (r < 0.31; p > 0.17 throughout, Figure 2F). These data show that pupil dilation after the first card reflects the risk of the outcome, not the probability of winning or expectation of reward.
Pupil after the first card signals risk. Risk reflects the expectation of errors and influences how reward prediction errors are perceived: the more certain we were about the outcome – i.e., the lower our risk was – the higher will be our surprise, if our expectations are not met. Since violation of expectations necessitates updating of beliefs, surprise has been suggested as a trigger signal for learning. While surprise can be formalized in various ways, e.g., as the improbability of an event (Shannon, 1948), it generally captures the violations of our expectations beyond reward prediction error. We here quantify surprise by risk prediction error [Mathematical Details – Models of Expected Reward, Uncertainty (Risk), and Surprise (Risk Prediction Error)]. After the first card, risk prediction error is identical to the negative risk plus a constant offset. This coupling between risk and risk prediction error is a common confound in risky decision making and independent from the quantification of risk and surprise. The current paradigm allows us to dissociate the contribution of risk and risk prediction errors to pupil dilation, by analyzing the data following the draw of the second card. At this point participants know the outcome of their bet and thus experience no more risk. However, participants can either be highly surprised (e.g., if a low risk first card yields an unexpected outcome) or lowly surprised (e.g., if a low risk card yields an expected outcome). Consequently, the negative correlation between risk and risk prediction errors that is inherently present after the first card, disappears after the second card is drawn.
We again start with a qualitative view on surprise by splitting the data after the second card into high and low surprise. Surprise indeed shows an effect on pupil dilation, which is significant (p < FDR0.05 = 0.0077, Figure 4A) from 0.79 to 1.56 s (Figure 4B), and observed in all individuals (Figure 5). At the time of peak significance (t = 1.12 s) pupil dilation clearly follows the model of surprise as risk prediction error (Figures 4C,D), irrespective of whether the outcome is a win (gray) or a loss (black). The outcome itself does not differentially affect the pupil (t-tests between win and loss: p > 0.26 for all time-points). Quantitative analysis shows a significant correlation between risk prediction error and pupil dilation at t = 1.12 s (r = 0.76; p = 0.0003, Figure 4E). This significant correlation (p < 0.042 = FDR0.05) is observable early after the card (from 0.18 to 0.24 s and at 0.55 s) and persists with a short interruption (2.40–2.48 s) from 0.80 s till the participant is asked to indicate the outcome (Figure 4F). The data following the second card show that pupil dilation observed at the first and second card is related to the risk prediction error (surprise) rather than risk (expected uncertainty). Other formalizations of surprise exist in decision making (e.g., absolute reward prediction error, see Appendix, Figure 6), but are correlated to risk prediction error. Irrespective of the precise formulation, our data show a clear and robust effect of surprise.
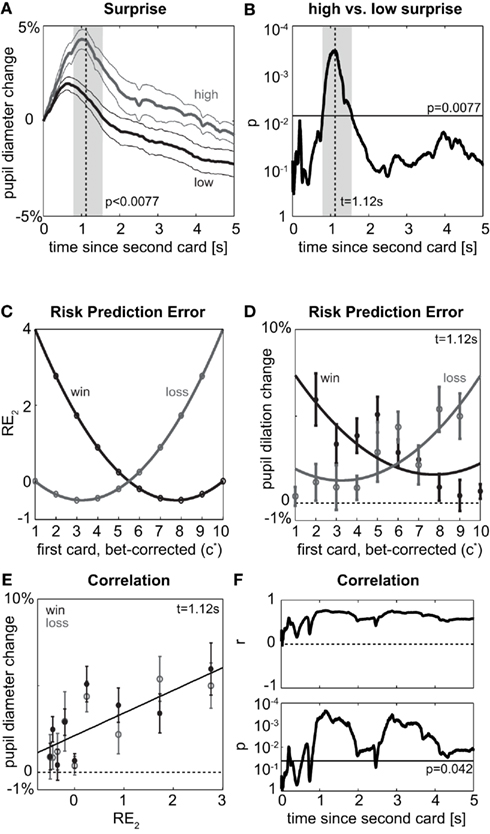
Figure 4. Second card. (A) Pupil dilation after the second card depending on whether surprise is high (gray) or low (black) after the second card. To include all data, high surprise here is defined to occur when expected reward prior to the second card was positive and the actual outcome is a loss (P1 > 0 and P2 = −$1) or when the expected reward was negative and the actual outcome is a win (P1 < 0 and P2 = +$1); conversely, if expected reward had been positive and outcome is a win (P1 > 0 and P2 = $1) or expected reward had been negative and outcome is a loss (P1 < 0 and P2 = −$1), surprise is low. Otherwise notation as in Figure 2A. (B) Significance of difference between high and low surprise according to (A). Notation as in Figure 2B. (C) Model: Risk prediction error (RE2) as measure of surprise after the draw of the second card as function of first card (c*) and actual outcome (P2: win or loss). Note that there are no data for (c* = 1, win) and for (c* = 10, loss), since c* = 1 implies pwin,1 = 0 and thus certain loss (P2 = −$1) as well as c* = 10 implies pwin,1 = 1 and thus certain win (P2 = +$1), (D) Points: Pupil dilation at peak significance of (A,B) (t = 1.12 s after second card) split by first card (c*) and outcome (P2: win or loss); mean and SEM over participants. Lines: fits of risk prediction error (RE2) according to (C). (E) Correlation of risk prediction error (RE2) as quantitative measure of surprise and pupil dilation at time point of peak significance. (F) Time course of correlation in (E) for the period after the second card. Top: correlation coefficient, bottom: probability of correlation being different from 0. Horizontal line: alpha-level for expected FDR of 5% (FDR0.05 = 0.042).
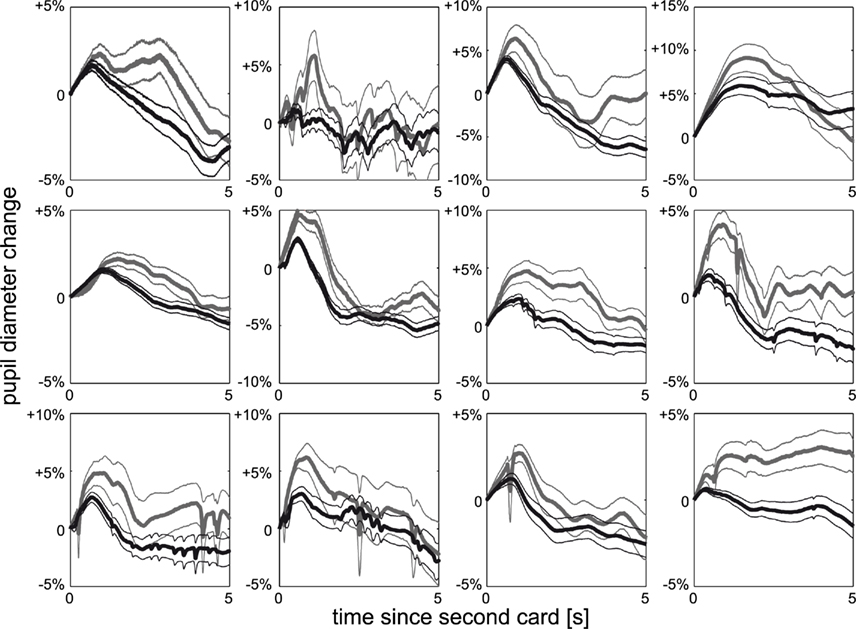
Figure 5. Individual surprise. Pupil dilation split according to high surprise (gray) and low surprise (black) after second card for each of the 12 individuals, mean and SEM over trials. All observers show the same qualitative behavior as the average effect shown in Figure 4A.
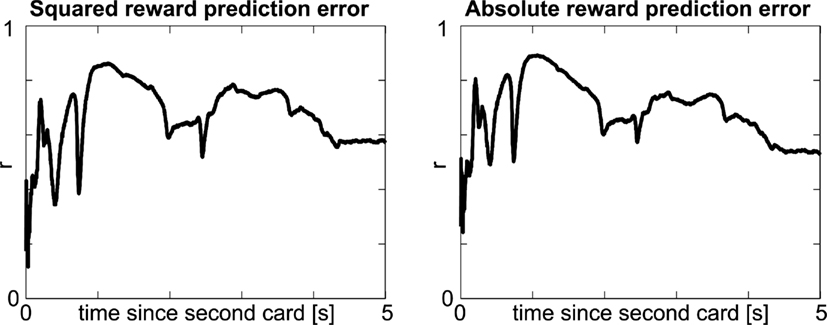
Figure 6. Alternative measures of surprise. Timecourse of correlation between other measures of surprise (left: squared reward prediction error; right: absolute reward prediction error a.k.a. salience) and pupil dilation. Notation as in top panel of Figure 4F.
Discussion
Pupil dilation serves as a cue in social interactions: wide pupils are commonly associated with attractiveness (the natural source of atropine being referred to as “bella-donna” – beautiful woman) and enhance social valence judgment in others (Harrison et al., 2006). Poker players, for instance, try to hide information by wearing sunglasses, but what information would their pupil betray? The present study is the first to dissociate specific decision variables from each other independent of the act of decision making. We demonstrate that pupil dilation reflects surprise but not expected reward.
A general effect of decision making and arousal on pupil dilation has been known since the 1960s (Bradshaw, 1967; Simpson and Hale, 1969) and recent data links the timing of dilation to the timing of the decision (Einhäuser et al., 2010). Quantitative data on the relation between specific decision variables and pupil responses has, however, remained scarce. A qualitative concept related to the notion of surprise is the well-known “probability effect” (Friedman et al., 1973): rarer stimuli evoke a larger pupil response. Similarly, violations of a temporal sequence yield increases in pupil size, whose timing is related to the violating event (Raisig et al., 2010). While both paradigms deal with an intuitive notion of surprise (oddity or sequence violations, respectively), such studies modulate the probability of an event to occur and thus by design do not aim at assessing or dissociating variables like risk and reward.
Interestingly, paradigms using the probability effect often assert that higher uncertainty is associated with more task engagement or more arousal (Friedman et al., 1973). While we do not dispute that there is an effect of such unspecific variables on pupil dilation (in fact, the constant in Figure 2E likely subsumes such variables), our paradigm keeps task engagement constant, while decision variables are varied. Complementary to our approach, recent studies indeed find that shifts between task engagement (exploitation) and disengagement (exploration) affect the pupil response (Gilzenrat et al., 2010; Jepma and Nieuwenhuis, 2011), consistent with the adaptive gain theory of LC–NA function (Aston-Jones and Cohen, 2005). The experimental design and modeling focused on choice and neither aimed at nor allowed a dissociation of decision variables, in particular of expected reward and risk. The high correlation between these two variables in their paradigm yielded Gilzenrat et al. (2010) to conjecture that pupil dilation may reflect expected reward. Notwithstanding the important contribution of this study in the context of task engagement, their conjecture on the role of expected reward is clearly rejected by our present results.
The relation of pupil diameter to uncertainty and expected reward has recently been addressed by Satterthwaite et al. (2007). However, as the authors point out, “interpretation of results … may be complicated” due to the correlation of uncertainty and reward expectation in their paradigm. It is this correlation that our paradigm eliminates and that allows us to unambiguously interpret the results in terms of expected reward and uncertainty.
The neural basis of reward-processing is well established. Research in this area has been driven by the quantitative predictions of the reward prediction error hypothesis, which was first proposed in the late 1990s (Montague et al., 1996) and has since gained a wealth of evidence (Schultz et al., 1997; Schultz, 2010). The hypothesis posits that the neurotransmitter dopamine supports reward-based learning through signaling of reward prediction errors (Schultz, 2000). Neural responses to expected reward and reward prediction errors have been identified for the dopaminergic nuclei of the brain stem as well as their projection areas such as the basal ganglia, orbitofrontal cortex, insular cortex, cerebellum and parietal cortex (Schultz, 2010). The reward prediction error hypothesis has led to sophisticated neural models that integrate these areas into a reward-processing network, allow analyzing connectivity quantitatively and provide the theoretical framework for reward-based learning.
The neurophysiological basis of uncertainty signals is less well understood. Neural responses to different forms of uncertainty (e.g., prediction risk, prediction risk errors, volatility) have been reported for the human anterior insula (Preuschoff et al., 2008; De Martino et al., 2009; d’Acremont et al., 2009), rodent orbitofrontal cortex (Kepecs et al., 2008), non-human primate parietal cortex (Kiani and Shadlen, 2009), the human striatum (Preuschoff et al., 2006), human anterior cingulate cortex (Behrens et al., 2007) as well as for the tonic dopamine response in non-human primates (Fiorillo et al., 2003). However, while theoretical frameworks have been proposed on how uncertainty could be incorporated in reward learning and how uncertainty itself could be learned (Pearce and Hall, 1980; Mihatsch and Neuneier, 2002; Yu and Dayan, 2005; Preuschoff and Bossaerts, 2007; Preuschoff et al., 2008) a systematic physiological and neural analysis for uncertainty akin to the analysis of the reward prediction error hypothesis of dopamine is lacking. By using the pupil as a peripheral physiological signal, the present study – under the assumption that pupil dilation reflects NA levels – provides experimental support for a similar risk prediction error hypothesis of NA.
Several lines of evidence converge in favor of a link between pupil dilation and NA levels (Samuels and Szabadi, 2008 for review), including anatomy (Nieuwenhuis et al., 2011 for review), pharmacology in healthy observers and patients (Koss, 1986; Phillips et al., 2000; Jepma et al., 2011), monkey electrophysiology (Rajkowski:1993]) and human imaging (Sterpenich et al., 2006, but see Astafiev et al., 2010). While for several of these lines of evidence the interpretation has remained controversial and a direct demonstration of the relation between pupil dilation and LC activity may still be lacking, taken together these data make the pupil/NA link a viable working assumption at the very least. Under this assumption, our data suggest that NA signals risk prediction error as a form of surprise, rather than other decision variables such as probability of outcomes or expected reward. Thus we provide further experimental evidence for recent theoretical models (Bouret and Sara, 2005; Dayan and Yu, 2006; Sara, 2009). Notwithstanding the influence of other cognitive factors, which the current paradigm does not differentially assess, on pupil dilation, NA in this view signals errors related to estimates of uncertainty and thus guides both behavior and learning about uncertainty. This risk prediction error hypothesis of NA parallels the reward prediction error hypothesis of dopamine. Indeed, the hypothesis that risk prediction errors can be used for learning about risk akin to learning about reward through reward prediction errors has found recent support from imaging studies (Preuschoff et al., 2008; d’Acremont et al., 2009; Tobler et al., 2009), electrophysiological data of adaptive coding (Tobler et al., 2005) as well as computational models of risk learning (Dayan and Yu, 2006; Preuschoff and Bossaerts, 2007). Notwithstanding the influence of other neuromodulators (e.g., ACh) on pupil dilation, our data thus suggest that NA may play a similar role for learning about uncertainty as dopamine does for learning about reward.
Our findings expand the current knowledge of risk perception and misperception, which holds promise for our understanding of normal and pathological decision making. In particular, risk misperception characterizes many mental illnesses, from anxiety and mood disorders (Paulus and Stein, 2006) to addiction and pathological gambling (Bechara, 2003). To date, risk perception in clinical populations is studied largely as a high-level prefrontal and insular process. However, by relating risk perception to the noradrenergic system, our results reframe risk perception as a much lower-level process, and locate it in the structure most directly implicated in arousal (Bradshaw, 1967), network reset (Bouret and Sara, 2005) and (sub)optimal performance (Aston-Jones and Cohen, 2005). The temporal relation between LC discharge and NA release to the pupillary response is as of now unknown and the time constants and response amplitudes likely depend on several factors, such as the overall illumination level and ACh levels. Nonetheless, our data together with earlier studies suggest that the earliest response happens in the range over several 10 ms. This high temporal resolution combined with the high spatial resolution of functional brain stem imaging (d’Ardenne et al., 2008) is likely to eventually provide unique insights into the link between the neural circuits of reward and uncertainty processing.
Conflict of Interest Statement
The authors declare that the research was conducted in the absence of any commercial or financial relationships that could be construed as a potential conflict of interest.
Acknowledgments
This work was supported by the German Research Foundation (DFG) grant EI 852/1 (Wolfgang Einhäuser), DFG Research Training Group 885 – “Neuroact” (Bernard Marius ’t Hart), the NCCR FINRISK (Kerstin Preuschoff), and the Neurochoice project of SystemsX.ch (Kerstin Preuschoff).
References
Astafiev, S. V., Snyder, A. Z., Shulman, G. L., and Corbetta, M. (2010). Comment on “Modafinil shifts human locus coeruleus to low-tonic, high-phasic activity during functional MRI” and “homeostatic sleep pressure and responses to sustained attention in the suprachiasmatic area.” Science 328, 309.
Aston-Jones, G., and Cohen, J. D. (2005). An integrative theory of locus coeruleus-norepinephrine function: adaptive gain and optimal performance. Annu. Rev. Neurosci. 28, 403–450.
Bechara, A. (2003). Risky business: emotion, decision-making, and addiction. J. Gambl. Stud. 19, 23–51.
Behrens, T. E., Woolrich, M. W., Walton, M. E., and Rushworth, M. F. (2007). Learning the value of information in an uncertain world. Nat. Neurosci. 10, 1214–1221.
Benjamini, Y., and Hochberg, Y. (1995). Controlling the false discovery rate: a practical and powerful approach to multiple testing. J. R. Stat. Soc. Series B Stat. Methodol. 57, 289–300.
Bouret, S., and Sara, S. J. (2005). Network reset: a simplified overarching theory of locus coeruleus noradrenaline function. Trends Neurosci. 28, 574–582.
Bradshaw, J. (1967). Pupil size as a measure of arousal during information processing. Nature 216, 515–516.
Cornelissen, F., Peters, E., and Palmer, J. (2002). The eyelink toolbox: eye tracking with MATLAB and the psychophysics toolbox. Behav. Res. Methods Instrum. Comput. 34, 613–617.
d’Acremont, M., Lu, Z. L., Li, X., van der Linden, M., and Bechara, A. (2009). Neural correlates of risk prediction error during reinforcement learning in humans. Neuroimage 47, 1929–1939.
d’Ardenne, K., McClure, S. M., Nystrom, L. E., and Cohen, J. D. (2008). BOLD responses reflecting dopaminergic signals in the human ventral tegmental area. Science 319, 1264–1267.
Dayan, P., and Yu, A. (2006). Phasic norepinephrine: a neural interrupt signal for unexpected events. Network 17, 335–350.
De Martino, B., Kumaran, D., Holt, B., and Dolan, R. J. (2009). The neurobiology of reference-dependent value computation. J. Neurosci. 29, 3833–3842.
Einhäuser, W., Koch, C., and Carter, O. L. (2010). Pupil dilation betrays the timing of decisions. Front. Hum. Neurosci. 4:18. doi: 10.3389/fnhum.2010.00018
Fiorillo, C. D., Tobler, P. N., and Schultz, W. (2003). Discrete coding of reward probability and uncertainty by dopamine neurons. Science 299, 1898–1902.
Friedman, D., Hakerem, G., Sutton, S., and Fleiss, J. L. (1973). Effect of stimulus uncertainty on the pupillary dilation response and the vertex evoked potential. Electroencephalogr. Clin. Neurophysiol. 34, 475–484.
Gilzenrat, M. S., Nieuwenhuis, S., Jepma, M., and Cohen, J. D. (2010). Pupil diameter tracks changes in control state predicted by the adaptive gain theory of locus coeruleus function. Cogn. Affect. Behav. Neurosci. 10, 252–269.
Harrison, N. A., Singer, T., Rotshtein, P., Dolan, R. J., and Critchley, H. D. (2006). Pupillary contagion: central mechanisms engaged in sadness processing. Soc. Cogn. Affect. Neurosci. 1, 5–17.
Jepma, M., Deinum, J., Asplund, C. L., Rombouts, S., Tamsma, J. T., Tjeerdema, N., Spapé, M. M., Garland, E. M., Robertson, D., Lenders, J. W. M., and Nieuwenhuis, S. (2011). Neurocognitive function in dopamine-β-hydroxylase deficiency. Neuropsychopharmacology 36, 1608–1619.
Jepma, M., and Nieuwenhuis, S. (2011). Pupil diameter predicts changes in the exploration-exploitation trade-off: evidence for the adaptive gain theory. J. Cogn. Neurosci. 23, 1587–1596.
Kepecs, A., Uchida, N., Zariwala, H. A., and Mainen, Z. F. (2008). Neural correlates, computation and behavioural impact of decision confidence. Nature 455, 227–231.
Kiani, R., and Shadlen, M. N. (2009). Representation of confidence associated with a decision by neurons in the parietal cortex. Science 324, 759–764.
Koss, M. (1986). Pupillary dilation as an index of central nervous system 2-adrenoceptor activiation. J. Pharmacol. Methods 15, 1–19.
Mihatsch, O., and Neuneier, R. (2002). Risk-sensitive reinforcement learning. Mach. Learn. 49, 267–290.
Mohr, P. N., Biele, G., and Heekeren, H. R. (2010). Neural processing of risk. J. Neurosci. 30, 6613–6619.
Montague, P. R., Dayan, P., and Sejnowski, T. J. (1996). A framework for mesencephalic dopamine systems based on predictive Hebbian learning. J. Neurosci. 16, 1936–1947.
Nieuwenhuis, S., De Geus, E. J., and Aston-Jones, G. (2011). The anatomical and functional relationship between the P3 and autonomic components of the orienting response. Psychophysiology 48, 162–175.
Pearce, J. M., and Hall, G. (1980). A model for Pavlovian learning: variations in the effectiveness of conditioned but not of unconditioned stimuli. Psychol. Rev. 87, 532–552.
Phillips, M. A., Szabadi, E., and Bradshaw, C. M. (2000). Comparison of the effects of clonidine and yohimbine on spontaneous pupillary fluctuations in healthy human volunteers. Psychopharmacology (Berl.) 150, 85–89.
Preuschoff, K., and Bossaerts, P. (2007). Adding prediction risk to the theory of reward learning. Ann. N. Y. Acad. Sci. 1104, 135–146.
Preuschoff, K., Bossaerts, P., and Quartz, S. R. (2006). Neural differentiation of expected reward and risk in human subcortical structures. Neuron 51, 381–390.
Preuschoff, K., Quartz, S. R., and Bossaerts, P. (2008). Human insula activation reflects prediction risk errors as well as risk. J. Neurosci. 8, 2745–2752.
Raisig, S., Welke, T., Hagendorf, H., and van der Meer, E. (2010). I spy with my little eye: detection of temporal violations in event sequences and the pupillary response. Int. J. Psychophysiol. 76, 1–8.
Rajkowski, J., Kubiak, P., and Aston-Jones, G. (1993). Correlations between locus coeruleus (LC) neural activity, pupil diameter and behavior in monkey support a role of LC in attention. Soc. Neurosci. Abstr. 19, 974.
Rajkowski, J., Kubiak, P., and Aston-Jones, G. (1994). Locus coeruleus activity in monkey: phasic and tonic changes are associated with altered vigilance. Brain Res. Bull. 35, 607–616.
Samuels, E. R., and Szabadi, E. (2008). Functional neuroanatomy of the noradrenergic locus coeruleus: its roles in the regulation of arousal and autonomic function part II: physiological and pharmacological manipulations and pathological alterations of locus coeruleus activity in humans. Curr. Neuropharmacol. 6, 254–285.
Sara, S. J. (2009). The locus coeruleus and noradrenergic modulation of cognition. Nat. Rev. Neurosci. 10, 211–223.
Satterthwaite, T. D., Green, L., Myerson, J., Parker, J., Ramaratnam, M., and Buckner, R. L. (2007). Dissociable but inter-related systems of cognitive control and reward during decision making: evidence from pupillometry and event-related fMRI. Neuroimage 37, 1017–1031.
Schultz, W. (2010). Dopamine signals for reward value and risk: basic and recent data. Behav. Brain Funct. 6, 24.
Schultz, W., Dayan, P., and Montague, P. R. (1997). A neural substrate of prediction and reward. Science 275, 1593–1599.
Simpson, H. M., and Hale, S. M. (1969). Pupillary changes during a decision-making task. Percept. Mot. Skills 29, 495–498.
Sterpenich, V., D’Argembeau, A., Desseilles, M., Balteau, E., Albouy, G., Vandewalle, G., Degueldre, C., Luxen, A., Collette, F., and Maquet, P. (2006). The locus ceruleus is involved in the successful retrieval of emotional memories in humans. J. Neurosci. 26, 7416–7423.
Tobler, P. N., Christopoulos, G. I., O’Doherty, J. P., Dolan, R. J., and Schultz, W. (2009). Risk-dependent reward value signal in human prefrontal cortex. Proc. Natl. Acad. Sci. U.S.A. 106, 7185–7190.
Tobler, P. N., Fiorillo, C. D., and Schultz, W. (2005). Adaptive coding of reward value by dopamine neurons. Science 307, 1642–1655.
Weber, E. U., Shafir, S., and Blais, A. R. (2004). Predicting risk sensitivity in humans and lower animals: risk as variance or coefficient of variation. Psychol. Rev. 111, 430–445.
Yoss, R. E., Moyer, N. J., and Hollenhorst, R. W. (1970). Pupil size and spontaneous pupillary waves associated with alertness, drowsiness, and sleep. Neurology 20, 545–554.
Appendix
Alternative Measures of Surprise
In the context of decision making, surprise can be quantified in a variety of ways. Besides our formalization of expected and unexpected uncertainty, measures rooted in information theory, such as (Shannon) entropy and (Shannon) surprise, are frequently employed. The former is a measure of expected uncertainty in that it captures the average expected surprise. This is analogous to our risk, which captures the average expected size of the (squared) reward prediction error. The information theoretic surprise, just as our risk prediction error, is a measure of unexpected uncertainty, and relates to a specific event, measuring how (un)expected it was with respect to the entropy. Two formalizations particularly closely related to our current formulation are absolute reward prediction error (|PE2|), sometimes also referred to as salience, and squared reward prediction error  . In the present paradigm both measures are by definition strongly correlated with risk prediction error (RE2), with correlations of 0.96 and 0.84, respectively. Hence, it comes as no surprise that both show high correlations with pupil dilation after the second card and a similar time course (Figure 6). In fact, at the time point depicted in Figure 4D, the correlation to |PE2| is slightly stronger, most likely because |PE2| – unlike RE2 – takes its minimum for the extreme values (Table 2). Distinguishing the different formalizations of surprise has not been the aim of the present paradigm, which primarily asked to dissociate expected reward from (any measure of) surprise. The conclusion that pupil dilation signals surprise, but not reward, is robust and insensitive to the precise formalization (Figures 4A and 5).
Keywords: uncertainty, noradrenaline, pupil, surprise, psychophysics, human
Citation: Preuschoff K, ’t Hart BM and Einhäuser W (2011) Pupil dilation signals surprise: evidence for noradrenaline’s role in decision making. Front. Neurosci. 5:115. doi: 10.3389/fnins.2011.00115
Received: 12 April 2011; Accepted: 11 September 2011;
Published online: 30 September 2011.
Edited by:
Tobias H. Donner, University of Amsterdam, NetherlandsReviewed by:
Angela J. Yu, University of California San Diego, USASander Nieuwenhuis, Leiden University, Netherlands
Copyright: © 2011 Preuschoff, ’t Hart and Einhäuser. This is an open-access article subject to a non-exclusive license between the authors and Frontiers Media SA, which permits use, distribution and reproduction in other forums, provided the original authors and source are credited and other Frontiers conditions are complied with.
*Correspondence: Kerstin Preuschoff, Social and Neural Systems Lab, Department of Economics, University of Zurich, Bluemlisalpstrasse 10, CH-8006 Zurich, Switzerland. e-mail: kerstin@alumni.caltech.edu