Ultra-high field magnetic resonance imaging of the basal ganglia and related structures
 Birgit R. Plantinga1,2*
  Yasin Temel2,3*
  Alard Roebroeck4
  Kâmil Uludağ4
  Dimo Ivanov4
  Mark L. Kuijf5
  Bart M. ter Haar Romenij1,6
- 1Biomedical Image Analysis, Eindhoven University of Technology, Eindhoven, Netherlands
- 2Department of Neuroscience, Maastricht University, Maastricht, Netherlands
- 3Department of Neurology, Maastricht University Medical Center, Maastricht, Netherlands
- 4Department of Neurosurgery, Maastricht University Medical Center, Maastricht, Netherlands
- 5Department of Cognitive Neuroscience, Maastricht University, Maastricht, Netherlands
- 6Department of Biomedical and Information Engineering, Northeastern University, Shenyang, China
Deep brain stimulation is a treatment for Parkinson's disease and other related disorders, involving the surgical placement of electrodes in the deeply situated basal ganglia or thalamic structures. Good clinical outcome requires accurate targeting. However, due to limited visibility of the target structures on routine clinical MR images, direct targeting of structures can be challenging. Non-clinical MR scanners with ultra-high magnetic field (7T or higher) have the potential to improve the quality of these images. This technology report provides an overview of the current possibilities of visualizing deep brain stimulation targets and their related structures with the aid of ultra-high field MRI. Reviewed studies showed improved resolution, contrast- and signal-to-noise ratios at ultra-high field. Sequences sensitive to magnetic susceptibility such as T2* and susceptibility weighted imaging and their maps in general showed the best visualization of target structures, including a separation between the subthalamic nucleus and the substantia nigra, the lamina pallidi medialis and lamina pallidi incompleta within the globus pallidus and substructures of the thalamus, including the ventral intermediate nucleus (Vim). This shows that the visibility, identification, and even subdivision of the small deep brain stimulation targets benefit from increased field strength. Although ultra-high field MR imaging is associated with increased risk of geometrical distortions, it has been shown that these distortions can be avoided or corrected to the extent where the effects are limited. The availability of ultra-high field MR scanners for humans seems to provide opportunities for a more accurate targeting for deep brain stimulation in patients with Parkinson's disease and related disorders.
Introduction
The basal ganglia are a group of nuclei deep in the brain, which play an important role in specific motor, limbic, and associative processes (Temel et al., 2005). Anatomically, they consist of the caudate nucleus-putamen (also referred to as striatum), external and internal globus pallidus (GPe and GPi, respectively), substantia nigra (SN), and the subthalamic nucleus (STN). Structural or functional impairments of basal ganglia structures can lead to neurological and psychiatric disorders, e.g., Parkinson's disease (PD) (Obeso et al., 2008), dystonia (Wichmann and Dostrovsky, 2011), Tourette's syndrome (Mink, 2006), and obsessive-compulsive disorder (Maia et al., 2008). Although most of the patients with basal ganglia diseases can be managed by drug and/or behavioral therapy, an increasing number of patients are referred to specialized teams for deep brain stimulation (DBS) (Lee et al., 2007; Ackermans et al., 2008; Limousin and Martinez-Torres, 2008; Denys et al., 2010). The main reasons for DBS referral include the proven benefit of DBS over best medical treatment (Deuschl et al., 2006; Schuepbach et al., 2013) or insufficient response to non-surgical therapies. DBS is a minimally invasive surgical procedure and involves the implantation of stimulating electrodes with millimeter precision into a specific brain target. The brain regions targeted most often are located in the basal ganglia, and include the ventral parts of the striatum (Malone et al., 2009; Denys et al., 2010), post-eroventral part of the GPi (Damier et al., 2007; Lee et al., 2007; Ackermans et al., 2008), ventral and anterior parts of the pallidum (Ackermans et al., 2008), the STN (Follett and Torres-Russotto, 2012), and surrounding structures such as the ventrolateral and anterior parts of the thalamus (Fisher et al., 2010).
Currently, there are three methods to locate the target for DBS: (a) using intraoperative neurophysiological mapping tools, (b) using stereotactic coordinates derived from post-mortem or magnetic resonance imaging (MRI) based atlases (indirect targeting), and (c) via direct visualization on individual magnetic resonance (MR) images (direct targeting). Combinations of these methods are generally used. Direct targeting has the advantage over indirect targeting in that it accounts for differences in individual anatomy, which is especially critical when small structures such as those in DBS are targeted. However, at standard clinical magnetic field strengths (1.5T and 3T) direct visualization often lacks contrast for very high precision DBS targeting. The increasing availability of ultra-high magnetic field (7T or higher) MR scanners promises direct, accurate visualization of target regions with a very high specificity. A better understanding of the structural and functional components of the basal ganglia and related structures at ultra-high resolution approaching the microscopic level, is not only expected to increase the accuracy of DBS, shorten surgery, and potentially improve the clinical outcomes (Yokoyama et al., 2006; Wodarg et al., 2012), but also to enhance our understanding of brain function and disease states. In this technology report, we present the current options for detailed visualization of deep-brain structures using multiple MRI contrasts at ultra-high magnetic field, based on a literature review.
English-language studies were searched on PubMed using combinations of title and abstract key words related to basal ganglia, thalamus, and ultra-high field MRI. Publications were selected by screening of titles and abstracts. Additional studies were found through the references cited in the selected articles.
In this technology report, anatomical structures are denoted in English, unless their Latin names are commonly used. In the first sections, we provide background information on the basic concepts of MRI, which we consider important to understand the different image types that can be obtained, and on the conventional methods of MR imaging of the basal ganglia. Subsequently, we review the current literature on in vivo and ex vivo (i.e., post-mortem) ultra-high field imaging of the basal ganglia and related structures.
Summary of the Principles of Magnetic Resonance Imaging
Whether and how well a certain brain structure is visible on an MR image depends on biophysical tissue parameters and MRI acquisition protocols (see Table 1).
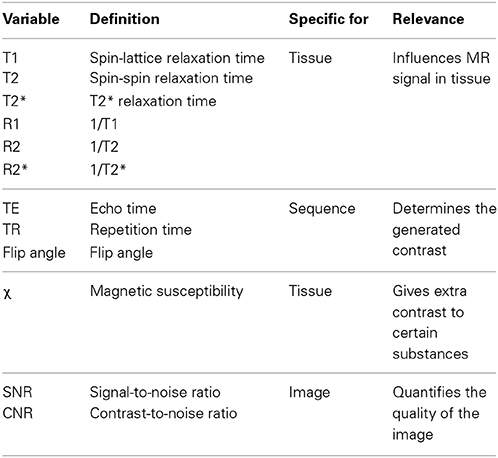
Table 1. Important concepts in MR imaging.
The relaxation times, T1, T2, and T2*, are time constants that describe magnetic spin interaction properties of nuclei, which depend, among other things, on the molecular composition and organization of the tissue and the strength of the main magnetic field. Often, the relaxation rates R1, R2, and R2* are used, defined as 1/T1, 1/T2, and 1/T2* respectively. MRI uses the dependencies of these relaxation times on tissue properties to generate contrast within an image.
The actual type of contrast is determined by the MRI pulse sequence that is used, such as spin-echo (SE) and gradient echo (GE) sequences. These MRI contrasts are sensitive to different biophysical properties of the tissue and it is a matter of intense research to quantitatively relate tissue composition and MRI contrasts. Thus, individual and combinations of MRI contrasts provide a window to examine microstructural properties of brain tissue. The different sequences are described by the combination of the properties of the gradient, radio-frequency pulses and timing parameters. Properties that are often varied are the echo time (TE), repetition time (TR), and flip angle. This can result in T1-, T2- or T2*-weighted images in which the contrast is mainly caused by differences in T1, T2, or T2* values of the tissue. The variability in sequences therefore facilitates optimization of the protocol for each structure of interest individually.
Susceptibility Weighted Imaging
Susceptibility-weighted (SW) images can also be acquired (Haacke and Reichenbach, 2011). These images are based on the principle that MR images are generally complex-valued, i.e., effectively two images are always acquired: a commonly used magnitude image that often directly displays the anatomical structures and a phase image that is usually disregarded. The phase image however is sensitive to the so-called magnetic susceptibility (χ). This property of tissues and substances alters the local magnetic field values. Paramagnetic materials have a positive χ and strengthen the magnetic field, and diamagnetic materials have a negative χ and weaken the magnetic field. Tissues with a susceptibility that differs from their surrounding structures, such as tissues with myelin and iron-containing substances, cause local deviations in the magnetic field inside and outside of the structures. This leads to local phase differences, which can then be extracted from the original phase images. In susceptibility-weighted imaging (SWI), these phase images are combined with the magnitude images, which can result in additional contrast, which particularly enhances the brain's (micro)vessels and the small deep brain structures.
Quantitative Maps
Furthermore, post-processing techniques can be employed, to produce so-called T1, T2, T2*, or (quantitative) susceptibility maps, which display the quantitative T1, T2, T2*, or susceptibility values of each voxel in an image respectively. Sometimes R1-, R2- or R2*-values are computed instead, which are defined as 1/T1, 1/T2, and 1/T2* respectively.
Other Techniques
In addition to structural imaging, diffusion-weighted imaging (DWI), which is directionally sensitive to water diffusion, gives complementary information (Le Bihan, 2003). It can provide information on the location and orientation of neuronal fibers, aiding in visualization of these pathways (tractography) (Mori et al., 1999) or super-resolution track-density imaging (TDI) (Calamante et al., 2010). Furthermore, functional MRI (fMRI) can provide information on localized brain activity (Buxton, 2013). Finally, DWI and fMRI can be used to compute the connectivity between two areas by computing the fiber paths between them (structural connectivity) or the correlation of functional activity (functional connectivity) respectively.
Field Strength
In most DBS centers, the MR images are obtained from 1.5T or 3T MR scanners. However, in specialized neuroimaging centers, the possibilities of scanning at ultra-high field are increasingly being explored (Duyn, 2012). Although the number keeps growing, at present an estimate of 61 human ultra-high field MR scanners has been installed or will be installed in the near future (see Table 2). At ultra-high field alterations of physical properties can influence measurements both positively and negatively. Several issues including field strength dependent changes in relaxation times T1, T2, and T2*; increased B0 and B1 magnetic field inhomogeneities; and increased risks of tissue heating (Duyn, 2012) make ultra-high field scanning more sensitive to inhomogeneous signal-to-noise ratios (SNR) and contrast-to-noise ratios (CNR), geometric distortions, and movement artifacts. This limits the use of T1-weighted, T2-weighted, and proton density weighted turbo spin echo (TSE) scan protocols that are commonly used in clinics (Hennig et al., 1986). However, the alterations in relaxation times and the increased sensitivity to magnetic susceptibility have stimulated the focus of ultra-high field imaging to shift to susceptibility and T2*-dependent gradient echo sequences (Haase et al., 2011). Furthermore, the SNR increases close to linearly with field strength, which offers the option to scan with higher spatial resolution (Vaughan et al., 2001) and/or CNR in a shorter time (Duyn, 2012). This makes ultra-high field MRI especially beneficial for detailed imaging of structures with altered magnetic susceptibility, such as the basal ganglia, myelin, and blood, which is also important for ultra-high field high-resolution fMRI imaging. Finally, side effects might occur during movement through the gradients of the strong field. The majority of the subjects have been reported to feel sensations when moving into or out of the bore, which was rated as unpleasant vertigo in 5–20% of the subjects (Glover et al., 2007; Theysohn et al., 2008) and a small number of subjects (approximately 3%) experienced a medium or strong metallic taste (Theysohn et al., 2008).
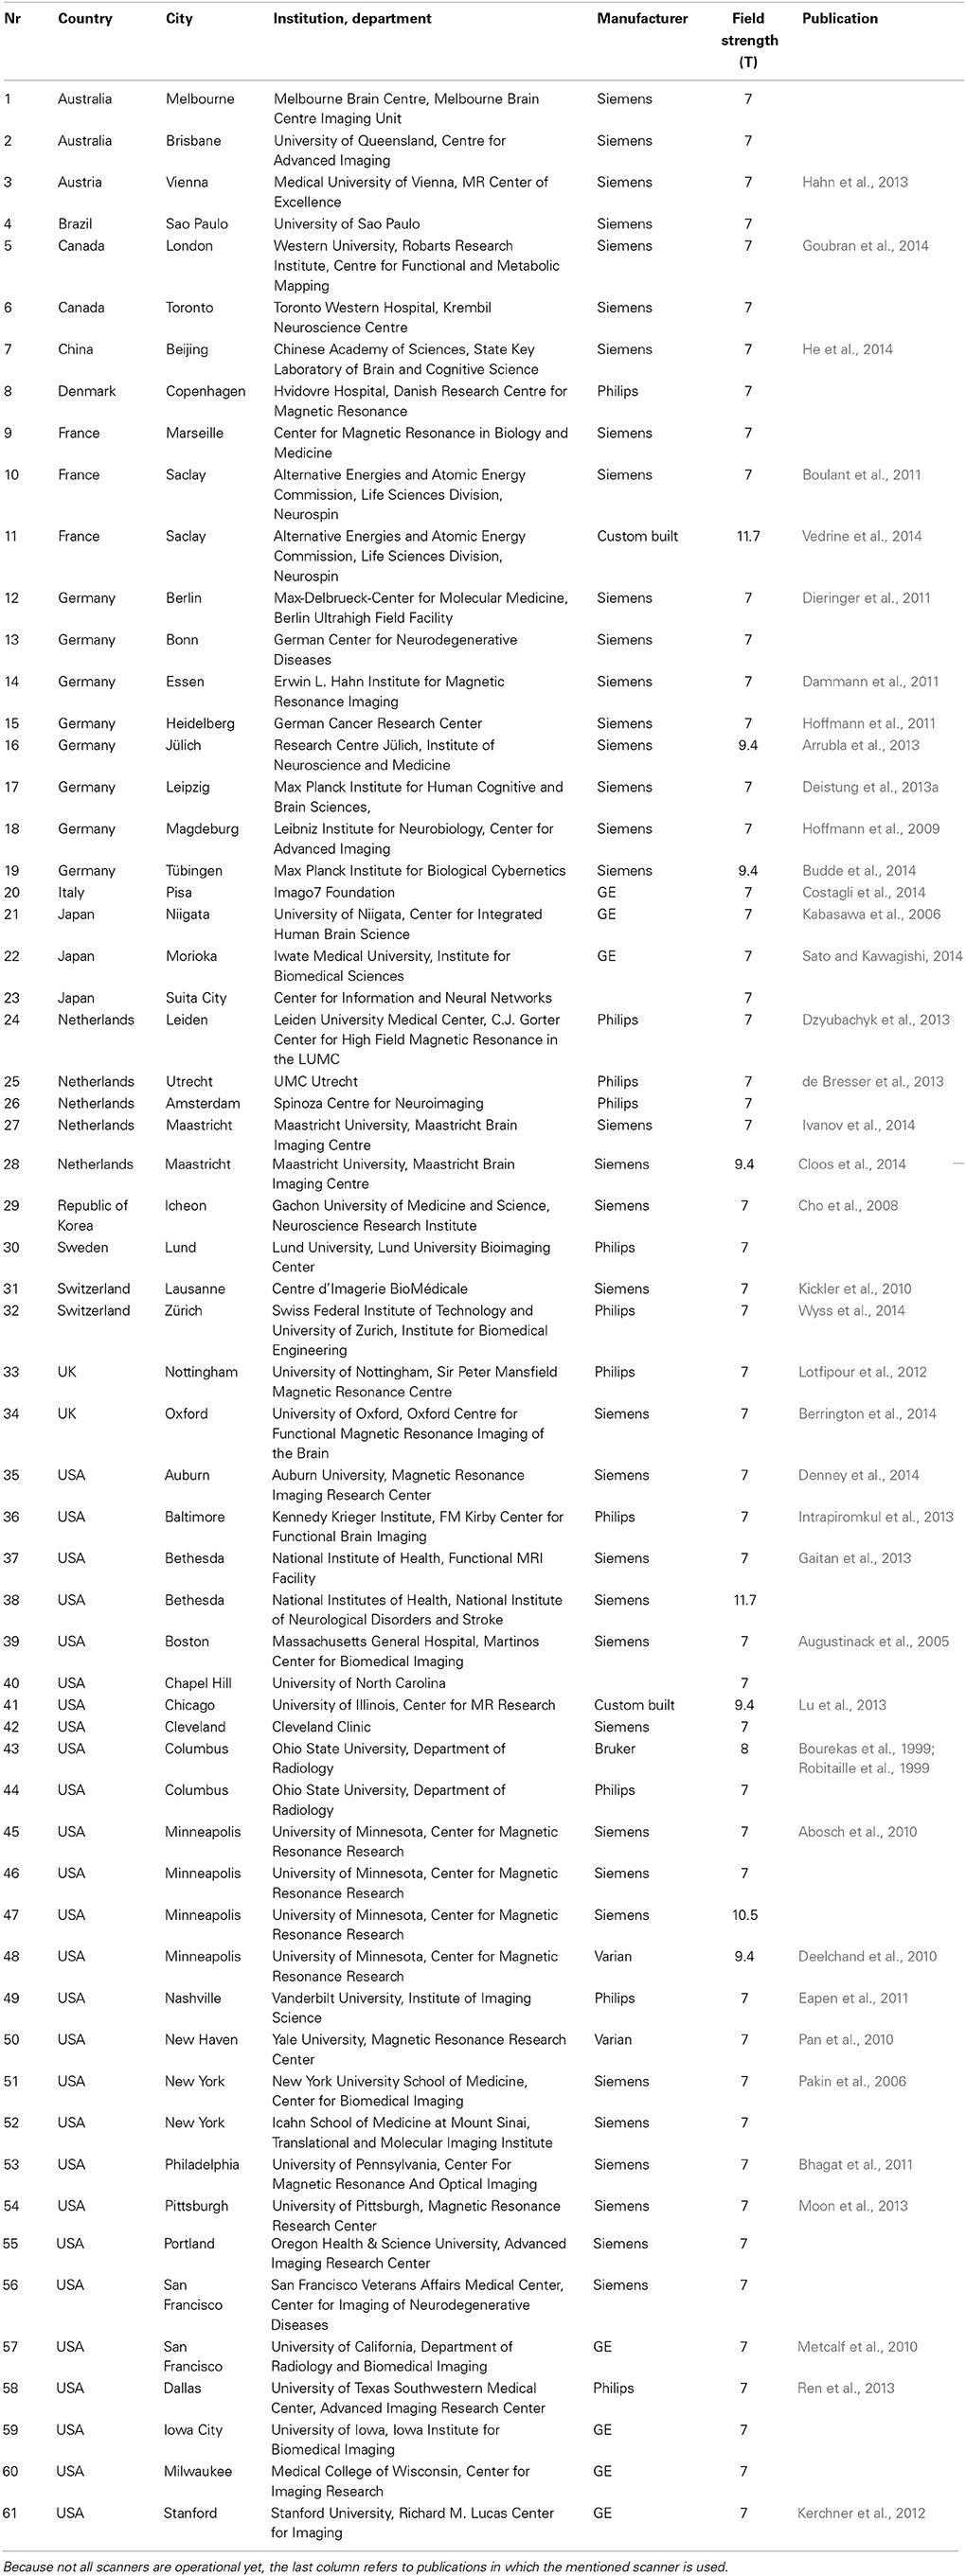
Table 2. Overview of ultra-high magnetic field (7T or higher) human MR scanners that have been installed or will be installed in the future according to the institutions' websites.
MRI of DBS Targets at Clinical Field Strengths of 1.5T and 3T
Direct visualization and targeting of DBS structures based on 1.5T or 3T MR images obtained in clinical practice can be challenging. Several studies compared different scanning sequences for the visibility of the STN (Kerl et al., 2012a; Liu et al., 2013), GPi (Nolte et al., 2012; Liu et al., 2013), GPe (Nolte et al., 2012), and zona incerta (ZI) (Kerl et al., 2012b) and showed that T2* (Kerl et al., 2012a,c; Nolte et al., 2012) and quantitative susceptibility maps (Liu et al., 2013) outperformed T1- and T2-weighted images. Furthermore, 3T functional and structural connectivity maps have been measured in healthy volunteers to visualize the functional subdivision of the STN, although higher spatial resolution is expected to reveal a more detailed anatomy (Brunenberg et al., 2012). Also, a literature review concluded that there is no consensus whether 1.5T and 3T MRI are reliable and accurate enough to be employed for direct targeting of the STN, due to serious shortcomings in the contrast between the STN and surrounding structures (Brunenberg et al., 2011). Visualization of the small substructures in the thalamus at lower field strengths is even less straightforward, primarily due to lack of contrast. One study identified four large thalamic nuclei groups on 3T magnetization-prepared rapid acquisition of gradient echo (MPRAGE) images (Bender et al., 2011) and another study identified the centromedian nucleus directly on 3T proton density weighted MR images (Kanowski et al., 2010). The thalamus was also segmented at 1.5T and 3T using DWI (Wiegell et al., 2003; Unrath et al., 2008; Pouratian et al., 2011; Mang et al., 2012) or a combination of ten different sequences (Yovel and Assaf, 2007).
Although several sequences have been investigated for the visualization of basal ganglia structures at clinical field strengths, DBS structures such as the motor part of the STN, and certain regions within the thalamus, such as the ventrolateral nuclei, need to be displayed more distinctively in order to rely on these images solely for targeting.
Ultra-high Field Imaging of the Deep-brain Structures
Several studies identified deep-brain (sub)structures at ultra-high field using different MRI contrasts. These studies, reviewed below, show the high potential of ultra-high field MRI to accurately identify and delineate thalamic, parathalamic and subthalamic nuclei. Table 3 shows detailed scanning parameters of the described studies, referred to by line numbers.
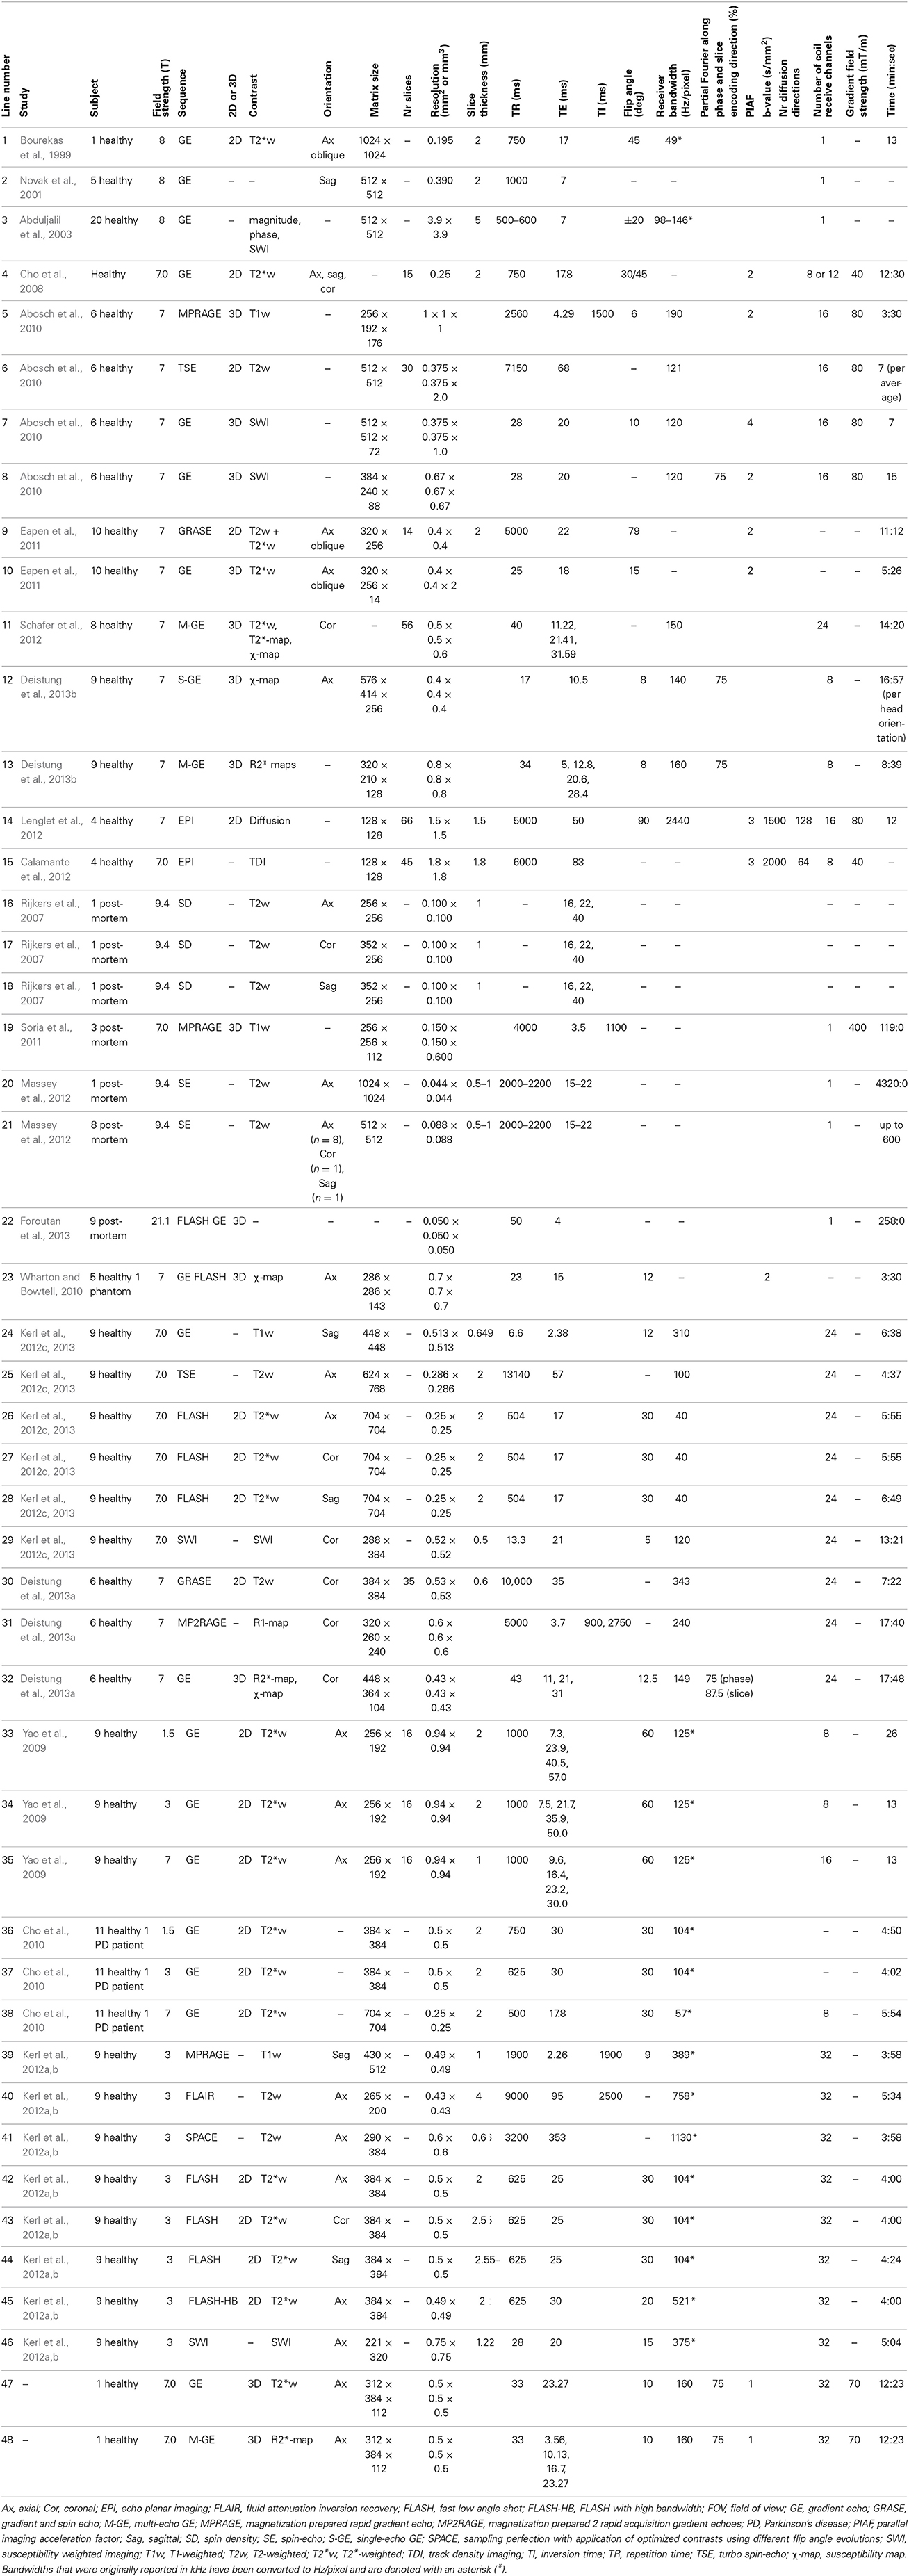
Table 3. Overview of acquisition parameters used in the described studies.
Visualization of Deep-brain Structures at Ultra-high Field in vivo
Since the installation of the first ultra-high field MR scanner, several studies investigated the visualization of deep-brain structures at ultra-high field in vivo (Table 4).
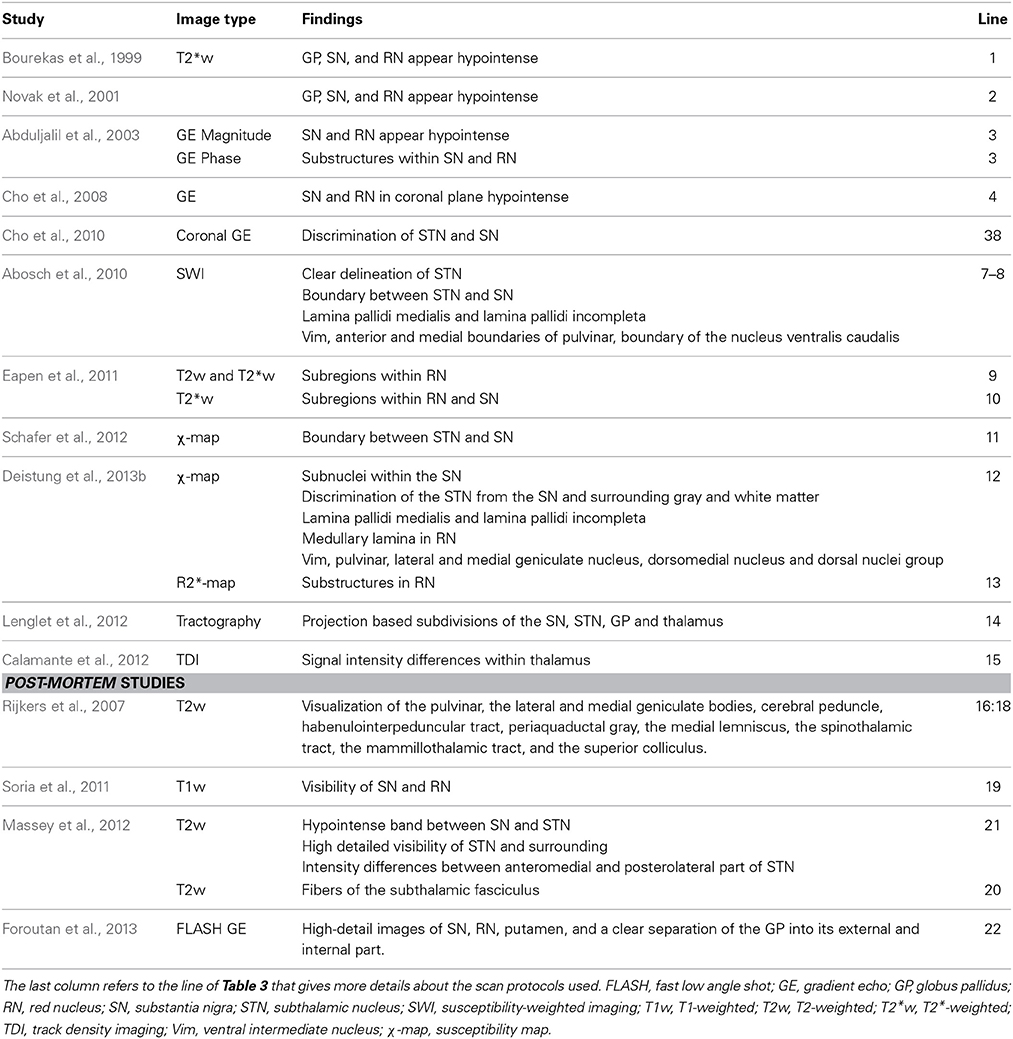
Table 4. Overview of the basal ganglia and related (sub)structures that have been identified using different protocols at ultra-high field MRI.
In 1999, the basal ganglia were visualized at ultra-high field (8T) using a two-dimensional (2D) multi-slice GE sequence, where high-resolution (195 × 195 μm in-plane) T2*-weighted axial images of one volunteer were obtained in 13 min (Table 3-1) (Bourekas et al., 1999). On these images the globus pallidus (GP), SN and red nucleus (RN) appeared as hypointense regions. These findings were later confirmed in sagittally recorded slices with similar acquisition parameters (Table 3-2) (Novak et al., 2001). In 2003, the same group showed that on GE phase images (Table 3-3), within the SN, the SN pars dorsalis and SN pars lateralis had a higher signal intensity than the matrix of the SN, and within the RN, the medullary lamella showed a higher signal intensity than the RN pars oralis (Abduljalil et al., 2003). A few years later, again the SN and RN appeared hypointense on 7T axial, sagittal, and coronal GE images (Table 3-4) (Cho et al., 2008) and in 2010, 7T coronal GE images (Table 3-38) were obtained on which the STN and SN could be well distinguished (Cho et al., 2010).
A more detailed description of the visualization of the basal ganglia at 7T with three different scanning sequences, exploiting T1-weighted, T2-weighted and susceptibility-weighted imaging, was published in 2010 (Table 3-5:8) (Abosch et al., 2010). Using SWI, a clear delineation of the STN and the boundary dividing it from the SN were visualized in both axial and coronal planes (Figure 1A). Also, SWI allowed visualization of varying levels of contrast within the RN and two of the laminae within the GP (lamina pallidi medialis and incompleta), thus also distinguishing between the GPi and the GPe. Within the thalamus, it showed intensity variations corresponding to the locations of the ventral intermediate nucleus (Vim), the anterior and medial boundaries of the pulvinar, and the boundary of the nucleus ventralis caudalis as identified with the Schaltenbrand and Wahren atlas (Schaltenbrand et al., 1977).
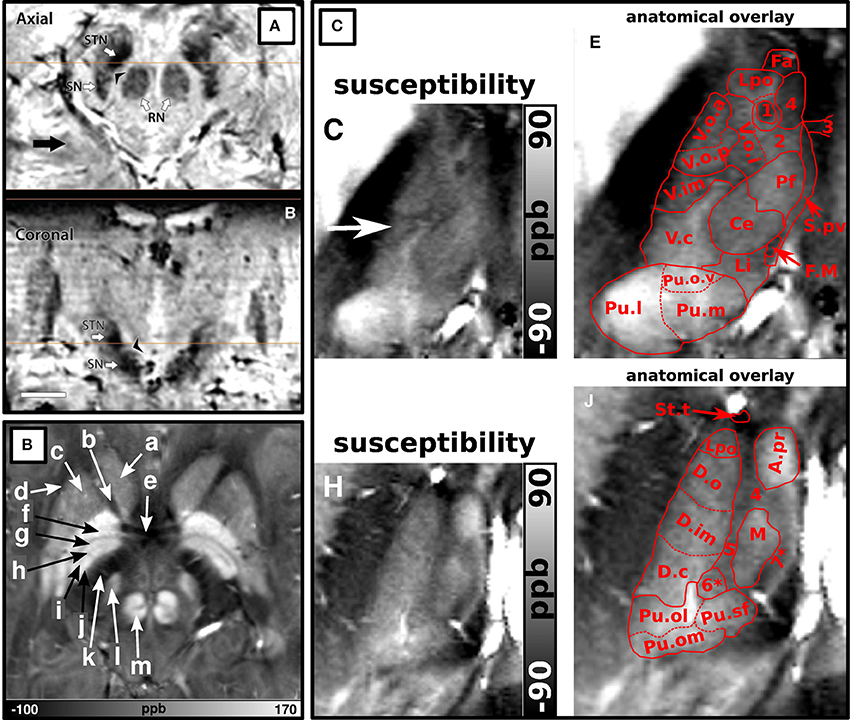
Figure 1. Examples of structures identified at ultra-high field. (A) Adopted with permission from Abosch et al. (2010). Ultra-high field (7T) susceptibility-weighted axial and coronal images show a clearly delineated subthalamic nucleus (STN), a boundary between the STN and substantia nigra, and heterogeneous signal intensity in the red nucleus. (B) Adopted with permission from Deistung et al. (2013b). Axial 7T susceptibility map displaying (a) the head of the caudate nucleus, (b) anterior limb of the internal capsule, (c) putamen, (d) external capsule, (e) anterior commissure, (f) external globus pallidus, (g) lamina pallidi medialis, (h) pallidum mediale externum, (i) lamina pallidi incompleta, (j) pallidum mediale internum, (k) posterior limb of internal capsule, (l) subthalamic nucleus, and (m) red nucleus. (C) Adopted with permission from Deistung et al. (2013b). Ultra-high field (7T) susceptibility maps of inferior (C,E) and superior (H,J) sections of the thalamus. (E,J) show overlays of substructures of the thalamus according to the Schaltenbrand et al. (1977) on the images shown in (C,H) respectively. The pulvinar (Pu.l) can be distinguished from (C,E) and the dorsomedial nucleus (M) and dorsal nuclei group (D.o and D.im) can be seen in (H,J).
In 2011, Eapen et al., imaged several deep-brain structures with two different sequences at 7T: T2- and T2*-weighted gradient and spin-echo (GRASE) and T2*-weighted GE (Table 3-9:10) (Eapen et al., 2011). Both GRASE and GE scans showed a clear distinction between the densely and the poorly vascularized regions of the RN, but only the GE scan also showed signal intensity differences within the SN, possibly representing the SN pars compacta and SN pars reticulata. In two later studies, susceptibility maps were investigated. Using a multi-echo GE sequence (Table 3-11), a boundary between the STN and the SN was shown (Schafer et al., 2012). The use of susceptibility maps generated from three single-echo GE phase data sets with different head positions (Table 3-12) also facilitated detailed visualization of structures (Deistung et al., 2013b). It provided discrimination between the subnuclei within the SN, and allowed for accurate discrimination of the STN from the SN and surrounding gray matter and white matter. Furthermore, within the GP, these maps showed the lamina pallidi medialis and lamina pallidi incompleta (Figure 1B). The RN displayed substructures in the susceptibility maps, facilitating identification of the medullary lamella, and the RN pars oralis and RN pars dorsomedialis showed a significantly increased susceptibility, compared to the RN pars caudalis. Finally, within the thalamus clear intensity variations were observed on these susceptibility maps corresponding to the Vim, pulvinar, lateral and medial geniculate nucleus, dorsomedial nucleus, and dorsal nuclei group as identified with the Schaltenbrand and Wahren atlas (Schaltenbrand et al., 1977) (Figure 1C).
In two other studies by Kerl et al., investigating the STN and ZI with different sequences at 7T (Kerl et al., 2012c, 2013), a distinction between the STN and the SN and ZI and a clear boundary dividing the rostral ZI from the internal capsule, STN and the pallidofugal fibers could be seen on T2*-weighted images and the latter also on coronal SW images.
Finally, two studies employed DWI properties to identify substructures within the DBS related structures. In one study, DWI (Table 3-14) was used to estimate the pathways between seven regions of interest: caudate nucleus, putamen, GPe, GPi, SN, STN, and thalamus (Lenglet et al., 2012). Seven pathways could be successfully identified: the nigrostriatal, nigropallidal, nigrothalamic, subthalamopallidal, pallidothalamic, striatopallidal, and thalamostriatal pathway. These projections were also used to create subparcellations of the SN, possibly corresponding to the SN pars reticulata and SN pars compacta; subdivisions of the STN into a dorsolateral and ventromedial part; subdivisions of the GPe into medial, lateral and rostro-ventral parts; subdivisions of the GPi into laterocaudal, rostral, and mid portions; and many subdivisions within the thalamus. In another study, 7T DWI (Table 3-15) was used to construct track-density images of the thalamus (Calamante et al., 2012). These showed high-resolution (200 μm isotropic) substructures within the thalamus with clear intensity differences, not only related to track-density, but also to the directionality of the fibers.
Visualization of Deep-brain Structures at Ultra-high Field ex vivo
When scanning ex vivo, even higher resolution and higher SNR can be obtained due to the possibility of longer scan times and less movement artifacts. Although fixed tissue may suffer from altered tissue properties, such as decreases in T1 and T2 (Tovi and Ericsson, 1992) and a decreased diffusion coefficient (D'Arceuil et al., 2007), which is especially challenging for DWI, it also has great advantages over in vivo MRI. Several studies employed ex-vivo imaging for investigating the deep-brain structures at ultra-high field (Table 4).
In 2007, the STN and its surroundings were explored at 9.4T with a T2-weighted sequence (Table 3-16:18) in a post-mortem brain sample (Rijkers et al., 2007). Acquiring a high in-plane resolution of 100 × 100 μm, not only the most prominent structures of the basal ganglia were visualized, but also the pulvinar, the lateral and medial geniculate bodies, cerebral peduncle, habenulointerpeduncular tract (fasciculus retroflexus), periaquaductal gray, the medial lemniscus, the spinothalamic tract, the mammillothalamic tract, and the superior colliculus.
Three post-mortem brain stems have also been imaged at 7T for 119 min, acquiring 150 × 150 μm images. On these T1-weighted images (Table 3-19), the RN and SN, which displayed heterogeneous signal intensity, could be visualized (Soria et al., 2011). Even higher in-plane resolutions of 44 × 44 and 88 × 88 μm (Table 3-20:21) were achieved in a different study after scanning post-mortem brain samples for 72 and 10 h respectively (Massey et al., 2012). The obtained T2-weighted images facilitated visualization of the STN, SN, RN, ZI, and thalamus but also allowed a highly detailed identification of many smaller structures surrounding the STN. Furthermore, a hypointense signal band was seen between the SN and STN facilitating easy separation of the two structures. Also the anteromedial part of the STN was relatively hypointense compared to the posterolateral portion, which might be related to the subdivision of the STN in a limbic, associative and sensorimotor part. On the 44 × 44 μm resolution images even the fibers of the subthalamic fasciculus were visualized accurately.
Finally, one study that focused on differences in T2 and T2* values and iron content between post-mortem brains of progressive supranuclear palsy patients and controls, showed high-resolution (50 μm isotropic) fast low-angle shot (FLASH) GE images (Table 3-22), displaying with much detail the SN, RN, putamen, and the GP with a clear separation into the GPe and GPi (Foroutan et al., 2013).
These studies show that ultra-high field MRI can aid substantially in the identification of small (sub)structures including the separation between the STN and SN and the laminae within the GP both ex vivo and in vivo.
Comparison Between Sequences for Ultra-high Field Imaging
In addition to the qualitative description of the visibility of deep-brain structures with ultra-high field MRI, comparisons between different sequences and image reconstruction methods have been made (see Table 5).
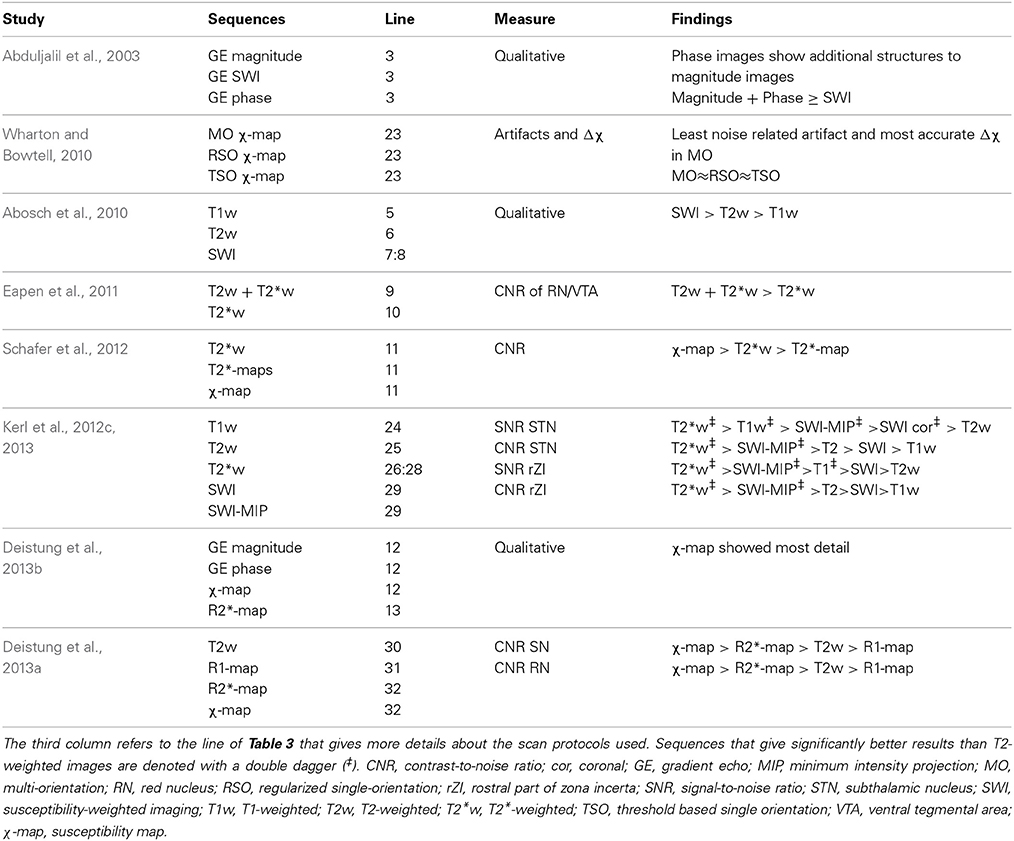
Table 5. Overview of comparative studies at ultra-high field.
In a previously mentioned study from 2003, magnitude, phase-weighted magnitude (SWI), and phase images of a GE dataset (Table 3-3), were compared for their capability to visualize (sub)structures (Abduljalil et al., 2003). On magnitude images the SN and RN showed up hypointense and on phase images, substructures within the SN could be distinguished as well. The combined magnitude and phase images added little extra to the magnitude and phase images separately.
Later, in 2010, the mean susceptibility difference (Δχ) between compartments in an agar phantom, and between white matter and deep-brain structures of healthy subjects were compared among three different susceptibility mapping methods applied to GE FLASH images acquired at 7T (Table 3-23) (Wharton and Bowtell, 2010). The mapping methods consisted of (a) a multi-orientation method using images acquired with differing head positions, (b) a regularized single-orientation method, and (c) a threshold-based single-orientation method. Although all three methods showed large Δχ in the GP, SN, RN, internal capsule, putamen and caudate nucleus, the multi-orientation method resulted in the least noise related artifacts and good estimation of Δχ values in the phantom.
In another 2010 study, T1-weighted, T2-weighted, and SW imaging (Table 3-5:8) were compared (Abosch et al., 2010). Most structures were identified in the SW images (see Table 4), followed by the T2-weighted images (Figure 2). The T1-weighted images showed no obvious structures. Eapen et al., also quantitatively compared their T2 + T2*- and T2*-weighted images (Table 3-9:10) (Eapen et al., 2011). No difference between both sequences could be found in the CNR between the SN and ventral tegmental area (VTA) and between the SN and RN, but in the T2 + T2*-weighted images, the CNR between RN and VTA was significantly better than in the T2*-weighted images.
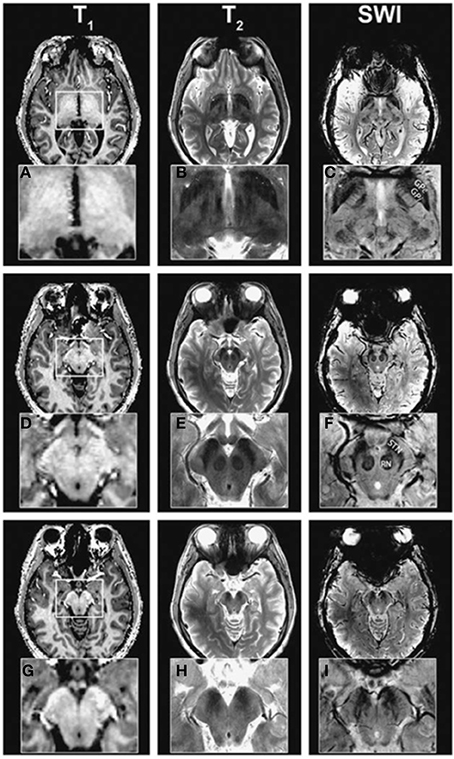
Figure 2. Ultra-high field (7T) T1-weighted (A,D,G), T2-weighted (B,E,H), and susceptibility-weighted (C,F,I) images at different levels. Adopted with permission from Abosch et al. (2010). The susceptibility-weighted images show the highest detail followed by the T2-weighted images.
In 2012, again differently reconstructed images derived from a multi-echo GE sequence (Table 3-11) were compared, consisting of T2*-weighted magnitude images, T2*-maps, and susceptibility maps (Schafer et al., 2012). In most subjects, the CNR between the SN and STN was highest in the susceptibility maps, suggesting that these are most suitable for differentiating the STN from the SN. The SNR of the STN and the rostral part of the ZI (rZI) and the CNR between these structures and white matter, imaged with different sequences, were investigated in two recent studies that compared T1-weighted GE, T2-weighted TSE, T2*-weighted FLASH and SW images (Table 3-24:29) (Kerl et al., 2012c, 2013). Furthermore, minimum intensity projections (MIPs) of the SW images were computed. After adjusting the SNR and CNR for differences in voxel size, they were highest on the T2*-weighted images for both structures. Furthermore, the SNRs of both structures on the T2*-weighted, T1-weighted, SWI-MIP (and for the STN also on the coronal SW images) were significantly higher than those of the T2-weighted images. The CNRs of both structures on the T2*-weighted and for the rZI also on the SWI-MIP images were also significantly higher than on the T2-weighted images. Also, a 2013 study compared image reconstruction techniques at 7T consisting of (a) magnitude, (b) frequency, and (c) susceptibility maps derived from GE scans (Table 3-12), and (d) R*2 maps derived from multi-echo GE scans (Table 3-13) (Deistung et al., 2013b). Qualitative analysis by a neuroanatomist revealed that susceptibility maps in general facilitated the most detailed visualization of structures. Finally, in a recent study by the same group, the CNR between several brain stem structures and their surroundings were compared between sequences (Table 3-30:32) (Deistung et al., 2013a). For the RN and the SN, the CNR of the R2*-map and the susceptibility map outperformed those of the R1-map and the T2-weighted image.
Although comparison between studies is difficult due to the differences in scanning conditions, the majority of these studies show that sequences that are sensitive to magnetic susceptibility such as SWI and T2* related images are most suitable for targeting basal ganglia structures and their subdivisions in DBS at ultra-high field.
Comparison Between Field Strengths
In addition to comparisons between different sequences, some studies compared similar sequences between different field strengths (see Table 6). In a 2008 study, the difference between a 7T GE image (Table 3-4) and a 1.5 T image was briefly treated (Cho et al., 2008). Visual inspection showed that the 7T image displayed better contrast, SNR and resolution. However, comparison is difficult because the acquisition parameters of the 1.5T image were unfortunately not provided. In the same year, T2*-weighted GE images were investigated, acquired at several echo times at three different field strengths: 1.5T, 3T, and 7T (Table 3-33:35) (Yao et al., 2009). This showed that increasing field strength resulted in a higher influence of iron on the value of R2*, making this contrast useful for iron-rich deep-brain structures, such as the GP, RN, SN, and putamen (Hallgren and Sourander, 1958). A thorough quantitative investigation of the visibility of the STN related to field strength was performed in 2010 (Cho et al., 2010), comparing the contrast between the STN and a baseline (containing the ZI and thalamus), the contrast between the STN and SN, the SNR in gray matter areas, and the slope of signal increase between STN and baseline among 1.5T, 3T, and 7T T2*-weighted GE images (Table 3-36:38). At higher field strengths, the STN, SN, putamen, GPi, and GPe could be visualized while the boundaries of these structures were unclear on the 1.5T images (Figure 3). Furthermore, all quantitative measures increased with field strength, and the SNR and contrast were significantly improved at 7T compared to 1.5 and 3T. Finally, the two studies by Kerl et al., investigating the STN and rZI at 7T (Kerl et al., 2012c, 2013) were additionally performed at 3T. Again, they compared the SNR and CNR of these structures between different sequences: T1-weighted MPRAGE, T2-weighted fluid attenuated inversion recovery (FLAIR), T2-weighted sampling perfection with application of optimized contrasts using different flip angle evolutions (SPACE), two T2*-weighted 2D FLASH (FLASH2D) sequences, and SW images and their MIPs (Table 3-39:46) (Kerl et al., 2012a,b). This makes it possible to compare the SNRs and CNRs of the different studies between field strengths, when adjusted for voxel size, although it should be noted that for the T1- and T2-weighted images different sequences were used between field strengths. For both structures, the SNRs of the T2*-weighted, SWI-MIP and SW images of the 7T images were higher than those of the 3T images, but the SNRs of the 3T T2-weighted SPACE image and T1-weighted images were higher at 3T than at 7T. However, the CNRs of both structures were substantially higher on all the 7T sequences than on the corresponding 3T sequences.
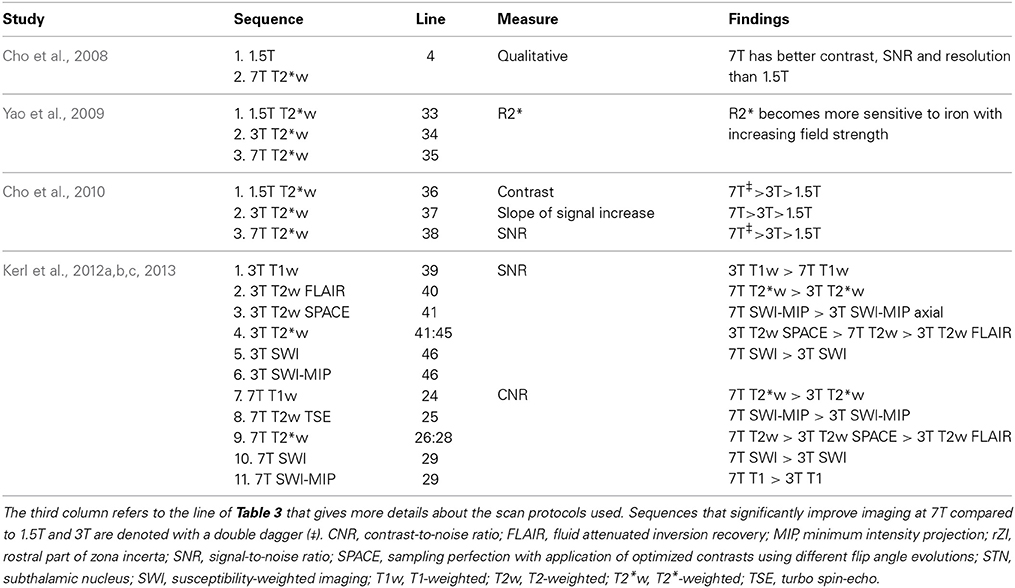
Table 6. Overview of studies that compare scan protocols between field strengths.
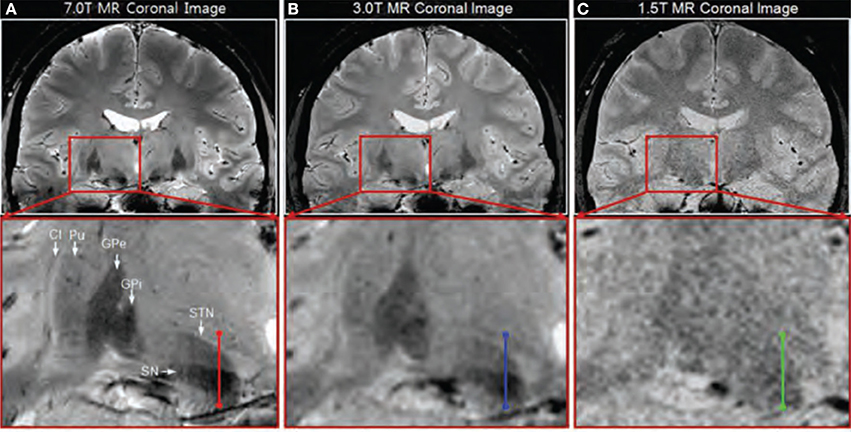
Figure 3. Coronal T2*-weighted images obtained at 7.0T (A), 3.0T (B), and 1.5T (C). Adapted with permission from Cho et al. (2010). Visual inspection shows clearer identification of the substantia nigra (SN), subthalamic nucleus (STN), internal globus pallidus (GPi), external globus pallidus (GPe), and putamen (Pu) at 7T compared to 3T and 1.5T.
These studies suggest that 7T MRI can better facilitate accurate targeting of deep brain structures than 1.5T or 3T MRI.
Discussion
Accurate visualization of deep-brain structures is important to improve our understanding of their anatomy, connectivity and function, and for improved surgical targeting for DBS in movement and psychiatric disorders. To date, targeting based on direct visualization of DBS targets with T2-weighted 1.5T or 3T MRI can be difficult. However, studies at ultra-high field showed good visibility of these structures on SW images based on T2* and phase contrast. Structures that have been identified at ultra-high field include: a separation between the STN and SN (Abosch et al., 2010; Cho et al., 2010; Massey et al., 2012; Schafer et al., 2012; Deistung et al., 2013b); the lamina pallidi medialis and lamina pallidi incompleta within the GP (Abosch et al., 2010; Deistung et al., 2013b); a subdivision of the STN in two halves (Lenglet et al., 2012; Massey et al., 2012); subdivisions of the SN possibly representing the SN pars reticulata and SN pars compacta (Eapen et al., 2011; Lenglet et al., 2012; Deistung et al., 2013b); substructures in the RN (Abosch et al., 2010; Eapen et al., 2011) including the medullary lamella (Abduljalil et al., 2003; Deistung et al., 2013b), RN pars oralis (Abduljalil et al., 2003), and RN pars caudalis (Deistung et al., 2013b); and several regions in the thalamus (Lenglet et al., 2012) including the Vim (Abosch et al., 2010; Deistung et al., 2013b), the pulvinar (Deistung et al., 2013b) and its anterior and medial boundaries (Abosch et al., 2010), the boundary of the nucleus ventralis caudalis (Abosch et al., 2010), the lateral and medial geniculate nucleus (Deistung et al., 2013b), the dorsomedial nucleus (Deistung et al., 2013b) and the dorsal nuclei group (Deistung et al., 2013b). Furthermore, 7T T2*-weighted and SW images have displayed improved CNR, SNR and resolution in the deep-brain regions, compared to 1.5T and 3T images (Cho et al., 2010; Kerl et al., 2012a,b,c, 2013).
Based on a descriptive evaluation of different MR images, more and smaller structures can be identified on T2*-weighted, GE phase, SW images, and susceptibility and R2* maps than on T1- and T2-weighted images (Abduljalil et al., 2003; Abosch et al., 2010; Kerl et al., 2012c, 2013; Deistung et al., 2013b). Although quantitative comparison between studies is difficult due to variations in scan protocols, the CNRs of deep-brain structures on T2* and SW images and corresponding maps are generally higher than those of T2- and T1-weighted images (Kerl et al., 2012c, 2013). For the SNR, the same trend can be seen, although T1-weighted images seem to have a higher SNR than SW images (Kerl et al., 2012c, 2013).
Perspectives
The improved visualization of the basal ganglia with ultra-high field MRI discussed here provides good perspectives for clinical practice. The clear delineation of DBS target structures and their possible subdivisions may aid in more accurate targeting, which may reduce negative side effects and shorten surgery duration, or it may even allow surgery under general anesthesia. Furthermore, ultra-high field MRI also shows potential for more accurate diagnosis and monitoring of basal ganglia diseases due to, for example, improved identification of the SN pars compacta and SN pars reticulata, which may in its turn facilitate improved patient specific treatments.
In addition, ultra-high field MRI promises to be a versatile tool in clinically oriented research of the deep brain nuclei. It might help us to improve our current understanding of the functionality of the healthy basal ganglia and its disease processes with high resolution functional MRI and connectivity analyses.
Recommendations
When in the end considering the optimal scan protocol for visualizing the DBS targets for clinical purposes at ultra-high field, both image quality and practical requirements need to be taken into account. In terms of hardware, it is recommended to use a head coil with a high number of receive channels (i.e., 16 or higher). This has been shown to improve the SNR (de Zwart et al., 2004; Wiggins et al., 2006) which is also reflected from the studies described in Table 3. In terms of scan protocol, based on the described literature, we recommend to use a 3D multi-echo GE sequence with an isotropic resolution of 0.5 mm3 and partial brain coverage. The 3D sequence facilitates small and isotropic voxel sizes, which ensures good resolution in every plane which is important for distinguishing the STN from the SN. From the multi-echo GE scan, both T2*-weighted and susceptibility weighted images as well as T2*-maps, R2*-maps, and susceptibility maps can be computed, which were shown in the reviewed literature to display best basal ganglia visibility. Since the basal ganglia are located within the same axial oblique slab of approximately 4–5 cm thickness, we advise to shorten scan time by covering only this part of the brain. If more time reduction is required, partial Fourier imaging, elliptical k-space coverage, or parallel imaging can be considered as well.
To support these guidelines, Figure 4 shows an example of a T2*-weighted image and an R2*-map created with these recommendations. The images were obtained by scanning a healthy volunteer on a 7T MR scanner (Magnetom 7T, Siemens, Erlangen, Germany) at Scannexus (Maastricht, The Netherlands) using a 32-channel phased-array coil (Nova Medical, Wilmington, United States) with a multi-echo 3D GE sequence. Scan time was reduced to 12 min and 23 s by partial brain coverage and 75% partial Fourier imaging (other scanning parameters can be found in Table 3–line 47:48). On these 0.5 mm3 isotropic resolution images, the STN can be distinguished from the SN in the coronal plane, and the three laminae of the GP can be identified.
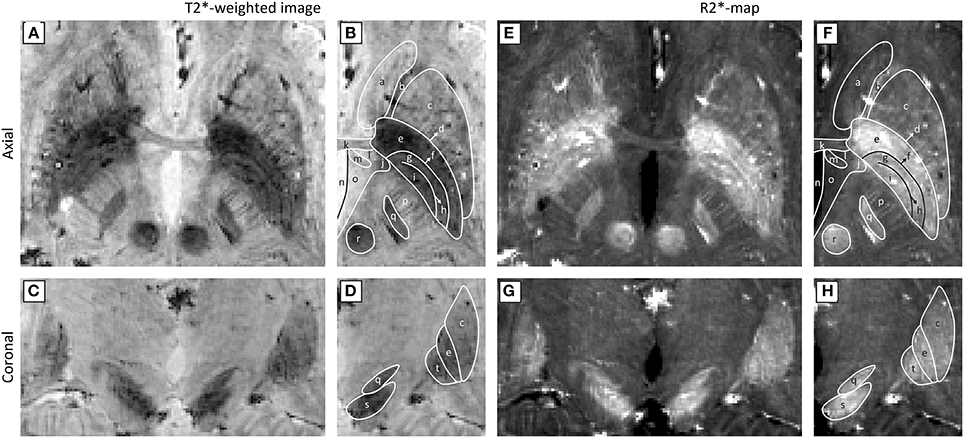
Figure 4. Ultra-high field (7T) axial (A,B,E,F) and coronal (C,D,G,H) T2*-weighted images (A–D) and R2*-maps (E–H). Panels (B,D,F,H) show the anatomical structures that can be identified with the Schaltenbrand and Wahren atlas (Schaltenbrand and Wahren, 2005): (a) caudate nucleus, (b) anterior limb of internal capsule, (c) putamen, (d) lamina pallidi lateralis, (e) external globus pallidus, (f) lamina pallidi medialis, (g) pallidum mediale externum, (h) lamina pallidi incompleta, (i) pallidum mediale internum, (j) inferior thalamic peduncle, (k) anterior commissure, (l) prothalamus, (m) fornix, (n) third ventricle, (o) hypothalamus, (p) posterior limb of internal capsule, (q) subthalamic nucleus, (r) red nucleus, (s) substantia nigra, (t) internal globus pallidus. (Courtesy D. Ivanov).
When planning a DBS surgery, the MR images are often registered to CT images, resulting in images that both display the stereotactic frame from the CT image as well as contrast within the brain. This registration may be more reliable, however if a whole brain MR image is available as an intermediate step. Abosch et al. (2010) showed that it is already possible to perform 1 mm3 whole brain T1-weighted imaging in 3.5 min, which may be a good candidate for coregistration.
Limitations
Despite these promising results concerning accurate and high-resolution visualization of the small deep brain (sub)structures, several issues still need to be addressed before they can routinely be employed in direct targeting for DBS.
Firstly, ultra-high field images have an increased risk of geometrical distortions compared to 1.5T images. The severity of these distortions at 7T in deep-brain regions has been investigated in several studies. One study compared the coordinates of marker points in a phantom imaged with 1.5T and 7T MRI to their locations on computed tomography (CT) images (Dammann et al., 2011). The maximum distortion in either x-, y-, or z-direction at 7T was 1.6 mm, which was slightly larger than at 1.5T (0.9 mm). Furthermore, the fewest distortions were observed in the center of the phantom. In another study the distortions in an anthropomorphic phantom between T2*-weighted 7T MR and CT images were investigated, revealing a maximum deviation of 0.78 mm (Cho et al., 2010). Finally, registration of 7T T1- and T2-weighted images of the midbrain of PD patients to 1.5T T1- and T2-weighted images showed that mainly rigid body transformations were required and that scaling and skew deformations were small (Duchin et al., 2012). Furthermore, the midbrain region, containing many DBS targets, required the least correction. Quantitative comparison showed that the distances of the T2-weighted images were significantly less than 1 mm suggesting that affine registration of T1- and T2-weighted 7T images to CT images can already provide MR images with midbrain distortions comparable to those of 1.5T images. These few studies suggest that at 7T images can be acquired with distortions smaller than 1 mm in the deep-brain areas.
Secondly, some of the mentioned imaging techniques pose additional challenges in the clinical context. Most studies were performed on young and healthy volunteers. In patients, movement during image acquisition can be less controlled, counteracting the gain in SNR and spatial specificity obtained with ultra-high field. However, newer techniques, such as prospective motion correction might remedy this problem (Maclaren et al., 2013). This approach monitors movement in the scanner with high accuracy and corrects the new image acquisition adaptively according to the new head position. That is, even with large head movements—as observed in many patients—the resulting images are already coregistered and movement artifact free.
In addition, the availability of ultra-high field MR scanners is currently limited. Firstly, the number of scanners that have been installed in the world is limited itself (see Table 2), which is inherent to its high cost in purchase and in operation. Secondly, due to the novel status of ultra-high field MRI, safety precautions regarding metallic objects are often more strict than on 3T systems and the use of ultra-high field MRI is currently only allowed for research purposes.
Finally, direct targeting in DBS suffers from brain shift, intra-operative deformation of the brain compared to preoperative MR images due to difference in head position and cerebrospinal fluid loss. Without compensation for this, it will eventually still limit targeting accuracy. However, this effect is independent of the magnetic field strength and even the pre-operative imaging modality.
Conclusion
Ultra-high field MRI can reliably and accurately display subdivisions within the basal ganglia and related structures, which especially benefits from T2*- and phase-related contrasts. If the limitations concerning image distortions and the availability of the scanners are solved, these technical advances have the potential to improve accuracy of targeting in DBS surgery and the clinical outcome.
Conflict of Interest Statement
The authors declare that the research was conducted in the absence of any commercial or financial relationships that could be construed as a potential conflict of interest.
Acknowledgments
This study was supported by the Joint Scientific Thematic Research Programme (JSTP) of the Netherlands Organization for Scientific Research (NWO) and by the Limburg University Fund/Foundation for Higher Education in Limburg (SWOL). The authors would like to thank Björn Falkenburger for his contribution to the manuscript.
Abbreviations
CNR, contrast-to-noise ratio; DBS, deep brain stimulation; DWI, diffusion-weighted imaging; FLAIR, fluid attenuated inversion recovery; FLASH, fast low-angle shot; GE, gradient echo; GP, globus pallidus; GPe, external globus pallidus; GPi, internal globus pallidus; GRASE, gradient and spin-echo; MIP, minimum intensity projection; MPRAGE, magnetization-prepared rapid acquisition of gradient echo; PD, Parkinson's disease; PIAF, parallel imaging acceleration factor; RN, red nucleus; rZI, rostral part of ZI; SE, spin-echo; SN, substantia nigra; SNR, signal-to-noise ratio; SPACE, sampling perfection with application of optimized contrasts using different flip angle evolutions; SW, susceptibility-weighted; SWI, susceptibility-weighted imaging; TDI, track-density imaging; TE, echo time; TR, repetition time; TSE, turbo spin-echo; ZI, zona incerta.
References
Abduljalil, A. M., Schmalbrock, P., Novak, V., and Chakeres, D. W. (2003). Enhanced gray and white matter contrast of phase susceptibility-weighted images in ultra-high-field magnetic resonance imaging. J. Magn. Reson. Imaging 18, 284–290. doi: 10.1002/jmri.10362
Pubmed Abstract | Pubmed Full Text | CrossRef Full Text | Google Scholar
Abosch, A., Yacoub, E., Ugurbil, K., and Harel, N. (2010). An assessment of current brain targets for deep brain stimulation surgery with susceptibility-weighted imaging at 7 tesla. Neurosurgery 67, 1745–1756. discussion: 56. doi: 10.1227/NEU.0b013e3181f74105
Pubmed Abstract | Pubmed Full Text | CrossRef Full Text | Google Scholar
Ackermans, L., Temel, Y., and Visser-Vandewalle, V. (2008). Deep brain stimulation in Tourette's syndrome. Neurotherapeutics 5, 339–344. doi: 10.1016/j.nurt.2008.01.009
Pubmed Abstract | Pubmed Full Text | CrossRef Full Text | Google Scholar
Arrubla, J., Neuner, I., Hahn, D., Boers, F., and Shah, N. J. (2013). Recording visual evoked potentials and auditory evoked P300 at 9.4T static magnetic field. PLoS ONE 8:e62915. doi: 10.1371/journal.pone.0062915
Pubmed Abstract | Pubmed Full Text | CrossRef Full Text | Google Scholar
Augustinack, J. C., van der Kouwe, A. J., Blackwell, M. L., Salat, D. H., Wiggins, C. J., Frosch, M. P., et al. (2005). Detection of entorhinal layer II using 7Tesla [corrected] magnetic resonance imaging. Ann. Neurol. 57, 489–494. doi: 10.1002/ana.20426
Pubmed Abstract | Pubmed Full Text | CrossRef Full Text | Google Scholar
Bender, B., Manz, C., Korn, A., Nagele, T., and Klose, U. (2011). Optimized 3D magnetization-prepared rapid acquisition of gradient echo: identification of thalamus substructures at 3T. AJNR Am. J. Neuroradiol. 32, 2110–2115. doi: 10.3174/ajnr.A2705
Pubmed Abstract | Pubmed Full Text | CrossRef Full Text | Google Scholar
Berrington, A., Jezzard, P., Clare, S., and Emir, U. (2014). “Two-voxel Hadamard encoded semi-LASER spectroscopy for in vivo MRS at ultra-high field,” in Joint Annual Meeting ISMRM-ESMRMB (Milan, Italy).
Bhagat, Y. A., Rajapakse, C. S., Magland, J. F., Love, J. H., Wright, A. C., Wald, M. J., et al. (2011). Performance of muMRI-Based virtual bone biopsy for structural and mechanical analysis at the distal tibia at 7T field strength. J. Magn. Reson. Imaging 33, 372–381. doi: 10.1002/jmri.22439
Pubmed Abstract | Pubmed Full Text | CrossRef Full Text | Google Scholar
Boulant, N., Cloos, M. A., and Amadon, A. (2011). B1 and B0 inhomogeneity mitigation in the human brain at 7 T with selective pulses by using average Hamiltonian theory. Magn. Reson. Med. 65, 680–691. doi: 10.1002/mrm.22658
Pubmed Abstract | Pubmed Full Text | CrossRef Full Text | Google Scholar
Bourekas, E. C., Christoforidis, G. A., Abduljalil, A. M., Kangarlu, A., Chakeres, D. W., Spigos, D. G., et al. (1999). High resolution MRI of the deep gray nuclei at 8 Tesla. J. Comput. Assist. Tomogr. 23, 867–874. doi: 10.1097/00004728-199911000-00009
Pubmed Abstract | Pubmed Full Text | CrossRef Full Text | Google Scholar
Brunenberg, E. J., Platel, B., Hofman, P. A., Ter Haar Romeny, B. M., and Visser-Vandewalle, V. (2011). Magnetic resonance imaging techniques for visualization of the subthalamic nucleus. J. Neurosurg. 115, 971–984. doi: 10.3171/2011.6.JNS101571
Pubmed Abstract | Pubmed Full Text | CrossRef Full Text | Google Scholar
Brunenberg, E. J. L., Moeskops, P., Backes, W. H., Pollo, C., Cammoun, L., Vilanova, A., et al. (2012). Structural and resting state functional connectivity of the subthalamic nucleus: identification of motor STN parts and the hyperdirect pathway. PLoS ONE 7:e39061. doi: 10.1371/journal.pone.0039061
Pubmed Abstract | Pubmed Full Text | CrossRef Full Text | Google Scholar
Budde, J., Shajan, G., Scheffler, K., and Pohmann, R. (2014). Ultra-high resolution imaging of the human brain using acquisition-weighted imaging at 9.4T. Neuroimage 86, 592–598. doi: 10.1016/j.neuroimage.2013.08.013
Pubmed Abstract | Pubmed Full Text | CrossRef Full Text | Google Scholar
Buxton, R. B. (2013). The physics of functional magnetic resonance imaging (fMRI). Rep. Prog. Phys. 76:096601. doi: 10.1088/0034-4885/76/9/096601
Pubmed Abstract | Pubmed Full Text | CrossRef Full Text | Google Scholar
Calamante, F., Oh, S. H., Tournier, J. D., Park, S. Y., Son, Y. D., Chung, J. Y., et al. (2012). Super-resolution track-density imaging of thalamic substructures: comparison with high-resolution anatomical magnetic resonance imaging at 7.0T. Hum. Brain Mapp. 34, 2538–2548. doi: 10.1002/hbm.22083
Pubmed Abstract | Pubmed Full Text | CrossRef Full Text | Google Scholar
Calamante, F., Tournier, J. D., Jackson, G. D., and Connelly, A. (2010). Track-density imaging (TDI): super-resolution white matter imaging using whole-brain track-density mapping. Neuroimage 53, 1233–1243. doi: 10.1016/j.neuroimage.2010.07.024
Pubmed Abstract | Pubmed Full Text | CrossRef Full Text | Google Scholar
Cho, Z.-H., Kim, Y.-B., Han, J.-Y., Min, H.-K., Kim, K.-N., Choi, S.-H., et al. (2008). New brain atlas—Mapping the human brain in vivo with 7.0 T MRI and comparison with postmortem histology: will these images change modern medicine? Int. J. Imaging Syst. Technol. 18, 2–8. doi: 10.1002/ima.20143
Cho, Z. H., Min, H. K., Oh, S. H., Han, J. Y., Park, C. W., Chi, J. G., et al. (2010). Direct visualization of deep brain stimulation targets in Parkinson disease with the use of 7-tesla magnetic resonance imaging. J. Neurosurg. 113, 639–647. doi: 10.3171/2010.3.JNS091385
Pubmed Abstract | Pubmed Full Text | CrossRef Full Text | Google Scholar
Cloos, M., Wiggins, C., Wiggins, G., and Sodickson, D. (2014). “Plug and play parallel transmission at 7 and 9.4 Tesla based on principles from MR fingerprinting,” in Joint Annual Meeting ISMRM-ESMRMB (Milan, Italy).
Costagli, M., Kelley, D. A., Symms, M. R., Biagi, L., Stara, R., Maggioni, E., et al. (2014). Tissue border enhancement by inversion recovery MRI at 7.0 Tesla. Neuroradiology 56, 517–523. doi: 10.1007/s00234-014-1365-8
Pubmed Abstract | Pubmed Full Text | CrossRef Full Text | Google Scholar
Damier, P., Thobois, S., Witjas, T., Cuny, E., Derost, P., Raoul, S., et al. (2007). Bilateral deep brain stimulation of the globus pallidus to treat tardive dyskinesia. Arch. Gen. Psychiatry 64, 170–176. doi: 10.1001/archpsyc.64.2.170
Pubmed Abstract | Pubmed Full Text | CrossRef Full Text | Google Scholar
Dammann, P., Kraff, O., Wrede, K. H., Ozkan, N., Orzada, S., Mueller, O. M., et al. (2011). Evaluation of hardware-related geometrical distortion in structural MRI at 7 Tesla for image-guided applications in neurosurgery. Acad. Radiol. 18, 910–916. doi: 10.1016/j.acra.2011.02.011
Pubmed Abstract | Pubmed Full Text | CrossRef Full Text | Google Scholar
D'Arceuil, H. E., Westmoreland, S., and de Crespigny, A. J. (2007). An approach to high resolution diffusion tensor imaging in fixed primate brain. Neuroimage 35, 553–565. doi: 10.1016/j.neuroimage.2006.12.028
Pubmed Abstract | Pubmed Full Text | CrossRef Full Text | Google Scholar
de Bresser, J., Brundel, M., Conijn, M. M., van Dillen, J. J., Geerlings, M. I., Viergever, M. A., et al. (2013). Visual cerebral microbleed detection on 7T MR imaging: reliability and effects of image processing. AJNR Am. J. Neuroradiol. 34, E61–E64. doi: 10.3174/ajnr.A2960
Pubmed Abstract | Pubmed Full Text | CrossRef Full Text | Google Scholar
Deelchand, D. K., van de Moortele, P. F., Adriany, G., Iltis, I., Andersen, P., Strupp, J. P., et al. (2010). In vivo 1H NMR spectroscopy of the human brain at 9.4 T: initial results. J. Magn. Reson. 206, 74–80. doi: 10.1016/j.jmr.2010.06.006
Pubmed Abstract | Pubmed Full Text | CrossRef Full Text | Google Scholar
Deistung, A., Schafer, A., Schweser, F., Biedermann, U., Gullmar, D., Trampel, R., et al. (2013a). High-resolution MR imaging of the human brainstem in vivo at 7 Tesla. Front. Hum. Neurosci. 7:710. doi: 10.3389/fnhum.2013.00710
Pubmed Abstract | Pubmed Full Text | CrossRef Full Text | Google Scholar
Deistung, A., Schafer, A., Schweser, F., Biedermann, U., Turner, R., and Reichenbach, J. R. (2013b). Toward in vivo histology: a comparison of quantitative susceptibility mapping (QSM) with magnitude-, phase-, and R2*-imaging at ultra-high magnetic field strength. Neuroimage 65, 299–314. doi: 10.1016/j.neuroimage.2012.09.055
Pubmed Abstract | Pubmed Full Text | CrossRef Full Text | Google Scholar
Denney, T. S., Bolding, M., Beyers, R., Salibi, N., Li, M., Zhang, X., et al. (2014). “Differential motion in orbital and global layers of extraocular muscles measured by tagged MRI At 7T,” in Joint Annual Meeting ISMRM-ESMRMB (Milan, Italy).
Denys, D., Mantione, M., Figee, M., van den Munckhof, P., Koerselman, F., Westenberg, H., et al. (2010). Deep brain stimulation of the nucleus accumbens for treatment-refractory obsessive-compulsive disorder. Arch. Gen. Psychiatry 67, 1061–1068. doi: 10.1001/archgenpsychiatry.2010.122
Pubmed Abstract | Pubmed Full Text | CrossRef Full Text | Google Scholar
Deuschl, G., Schade-Brittinger, C., Krack, P., Volkmann, J., Schafer, H., Botzel, K., et al. (2006). A randomized trial of deep-brain stimulation for Parkinson's disease. N. Engl. J. Med. 355, 896–908. doi: 10.1056/NEJMoa060281
Pubmed Abstract | Pubmed Full Text | CrossRef Full Text | Google Scholar
de Zwart, J. A., Ledden, P. J., van Gelderen, P., Bodurka, J., Chu, R., and Duyn, J. H. (2004). Signal-to-noise ratio and parallel imaging performance of a 16-channel receive-only brain coil array at 3.0 Tesla. Magn. Reson. Med. 51, 22–26. doi: 10.1002/mrm.10678
Pubmed Abstract | Pubmed Full Text | CrossRef Full Text | Google Scholar
Dieringer, M. A., Renz, W., Lindel, T., Seifert, F., Frauenrath, T., von Knobelsdorff-Brenkenhoff, F., et al. (2011). Design and application of a four-channel transmit/receive surface coil for functional cardiac imaging at 7T. J. Magn. Reson. Imaging 33, 736–741. doi: 10.1002/jmri.22451
Pubmed Abstract | Pubmed Full Text | CrossRef Full Text | Google Scholar
Duchin, Y., Abosch, A., Yacoub, E., Sapiro, G., and Harel, N. (2012). Feasibility of using ultra-high field (7 T) MRI for clinical surgical targeting. PLoS ONE 7:e37328. doi: 10.1371/journal.pone.0037328
Pubmed Abstract | Pubmed Full Text | CrossRef Full Text | Google Scholar
Duyn, J. H. (2012). The future of ultra-high field MRI and fMRI for study of the human brain. Neuroimage 62, 1241–1248. doi: 10.1016/j.neuroimage.2011.10.065
Pubmed Abstract | Pubmed Full Text | CrossRef Full Text | Google Scholar
Dzyubachyk, O., Lelieveldt, B. P., Blaas, J., Reijnierse, M., Webb, A., and van der Geest, R. J. (2013). Automated algorithm for reconstruction of the complete spine from multistation 7T MR data. Magn. Reson. Med. 69, 1777–1786. doi: 10.1002/mrm.24404
Pubmed Abstract | Pubmed Full Text | CrossRef Full Text | Google Scholar
Eapen, M., Zald, D. H., Gatenby, J. C., Ding, Z., and Gore, J. C. (2011). Using high-resolution MR imaging at 7T to evaluate the anatomy of the midbrain dopaminergic system. AJNR Am. J. Neuroradiol. 32, 688–694. doi: 10.3174/ajnr.A2355
Pubmed Abstract | Pubmed Full Text | CrossRef Full Text | Google Scholar
Fisher, R., Salanova, V., Witt, T., Worth, R., Henry, T., Gross, R., et al. (2010). Electrical stimulation of the anterior nucleus of thalamus for treatment of refractory epilepsy. Epilepsia 51, 899–908. doi: 10.1111/j.1528-1167.2010.02536.x
Pubmed Abstract | Pubmed Full Text | CrossRef Full Text | Google Scholar
Follett, K. A., and Torres-Russotto, D. (2012). Deep brain stimulation of globus pallidus interna, subthalamic nucleus, and pedunculopontine nucleus for Parkinson's disease: which target? Parkinsonism Relat. Disord. 18(Suppl. 1), S165–S167. doi: 10.1016/S1353-8020(11)70051-7
Foroutan, P., Murray, M. E., Fujioka, S., Schweitzer, K. J., Dickson, D. W., Wszolek, Z. K., et al. (2013). Progressive supranuclear palsy: high-field-strength MR microscopy in the human substantia nigra and globus pallidus. Radiology 266, 280–288. doi: 10.1148/radiol.12102273
Pubmed Abstract | Pubmed Full Text | CrossRef Full Text | Google Scholar
Gaitan, M. I., Sati, P., Inati, S. J., and Reich, D. S. (2013). Initial investigation of the blood-brain barrier in MS lesions at 7 tesla. Mult. Scler. 19, 1068–1073. doi: 10.1177/1352458512471093
Pubmed Abstract | Pubmed Full Text | CrossRef Full Text | Google Scholar
Glover, P. M., Cavin, I., Qian, W., Bowtell, R., and Gowland, P. A. (2007). Magnetic-field-induced vertigo: a theoretical and experimental investigation. Bioelectromagnetics 28, 349–361. doi: 10.1002/bem.20316
Pubmed Abstract | Pubmed Full Text | CrossRef Full Text | Google Scholar
Goubran, M., Rudko, D. A., Santyr, B., Gati, J., Szekeres, T., Peters, T. M., et al. (2014). In vivo normative atlas of the hippocampal subfields using multi-echo susceptibility imaging at 7 Tesla. Hum. Brain Mapp. 35, 3588–3601. doi: 10.1002/hbm.22423
Pubmed Abstract | Pubmed Full Text | CrossRef Full Text | Google Scholar
Haacke, E. M., and Reichenbach, J. R. (2011). Susceptibility Weighted Imaging in MRI: Basic Concepts and Clinical Applications. Hoboken, NJ: Wiley.
Haase, A., Frahm, J., Matthaei, D., Hanicke, W., and Merboldt, K. D. (2011). FLASH imaging: rapid NMR imaging using low flip-angle pulses. 1986. J. Magn. Reson. 213, 533–541. doi: 10.1016/j.jmr.2011.09.021
Pubmed Abstract | Pubmed Full Text | CrossRef Full Text | Google Scholar
Hahn, A., Kranz, G. S., Seidel, E. M., Sladky, R., Kraus, C., Kublbock, M., et al. (2013). Comparing neural response to painful electrical stimulation with functional MRI at 3 and 7 T. Neuroimage 82, 336–343. doi: 10.1016/j.neuroimage.2013.06.010
Pubmed Abstract | Pubmed Full Text | CrossRef Full Text | Google Scholar
Hallgren, B., and Sourander, P. (1958). The effect of age on the non-haemin iron in the human brain. J. Neurochem. 3, 41–51. doi: 10.1111/j.1471-4159.1958.tb12607.x
Pubmed Abstract | Pubmed Full Text | CrossRef Full Text | Google Scholar
He, L., Zuo, Z., Chen, L., and Humphreys, G. (2014). Effects of number magnitude and notation at 7T: separating the neural response to small and large, symbolic and nonsymbolic number. Cereb. Cortex 24, 2199–2209. doi: 10.1093/cercor/bht074
Pubmed Abstract | Pubmed Full Text | CrossRef Full Text | Google Scholar
Hennig, J., Nauerth, A., and Friedburg, H. (1986). RARE imaging: a fast imaging method for clinical MR. Magn. Reson. Med. 3, 823–833. doi: 10.1002/mrm.1910030602
Pubmed Abstract | Pubmed Full Text | CrossRef Full Text | Google Scholar
Hoffmann, M. B., Stadler, J., Kanowski, M., and Speck, O. (2009). Retinotopic mapping of the human visual cortex at a magnetic field strength of 7T. Clin. Neurophysiol. 120, 108–116. doi: 10.1016/j.clinph.2008.10.153
Pubmed Abstract | Pubmed Full Text | CrossRef Full Text | Google Scholar
Hoffmann, S. H., Begovatz, P., Nagel, A. M., Umathum, R., Schommer, K., Bachert, P., et al. (2011). A measurement setup for direct 17O MRI at 7 T. Magn. Reson. Med. 66, 1109–1115. doi: 10.1002/mrm.22871
Pubmed Abstract | Pubmed Full Text | CrossRef Full Text | Google Scholar
Intrapiromkul, J., Zhu, H., Cheng, Y., Barker, P. B., and Edden, R. A. (2013). Determining the in vivo transverse relaxation time of GABA in the human brain at 7T. J. Magn. Reson. Imaging 38, 1224–1229. doi: 10.1002/jmri.23979
Pubmed Abstract | Pubmed Full Text | CrossRef Full Text | Google Scholar
Ivanov, D., Poser, B., Huber, L., Pfeuffer, J., and Uludağ, K. (2014). “Whole-brain perfusion measurements at 7T using pulsed arterial spin labelling and simultaneous multi-slice multi-echo echo planar imaging,” in Joint Annual Meeting ISMRM-ESMRMB (Milan, Italy).
Kabasawa, H., Nabetani, A., Matsuzawa, H., and Nakada, T. (2006). “Imaging optimization for in-vivo human micro imaging at 7T,” in Joint Annual Meeting ISMRM-ESMRMB (Seattle, Washington).
Kanowski, M., Voges, J., and Tempelmann, C. (2010). Delineation of the nucleus centre median by proton density weighted magnetic resonance imaging at 3 T. Neurosurgery 66(3 Suppl. Operative), E121–E123. discussion: E3. doi: 10.1227/01.NEU.0000348560.85056.63
Pubmed Abstract | Pubmed Full Text | CrossRef Full Text | Google Scholar
Kerchner, G. A., Deutsch, G. K., Zeineh, M., Dougherty, R. F., Saranathan, M., and Rutt, B. K. (2012). Hippocampal CA1 apical neuropil atrophy and memory performance in Alzheimer's disease. Neuroimage 63, 194–202. doi: 10.1016/j.neuroimage.2012.06.048
Pubmed Abstract | Pubmed Full Text | CrossRef Full Text | Google Scholar
Kerl, H. U., Gerigk, L., Brockmann, M. A., Huck, S., Al-Zghloul, M., Groden, C., et al. (2013). Imaging for deep brain stimulation: the zona incerta at 7 Tesla. World J. Radiol. 5, 5–16. doi: 10.4329/wjr.v5.i1.5
Pubmed Abstract | Pubmed Full Text | CrossRef Full Text | Google Scholar
Kerl, H. U., Gerigk, L., Huck, S., Al-Zghloul, M., Groden, C., and Nolte, I. S. (2012b). Visualisation of the zona incerta for deep brain stimulation at 3.0 Tesla. Clin. Neuroradiol. 22, 55–68. doi: 10.1007/s00062-012-0136-3
Pubmed Abstract | Pubmed Full Text | CrossRef Full Text | Google Scholar
Kerl, H. U., Gerigk, L., Pechlivanis, I., Al-Zghloul, M., Groden, C., and Nolte, I. (2012a). The subthalamic nucleus at 3.0 Tesla: choice of optimal sequence and orientation for deep brain stimulation using a standard installation protocol: clinical article. J. Neurosurg. 117, 1155–1165. doi: 10.3171/2012.8.JNS111930
Pubmed Abstract | Pubmed Full Text | CrossRef Full Text | Google Scholar
Kerl, H. U., Gerigk, L., Pechlivanis, I., Al-Zghloul, M., Groden, C., and Nölte, I. S. (2012c). The subthalamic nucleus at 7.0 Tesla: evaluation of sequence and orientation for deep-brain stimulation. Acta Neurochir. (Wien). 154, 2051–2062. doi: 10.1007/s00701-012-1476-0
Pubmed Abstract | Pubmed Full Text | CrossRef Full Text | Google Scholar
Kickler, N., van der Zwaag, W., Mekle, R., Kober, T., Marques, J. P., Krueger, G., et al. (2010). Eddy current effects on a clinical 7T-68 cm bore scanner. MAGMA 23, 39–43. doi: 10.1007/s10334-009-0192-0
Pubmed Abstract | Pubmed Full Text | CrossRef Full Text | Google Scholar
Le Bihan, D. (2003). Looking into the functional architecture of the brain with diffusion MRI. Nat. Rev. Neurosci. 4, 469–480. doi: 10.1038/nrn1119
Pubmed Abstract | Pubmed Full Text | CrossRef Full Text | Google Scholar
Lee, J. Y., Deogaonkar, M., and Rezai, A. (2007). Deep brain stimulation of globus pallidus internus for dystonia. Parkinsonism Relat. Disord. 13, 261–265. doi: 10.1016/j.parkreldis.2006.07.020
Pubmed Abstract | Pubmed Full Text | CrossRef Full Text | Google Scholar
Lenglet, C., Abosch, A., Yacoub, E., De Martino, F., Sapiro, G., and Harel, N. (2012). Comprehensive in vivo mapping of the human basal ganglia and thalamic connectome in individuals using 7T MRI. PLoS ONE 7:e29153. doi: 10.1371/journal.pone.0029153
Pubmed Abstract | Pubmed Full Text | CrossRef Full Text | Google Scholar
Limousin, P., and Martinez-Torres, I. (2008). Deep brain stimulation for Parkinson's disease. Neurotherapeutics 5, 309–319. doi: 10.1016/j.nurt.2008.01.006
Pubmed Abstract | Pubmed Full Text | CrossRef Full Text | Google Scholar
Liu, T., Eskreis-Winkler, S., Schweitzer, A. D., Chen, W., Kaplitt, M. G., Tsiouris, A. J., et al. (2013). Improved subthalamic nucleus depiction with quantitative susceptibility mapping. Radiology 269, 216–223. doi: 10.1148/radiol.13121991
Pubmed Abstract | Pubmed Full Text | CrossRef Full Text | Google Scholar
Lotfipour, A. K., Wharton, S., Schwarz, S. T., Gontu, V., Schafer, A., Peters, A. M., et al. (2012). High resolution magnetic susceptibility mapping of the substantia nigra in Parkinson's disease. J. Magn. Reson. Imaging 35, 48–55. doi: 10.1002/jmri.22752
Pubmed Abstract | Pubmed Full Text | CrossRef Full Text | Google Scholar
Lu, A., Atkinson, I. C., Zhou, X. J., and Thulborn, K. R. (2013). PCr/ATP ratio mapping of the human head by simultaneously imaging of multiple spectral peaks with interleaved excitations and flexible twisted projection imaging readout trajectories at 9.4 T. Magn. Reson. Med. 69, 538–544. doi: 10.1002/mrm.24281
Pubmed Abstract | Pubmed Full Text | CrossRef Full Text | Google Scholar
Maclaren, J., Herbst, M., Speck, O., and Zaitsev, M. (2013). Prospective motion correction in brain imaging: a review. Magn. Reson. Med. 69, 621–636. doi: 10.1002/mrm.24314
Pubmed Abstract | Pubmed Full Text | CrossRef Full Text | Google Scholar
Maia, T. V., Cooney, R. E., and Peterson, B. S. (2008). The neural bases of obsessive-compulsive disorder in children and adults. Dev. Psychopathol. 20, 1251–1283. doi: 10.1017/S0954579408000606
Pubmed Abstract | Pubmed Full Text | CrossRef Full Text | Google Scholar
Malone, D. A. Jr., Dougherty, D. D., Rezai, A. R., Carpenter, L. L., Friehs, G. M., Eskandar, E. N., et al. (2009). Deep brain stimulation of the ventral capsule/ventral striatum for treatment-resistant depression. Biol. Psychiatry 65, 267–275. doi: 10.1016/j.biopsych.2008.08.029
Pubmed Abstract | Pubmed Full Text | CrossRef Full Text | Google Scholar
Mang, S. C., Busza, A., Reiterer, S., Grodd, W., and Klose, A. U. (2012). Thalamus segmentation based on the local diffusion direction: a group study. Magn. Reson. Med. 67, 118–126. doi: 10.1002/mrm.22996
Pubmed Abstract | Pubmed Full Text | CrossRef Full Text | Google Scholar
Massey, L. A., Miranda, M. A., Zrinzo, L., Al-Helli, O., Parkes, H. G., Thornton, J. S., et al. (2012). High resolution MR anatomy of the subthalamic nucleus: imaging at 9.4 T with histological validation. Neuroimage 59, 2035–2044. doi: 10.1016/j.neuroimage.2011.10.016
Pubmed Abstract | Pubmed Full Text | CrossRef Full Text | Google Scholar
Metcalf, M., Xu, D., Okuda, D. T., Carvajal, L., Srinivasan, R., Kelley, D. A., et al. (2010). High-resolution phased-array MRI of the human brain at 7 tesla: initial experience in multiple sclerosis patients. J. Neuroimaging 20, 141–147. doi: 10.1111/j.1552-6569.2008.00338.x
Pubmed Abstract | Pubmed Full Text | CrossRef Full Text | Google Scholar
Mink, J. W. (2006). Neurobiology of basal ganglia and Tourette syndrome: basal ganglia circuits and thalamocortical outputs. Adv. Neurol. 99, 89–98.
Moon, C. H., Kim, J. H., Zhao, T., and Bae, K. T. (2013). Quantitative (23) Na MRI of human knee cartilage using dual-tuned (1) H/(23) Na transceiver array radiofrequency coil at 7 tesla. J. Magn. Reson. Imaging 38, 1063–1072. doi: 10.1002/jmri.24030
Pubmed Abstract | Pubmed Full Text | CrossRef Full Text | Google Scholar
Mori, S., Crain, B. J., Chacko, V. P., and van Zijl, P. C. (1999). Three-dimensional tracking of axonal projections in the brain by magnetic resonance imaging. Ann. Neurol. 45, 265–269.
Nolte, I. S., Gerigk, L., Al-Zghloul, M., Groden, C., and Kerl, H. U. (2012). Visualization of the internal globus pallidus: sequence and orientation for deep brain stimulation using a standard installation protocol at 3.0 Tesla. Acta Neurochir. (Wien) 154, 481–494. doi: 10.1007/s00701-011-1242-8
Pubmed Abstract | Pubmed Full Text | CrossRef Full Text | Google Scholar
Novak, P., Novak, V., Kangarlu, A., Abduljalil, A. M., Chakeres, D. W., and Robitaille, P. M. (2001). High resolution MRI of the brainstem at 8 T. J. Comput. Assist. Tomogr. 25, 242–246. doi: 10.1097/00004728-200103000-00016
Pubmed Abstract | Pubmed Full Text | CrossRef Full Text | Google Scholar
Obeso, J. A., Marin, C., Rodriguez-Oroz, C., Blesa, J., Benitez-Temino, B., Mena-Segovia, J., et al. (2008). The basal ganglia in Parkinson's disease: current concepts and unexplained observations. Ann. Neurol. 64(Suppl. 2), S30–S46. doi: 10.1002/ana.21481
Pubmed Abstract | Pubmed Full Text | CrossRef Full Text | Google Scholar
Pakin, S. K., Cavalcanti, C., La Rocca, R., Schweitzer, M. E., and Regatte, R. R. (2006). Ultra-high-field MRI of knee joint at 7.0T: preliminary experience. Acad. Radiol. 13, 1135–1142. doi: 10.1016/j.acra.2006.06.007
Pubmed Abstract | Pubmed Full Text | CrossRef Full Text | Google Scholar
Pan, J. W., Avdievich, N., and Hetherington, H. P. (2010). J-refocused coherence transfer spectroscopic imaging at 7 T in human brain. Magn. Reson. Med. 64, 1237–1246. doi: 10.1002/mrm.22534
Pubmed Abstract | Pubmed Full Text | CrossRef Full Text | Google Scholar
Pouratian, N., Zheng, Z., Bari, A. A., Behnke, E., Elias, W. J., and Desalles, A. A. (2011). Multi-institutional evaluation of deep brain stimulation targeting using probabilistic connectivity-based thalamic segmentation. J. Neurosurg. 115, 995–1004. doi: 10.3171/2011.7.JNS11250
Pubmed Abstract | Pubmed Full Text | CrossRef Full Text | Google Scholar
Ren, J., Lakoski, S., Haller, R. G., Sherry, A. D., and Malloy, C. R. (2013). Dynamic monitoring of carnitine and acetylcarnitine in the trimethylamine signal after exercise in human skeletal muscle by 7T 1H-MRS. Magn. Reson. Med. 69, 7–17. doi: 10.1002/mrm.24249
Pubmed Abstract | Pubmed Full Text | CrossRef Full Text | Google Scholar
Rijkers, K., Temel, Y., Visser-Vandewalle, V., Vanormelingen, L., Vandersteen, M., Adriaensens, P., et al. (2007). The microanatomical environment of the subthalamic nucleus. Technical note. J. Neurosurg. 107, 198–201. doi: 10.3171/JNS-07/07/0198
Pubmed Abstract | Pubmed Full Text | CrossRef Full Text | Google Scholar
Robitaille, P. M., Warner, R., Jagadeesh, J., Abduljalil, A. M., Kangarlu, A., Burgess, R. E., et al. (1999). Design and assembly of an 8 tesla whole-body MR scanner. J. Comput. Assist. Tomogr. 23, 808–820. doi: 10.1097/00004728-199911000-00002
Pubmed Abstract | Pubmed Full Text | CrossRef Full Text | Google Scholar
Sato, H., and Kawagishi, K. (2014). Labyrinthine artery detection in patients with idiopathic sudden sensorineural hearing loss by 7-T MRI. Otolaryngol. Head Neck Surg. 150, 455–459. doi: 10.1177/0194599813517990
Pubmed Abstract | Pubmed Full Text | CrossRef Full Text | Google Scholar
Schafer, A., Forstmann, B. U., Neumann, J., Wharton, S., Mietke, A., Bowtell, R., et al. (2012). Direct visualization of the subthalamic nucleus and its iron distribution using high-resolution susceptibility mapping. Hum. Brain Mapp. 33, 2831–2842. doi: 10.1002/hbm.21404
Pubmed Abstract | Pubmed Full Text | CrossRef Full Text | Google Scholar
Schaltenbrand, G., and Wahren, W. (2005). Atlas for Stereotaxy of the Human Brain: with an Accompanying Guide. Stuttgart: Thieme.
Schaltenbrand, G., Wahren, W., and Hassler, R. (1977). Atlas for Stereotaxy of the Human Brain, 2nd Edn. Stuttgart: Thieme.
Schuepbach, W. M., Rau, J., Knudsen, K., Volkmann, J., Krack, P., Timmermann, L., et al. (2013). Neurostimulation for Parkinson's disease with early motor complications. N. Engl. J. Med. 368, 610–622. doi: 10.1056/NEJMoa1205158
Pubmed Abstract | Pubmed Full Text | CrossRef Full Text | Google Scholar
Soria, G., De Notaris, M., Tudela, R., Blasco, G., Puig, J., Planas, A. M., et al. (2011). Improved assessment of ex vivo brainstem neuroanatomy with high-resolution MRI and DTI at 7 Tesla. Anat. Rec. (Hoboken) 294, 1035–1044. doi: 10.1002/ar.21383
Pubmed Abstract | Pubmed Full Text | CrossRef Full Text | Google Scholar
Temel, Y., Blokland, A., Steinbusch, H. W. M., and Visser-Vandewalle, V. (2005). The functional role of the subthalamic nucleus in cognitive and limbic circuits. Prog. Neurobiol. 76, 393–413. doi: 10.1016/j.pneurobio.2005.09.005
Pubmed Abstract | Pubmed Full Text | CrossRef Full Text | Google Scholar
Theysohn, J. M., Maderwald, S., Kraff, O., Moenninghoff, C., Ladd, M. E., and Ladd, S. C. (2008). Subjective acceptance of 7 Tesla MRI for human imaging. MAGMA 21, 63–72. doi: 10.1007/s10334-007-0095-x
Pubmed Abstract | Pubmed Full Text | CrossRef Full Text | Google Scholar
Tovi, M., and Ericsson, A. (1992). Measurements of T1 and T2 over time in formalin-fixed human whole-brain specimens. Acta Radiol. 33, 400–404. doi: 10.3109/02841859209172021
Pubmed Abstract | Pubmed Full Text | CrossRef Full Text | Google Scholar
Unrath, A., Klose, U., Grodd, W., Ludolph, A. C., and Kassubek, J. (2008). Directional colour encoding of the human thalamus by diffusion tensor imaging. Neurosci. Lett. 434, 322–327. doi: 10.1016/j.neulet.2008.02.013
Pubmed Abstract | Pubmed Full Text | CrossRef Full Text | Google Scholar
Vaughan, J. T., Garwood, M., Collins, C. M., Liu, W., DelaBarre, L., Adriany, G., et al. (2001). 7T vs. 4T: RF power, homogeneity, and signal-to-noise comparison in head images. Magn. Reson. Med. 46, 24–30. doi: 10.1002/mrm.1156
Pubmed Abstract | Pubmed Full Text | CrossRef Full Text | Google Scholar
Vedrine, P., Aubert, G., Belorgey, J., Berriaud, C., Bourquard, A., Bredy, P., et al. (2014). Manufacturing of the Iseult/INUMAC Whole Body 11.7 T MRI Magnet. IEEE Trans. Appl. Supercond. 24, 1–6. doi: 10.1109/TASC.2013.2286256
Wharton, S., and Bowtell, R. (2010). Whole-brain susceptibility mapping at high field: a comparison of multiple- and single-orientation methods. Neuroimage 53, 515–525. doi: 10.1016/j.neuroimage.2010.06.070
Pubmed Abstract | Pubmed Full Text | CrossRef Full Text | Google Scholar
Wichmann, T., and Dostrovsky, J. O. (2011). Pathological basal ganglia activity in movement disorders. Neuroscience 198, 232–244. doi: 10.1016/j.neuroscience.2011.06.048
Pubmed Abstract | Pubmed Full Text | CrossRef Full Text | Google Scholar
Wiegell, M. R., Tuch, D. S., Larsson, H. B., and Wedeen, V. J. (2003). Automatic segmentation of thalamic nuclei from diffusion tensor magnetic resonance imaging. Neuroimage 19(2 Pt 1), 391–401. doi: 10.1016/S1053-8119(03)00044-2
Pubmed Abstract | Pubmed Full Text | CrossRef Full Text | Google Scholar
Wiggins, G. C., Triantafyllou, C., Potthast, A., Reykowski, A., Nittka, M., and Wald, L. L. (2006). 32-channel 3 Tesla receive-only phased-array head coil with soccer-ball element geometry. Magn. Reson. Med. 56, 216–223. doi: 10.1002/mrm.20925
Pubmed Abstract | Pubmed Full Text | CrossRef Full Text | Google Scholar
Wodarg, F., Herzog, J., Reese, R., Falk, D., Pinsker, M. O., Steigerwald, F., et al. (2012). Stimulation site within the MRI-defined STN predicts postoperative motor outcome. Mov. Disord. 27, 874–879. doi: 10.1002/mds.25006
Pubmed Abstract | Pubmed Full Text | CrossRef Full Text | Google Scholar
Wyss, M., Bruegger, M., Daeubler, B., Vionnet, L., Brunner, D., and Pruessmann, K. (2014). “Visualization of human brainstem substructures using gray matter nulling 3D-MPRAGE at 7Tesla,” in Joint Annual Meeting ISMRM-ESMRMB (Milan, Italy).
Yao, B., Li, T. Q., Gelderen, P., Shmueli, K., de Zwart, J. A., and Duyn, J. H. (2009). Susceptibility contrast in high field MRI of human brain as a function of tissue iron content. Neuroimage 44, 1259–1266. doi: 10.1016/j.neuroimage.2008.10.029
Pubmed Abstract | Pubmed Full Text | CrossRef Full Text | Google Scholar
Yokoyama, T., Ando, N., Sugiyama, K., Akamine, S., and Namba, H. (2006). Relationship of stimulation site location within the subthalamic nucleus region to clinical effects on parkinsonian symptoms. Stereotact. Funct. Neurosurg. 84, 170–175. doi: 10.1159/000094956
Yovel, Y., and Assaf, Y. (2007). Virtual definition of neuronal tissue by cluster analysis of multi-parametric imaging (virtual-dot-com imaging). Neuroimage 35, 58–69. doi: 10.1016/j.neuroimage.2006.08.055
Pubmed Abstract | Pubmed Full Text | CrossRef Full Text | Google Scholar
Keywords: ultra-high field, magnetic resonance imaging, basal ganglia, thalamus, deep brain stimulation
Citation: Plantinga BR, Temel Y, Roebroeck A, Uludağ K, Ivanov D, Kuijf ML and ter Haar Romenij BM (2014) Ultra-high field magnetic resonance imaging of the basal ganglia and related structures. Front. Hum. Neurosci. 8:876. doi: 10.3389/fnhum.2014.00876
Received: 16 June 2014; Accepted: 10 October 2014;
Published online: 05 November 2014.
Edited by:
Silvio Ionta, University Hospital Center (CHUV) and University of Lausanne (UNIL), SwitzerlandReviewed by:
Rochelle Ackerley, University of Gothenburg, SwedenKirk W. Feindel, University of Western Australia, Australia
Copyright © 2014 Plantinga, Temel, Roebroeck, Uludağ, Ivanov, Kuijf and ter Haar Romenij. This is an open-access article distributed under the terms of the Creative Commons Attribution License (CC BY). The use, distribution or reproduction in other forums is permitted, provided the original author(s) or licensor are credited and that the original publication in this journal is cited, in accordance with accepted academic practice. No use, distribution or reproduction is permitted which does not comply with these terms.
*Correspondence: Birgit R. Plantinga and Yasin Temel, Department of Neurosurgery, Maastricht University Medical Centre, PO Box 5800, 6202 AZ Maastricht, Netherlands e-mail: b.r.plantinga@tue.nl; y.temel@maastrichtuniversity.nl