High frequency deep brain stimulation attenuates subthalamic and cortical rhythms in Parkinson's disease
- 1Department of Neurology and Neurological Sciences, Stanford University, Stanford, CA, USA
- 2Department of Neurosurgery, Stanford University, Stanford, CA, USA
Parkinson's disease (PD) is marked by excessive synchronous activity in the beta (8–35 Hz) band throughout the cortico-basal ganglia network. The optimal location of high frequency deep brain stimulation (HF DBS) within the subthalamic nucleus (STN) region and the location of maximal beta hypersynchrony are currently matters of debate. Additionally, the effect of STN HF DBS on neural synchrony in functionally connected regions of motor cortex is unknown and is of great interest. Scalp EEG studies demonstrated that stimulation of the STN can activate motor cortex antidromically, but the spatial specificity of this effect has not been examined. The present study examined the effect of STN HF DBS on neural synchrony within the cortico-basal ganglia network in patients with PD. We measured local field potentials dorsal to and within the STN of PD patients, and additionally in the motor cortex in a subset of these patients. We used diffusion tensor imaging (DTI) to guide the placement of subdural cortical surface electrodes over the DTI-identified origin of the hyperdirect pathway (HDP) between motor cortex and the STN. The results demonstrated that local beta power was attenuated during HF DBS both dorsal to and within the STN. The degree of attenuation was monotonic with increased DBS voltages in both locations, but this voltage-dependent effect was greater in the central STN than dorsal to the STN (p < 0.05). Cortical signals over the estimated origin of the HDP also demonstrated attenuation of beta hypersynchrony during DBS dorsal to or within STN, whereas signals from non-specific regions of motor cortex were not attenuated. The spatially-specific suppression of beta synchrony in the motor cortex support the hypothesis that DBS may treat Parkinsonism by reducing excessive synchrony in the functionally connected sensorimotor network.
Introduction
Parkinson's disease (PD) is a progressive, debilitating neurological disease that is estimated to affect 6.3 million adults worldwide. High frequency deep brain stimulation (HF DBS) in sensorimotor regions of the subthalamic nucleus (STN) provides patients with moderate to advanced PD a better quality of life than with medication alone (Deuschl et al., 2006; Williams et al., 2010). The full potential of HF DBS may not yet be realized as the neurophysiological basis of motor improvement during HF DBS is not well understood and there is no consensus as to the optimal site for the active electrode of the DBS lead in the STN region.
Evidence points to excessive synchronization of neuronal activity in the beta (8–35 Hz) frequency band as a possible pathophysiological marker of the Parkinsonian state: it is observed in the widespread sensorimotor network in Parkinsonian animals (Nini et al., 1995; Bergman et al., 1998; Raz et al., 2000, 2001; Courtemanche et al., 2003) and in human patients with PD (Brown et al., 2001; Marsden et al., 2001; Williams et al., 2002; Kuhn et al., 2005; Fogelson et al., 2006; Lalo et al., 2008; de Solages et al., 2010; Litvak et al., 2011). Beta hypersychrony in the STN is attenuated after administration of therapeutic doses of dopaminergic medication in parallel with motor improvement (Weinberger et al., 2006; Ray et al., 2008; Kuhn et al., 2009), and is attenuated after periods of DBS (Wingeier et al., 2006; Kuhn et al., 2008; Ray et al., 2008; Bronte-Stewart et al., 2009). However, it is currently a matter of debate whether beta hypersynchrony is attenuated during HF DBS (Rossi et al., 2008; Eusebio et al., 2010; Rosa et al., 2011), and to what extent. Different patients receive therapeutic benefit at different DBS voltages, and quantitative methods for determining optimal stimulation parameters are currently underway (Mera et al., 2011). Moreover, localization of the sites in the STN area that exhibit maximal beta hypersynchrony, and the relationship between these sites and sites of clinical efficacy of DBS, are areas of active investigation (Kuhn et al., 2005; Chen et al., 2006; Fogelson et al., 2006; Magill et al., 2006; Weinberger et al., 2006; Trottenberg et al., 2007; Holdefer et al., 2010; Ince et al., 2010; Yoshida et al., 2010; Zaidel et al., 2010; de Solages et al., 2011).
The spread of pathological synchrony to the widespread cortico-basal ganglia network is not surprising given that this network is comprised of nested loops between cortex and basal ganglia structures (Alexander et al., 1986; Parent and Hazrati, 1995a). The STN receives excitatory input from motor cortex via the hyperdirect pathway (HDP) (Romansky et al., 1979; Kitai and Deniau, 1981; Nambu et al., 1996). STN efferents feed back to the primary motor cortex via pallido-thalamic projections (Carpenter et al., 1981; Alexander et al., 1986; Albin et al., 1989). Coherence in the beta band is evident in EEG recordings of PD patients among multiple nodes of the cortico-basal ganglia network including between STN and globus pallidus pars interna (GPi) (Brown et al., 2001; Cassidy et al., 2002), between GPi and cortex (Williams et al., 2002), and between STN and cortex (Ashby et al., 2001; Marsden et al., 2001; Williams et al., 2002; Sharott et al., 2005; Fogelson et al., 2006; Lalo et al., 2008; Hirschmann et al., 2010). It has been shown that DBS can antidromically activate the motor cortex (Maurice et al., 1998; Ashby et al., 2001; Baker et al., 2002) which, in rodents, can lead to suppression of cortical activity in the 0.5–4 Hz and 8–20 Hz bands (Li et al., 2007). Whether this finding is generalizable to humans with PD has not yet been shown because direct neurophysiological measurements from the motor cortex of patients have historically not been performed, as subdural cortical recordings are not standard clinical procedure for DBS implantation. In the present study, spatially-specific subdural cortical recordings were obtained from the surface of motor cortex in a subset of PD patients during DBS surgery. The placement of the motor strip was guided by identification of the HDP between motor cortex and the STN from pre-operative diffusion tensor imaging (DTI).
We examined the effects of DBS on local field potentials (LFPs) in the STN and ipsilateral motor cortex in patients with PD, asking several questions. First, we tested whether the LFP signal was attenuated during DBS and if so, whether the degree of attenuation increased with higher DBS voltages. Second, we compared these measurements during DBS in two regions of the STN: (1) dorsal to the dorsal STN border in the likely vicinity of several cortico-basal ganglia network axon bundles, and (2) within the STN where we have previously found beta hypersynchrony to be maximal (de Solages et al., 2011). Finally, in a subset of patients, we measured LFPs at the tractographically defined origin of the HDP in ipsilateral motor cortex during STN DBS and compared the response of signals in this region to that of non-specific areas of motor cortex.
Materials and Methods
Human Subjects
Intra-operative electrophysiological recordings were made in 13 hemispheres (five bilateral, three unilateral) from eight patients with PD during implantation of DBS leads in the STN. In three of these patients, electrocorticography (ECoG) recordings were obtained from motor cortex during STN recordings. Pre-operative selection criteria and assessment has been described previously (Bronte-Stewart et al., 2009). Mean (± standard deviation) demographics of patients in the present study (six males, two females) were: 63.4 (± 7.4) years of age, disease duration of 12.2 (± 6.7) years, and UPDRS scores of 43.5/28.7 (± 8.8/5.5) off/on medication pre-operatively. All patients signed a written consent for the study that was approved by the Stanford Institutional Review Board. Long acting dopaminergic medications were stopped at least 24 h before surgery and short acting medications were stopped at least 12 h before surgery.
LFP and ECoG Recordings During Functional Neurosurgery
The DBS lead (model 3389 Medtronic Inc, Minneapolis, MN, USA) was implanted in the sensorimotor region of the STN using standard functional frameless stereotactic technique and multi-pass microelectrode recording (MER), as previously reported (Holloway et al., 2005; Bronte-Stewart et al., 2010). Dorsal and ventral borders of each STN were determined during MER of each track (Romanelli et al., 2004). Once the DBS lead implantation track was selected, LFPs were recorded from electrodes 0 and 2 of the DBS lead (Figure 1) while constant voltage stimulation was delivered through electrode 1 using an external stimulator (model 3625 screener, Medtronic Inc., Minneapolis, MN, USA) with a 90 μs pulse width and stimulation frequency 185 Hz.
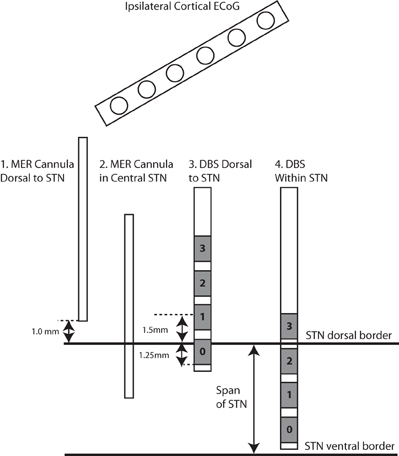
Figure 1. Experimental design. In all cases (n = 13), STN LFPs were recorded bilaterally between electrodes 0–2, before and during DBS stimulation through electrode 1, in each of the two positions. The first position places the center of electrode 1 at 1.5 mM dorsal to the dorsal border of the STN, and the second position places the center of electrode 1 within the STN. In a subset of these cases (n = 3), the 1 mM distal tip of the cannula that ensheaths the microelectrode was used to record monopolar LFPs after functional mapping and before implantation of the DBS lead, in each of two positions: (1) 1 mM dorsal to the dorsal border of the STN, and (2) at the midpoint of the dorsal and ventral borders of the STN. In these cases, the ECoG strip was placed over ipsilateral motor cortex during all STN recordings (cannula and DBS lead).
In three of the patients, a 1 × 6 ECoG strip with 1 cm spacing (PMT Corp., Chanhassen, MN) was placed on the motor cortex after the burr holes were created and prior to micro-electrode mapping. The intended site for the ECoG strip was over the origin of the projection from motor cortex to STN (presumed to correspond to the HDP). This was identified by DTI prior to surgery (Figure 2). DTI images were obtained using a GE MR750 3 Tesla MRI scanner. Deterministic fiber tracking was performed using a commercial software package (StealthViz, Medtronic Navigation, Lousville, CO, USA). Details of the DTI acquisitions will be published separately. At the end of the surgical procedure the position of the cortical strip electrode was confirmed by fluoroscopy (FluoroMerge, Medtronic Navigation). The planned trajectory for the cortical electrode was projected onto the fluoroscopic images to verify that a contact of the cortical electrode had been placed over the origin of the HDP (Henderson and Hill, 2008). The cortical electrode was then removed. For two of the patients, one ECoG contact was located specifically over the HDP (Figure 2). In the third patient, verification at the end of the procedure demonstrated that the ECoG strip had been placed at least 1 cm lateral to the intended site.
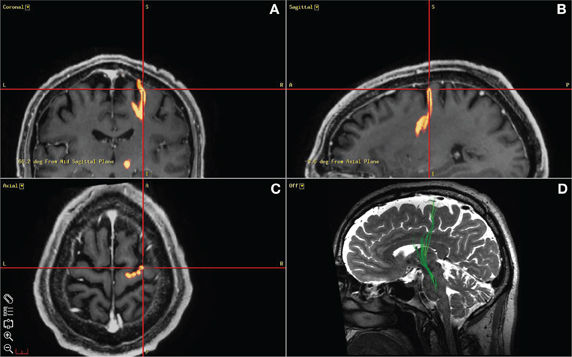
Figure 2. Diffusion tensor imaging used to guide ECoG strip placement. (A), (B), (C) depict a screen capture from the StealthViz neuronavigational system showing the localization of the origin of the “hyperdirect pathway” as targeted during surgery. (D) Sagittal view of a DTI image used to guide the positioning of the ECoG strip during surgery. Deterministic fiber tracking was first performed using a commercial software package (StealthViz, Medtronic Navigation, Louisville, CO). A trapezoidal region of interest was defined initially at 12 mM lateral to the midline, 4 mM below the anterior commissure–posterior commissure (AC–PC) plane, and 3 mM behind the midpoint of the AC–PC line. This ROI was adjusted to fit the STN as identified by typical signal characteristics on T2 CUBE imaging. From this starting ROI, fibers were automatically traced using a fractional anisotropy threshold of 0.2, a minimal fiber length of 30 mM, and a curvature threshold of 50°. The resulting tractographically-defined “hyperdirect pathway” was displayed in three dimensions, overlaid on the co-registered T2 and SPGR images. This surface was exported along with the T2 CUBE dataset for use during surgery (A,B,C) to localize the cortical origin of the HDP.
Experimental Protocol
During recordings from the DBS lead, 10 s periods of DBS at different voltages were applied first dorsal to the STN and then within each STN (Figure 1). Patients were instructed to lie still with their eyes open during experimental recordings. Videography and angular velocity sensors attached to the hands and feet were used for confirmation that voluntary movements did not occur during data acquisition.
For stimulation dorsal to STN, the center of electrode 1 of the DBS lead was positioned 1.3–1.5 (mean 1.5) mM dorsal to the STN dorsal border. For stimulation within the STN, the center of electrode 1 of the DBS lead was positioned 2.3–4.0 (mean 2.9) mM ventral to the dorsal STN border, which was equivalent to 35–55% (mean: 49%) of the rostrocaudal span of STN from the dorsal border of the STN (“within” STN), Table 1.
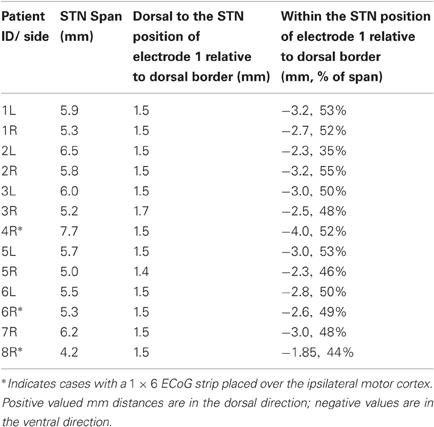
Table 1. Locations of DBS During LFP Recording for each case.
In each location and for each STN, LFPs were first recorded during a 30 s resting baseline segment followed by clinical testing for “adverse effects” (“AEs”) (such as muscle contractions) in response to ramping DBS stimulation voltages from 0 to 3 volts. If muscle contractions were to have occurred above a threshold voltage, then testing would have been performed only with voltages below such a threshold. Ten-second periods of DBS stimulation at 0.25 V, 0.5 V, 1 V, 1.5 V, 2 V, 2.5 V, and 3 V were then presented in a randomized order, with the exception that 1.5 V and 3 V stimulation were not applied to the first two cases (1L and 1R), and 1.5 V was not applied to case 5R within the STN. None of the DBS voltages were repeated for a given hemisphere. A 20 s period with DBS off separated DBS periods so that the LFP power might return to baseline levels (Bronte-Stewart et al., 2009). The recovery period between stimulation trials was 20 s for all datasets except for datasets from one patient who had only 10 s inter-stimulation intervals (cases 1L and 1R).
In the three patients from whom ECoG recording was available, an additional experiment was performed. After MER recording but before implantation of the DBS lead, the microelectrode tip was retracted into the surrounding cannula, and monopolar LFPs were recorded from the cannula tip as described previously (de Solages et al., 2011). These recordings, concurrent with ipsilateral ECoG, were obtained for 90 s in two locations per case: 1 mM dorsal to the dorsal border of the STN, and at the midpoint between the dorsal and ventral borders of the STN (Figure 1).
Data Acquisition
LFP STN signals from the DBS lead were first amplified by an isolated amplifier (BioAmp 100, Axon Instruments, Inc.), modified to a gain of 16, and low and high pass filtered and amplified with a Brownlee Precision 440 Amplifier/filter and an Axon Cyberamp, providing a total gain of 50,000 and a 12-pole Bessel low pass filter at 100 Hz, and high pass at 1 Hz, before digital to analog conversion (Power1401, Cambridge Electronic Design, Ltd., Cambridge, England), and digitized at 1000 Hz. We confirmed that the filtering of the high frequency stimulation artifact did not affect LFP recordings in beta band frequencies by recording from the DBS lead in saline using a surrogate LFP signal from the STN of a PD patient. In saline during HF DBS, the power spectral density (PSD) including total beta power did not change. Cortical signals were measured with differential EEG amplifiers (Nicolet Viking IV, Cardinal Health NeuroCare, Madison, WI) having a gain of 6000 and a two-pole low pass filter at 100 Hz to reduce the stimulus artifact produced by the current pulses delivered to the DBS lead. We verified that the artifact was not saturating the amplifiers prior to filtering by noting that the size of the stimulation artifact in the differential signals tracked the amplitude of the stimulating voltage pulses, thus showing that the amplifiers were behaving linearly.
Data Analysis
LFP data were acquired with Spike 2 version 5 (Cambride Electronic Design, Cambridge, England). Data were exported to MATLAB (7.9, The Mathworks Inc., Natick, MA, USA) and parsed for each recording into 30 s of baseline and 10 s of stimulation at each voltage for the recordings from the DBS lead. Spectrograms from both STN and cortical ECoG recordings were generated using a sliding window multi-taper spectral estimate with 1 s windows, 50% or 90% (Figures 2, 5) overlap, five tapers, and a time-bandwidth product of 3 (Walden and Percival, 1998; Mitra and Bokil, 2008; http://www.chronux.org). PSD estimates used for group statistics (Figure 4) were computed with Hamming-filtered 1.024 s sliding windows with 50% overlap (Welch, 1967; Walden and Percival, 1998). Power from each estimate was then summed in the 13–35 Hz beta band. A ratio was then taken of the beta band power to the total power in the 5–100 Hz band. This ratio was then normalized to the beta power ratio during the pre-DBS baseline period.
where Φ represents the total power in the 5–100 Hz band. A negative value indicates beta attenuation and a positive value indicates an increase in beta.
LFP recordings from the cannula tip in the subset of patients with cortical ECoG electrodes were used for computation of resting coherence between the STN and the motor cortex. Coherence was computed with a sliding window multi-taper estimate with the same parameters as described above. Ninety-five percentage confidence intervals were computed based on a jack-knife permutation (http://www.chronux.org; Mitra and Bokil, 2008).
Grand mean power spectral densities were computed from the baseline periods in each recording location and from the 10 s epoch during 2.5 V DBS in each location. Attenuation curves were computed as the log10 ratio of the PSD during stimulation to the PSD during baseline.
Statistics
Statistics on the relative beta power ratio were calculated at the group level (N = 13 STNs). Because the data recorded dorsal to the STN did not satisfy equal variance and normality tests for parametric analyses, an ANOVA based on ranks with Dunn's correction for multiple comparisons was computed. A repeated measures analyses of variance (ANOVA) with Holm–Sidak corrections for multiple comparisons was computed on the data recorded within the STN because these were parametric.
To determine whether beta power attenuation was voltage-dependent and to compare the degree of voltage-dependence during stimulation dorsal to versus within the STN, linear regression was performed separately for the raw beta power ratio of recordings HF DBS dorsal to and within the STN relative to its baseline for each case (N = 13). Raw beta power was used because relative beta power attenuation was not linear as a function of DBS voltage. The raw beta power ratio was computed according to the following equation:
The difference in slope of these linear fits was assessed with a paired t-test (N = 11 from cases with valid linear fits) to determine whether voltage-dependent beta power attenuation was steeper with stimulation within the STN than with stimulation dorsal to the STN.
Results
DBS-Induced Attenuation of Beta Power in the STN Region
Beta power was attenuated during HF DBS relative to baseline both dorsal to and within STN. Figure 3 displays the LFP spectrograms with HF DBS applied dorsal to (Figure 3A) and within (Figure 3B) the STN from a representative case before, during, and in between 10 s DBS segments at different voltages.
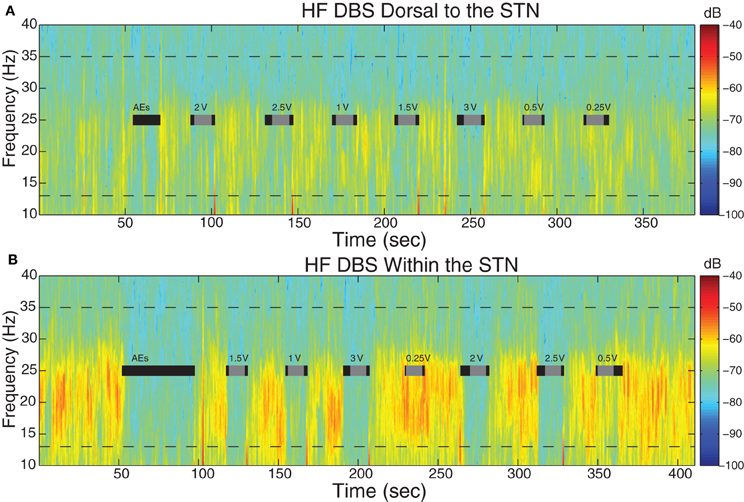
Figure 3. Spectral dynamics of LFPs dorsal to and within the STN. Spectrogram of LFPs during DBS (A) 1.5 mM dorsal to the dorsal border of the STN and (B) within the STN (2.25 mM below dorsal border) from a representative patient (case 2L). Dotted lines demark the 13–35 Hz limits. Gray bars indicate the 10 s period of HF DBS used in beta power calculations, which excluded artifacts at the onset and offset of DBS, and black bars indicate the full time period that HF DBS was on. The bars marked “AEs” demark the period of time when HF DBS was increased from 0 to 3 V to test for adverse clinical effects; these segments were not used in analyses. Note the randomized order of the presentation of HF DBS voltages. The color scale indicates the level of log beta power on a decibel scale and is the same for the spectrograms in panels (A) and (B), demonstrating that there is greater beta power during the off stimulation time segments and greater attenuation within the STN during HF DBS within the STN (B). Note the return of beta power in between periods of HF DBS.
In this case, resting beta power was greater within the STN than dorsal to the STN (p < 0.05). Figure 3B shows that during the “test” ramp of HF DBS within the STN (labeled “AEs”) there was very clear attenuation of beta power, and this was also apparent at other voltages of HF DBS. There also appeared to be attenuation of beta power during HF DBS dorsal to the STN (Figure 3A). We confirmed that beta power during the last 10 s of the inter-stimulation “recovery” periods was not different from baseline (p > 0.05).
The group median beta power and relative beta power (normalized to the total power in the 5–100 Hz band) were attenuated in a voltage-dependent fashion during stimulation both dorsal to and within the STN. Figure 4 illustrates the attenuation of relative beta power as a function of the voltage of HF DBS dorsal to (Figure 4A) and within (Figure 4B) the STN.
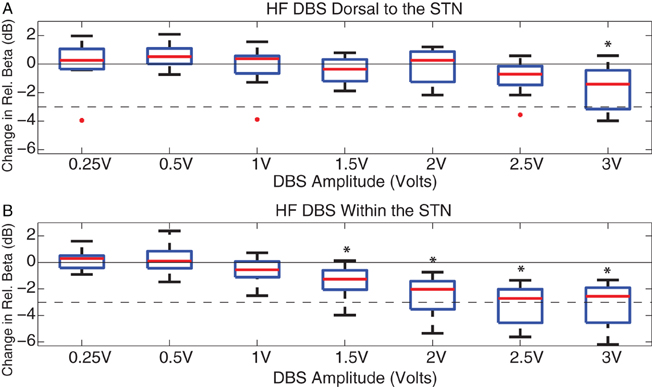
Figure 4. DBS-induced beta attenuation dorsal to and in central STN. Box and whisker plots [median, 25%, 75%, range, and outliers (red dots)] of relative beta attenuation during HF DBS (A) dorsal to and (B) within STN. A ratio was taken between 13 and 35 Hz beta power and 5 and 100 Hz broadband power during stimulation epochs, and then normalized to the baseline beta ratio. The 10log10 power ratio was computed, such that all cases can be compared on a decibel scale. *Indicate a significant difference from baseline with overall p < 0.05 (ANOVA with Holm–Sidak correction). The 50% attenuation level is marked with a dashed line, represented at −3 dB.
HF DBS dorsal to the STN attenuated relative beta power only at 3 V (p < 0.05), whereas HF DBS within the STN attenuated relative beta at voltages ≥ 1.5 V (p < 0.05). At 2.5 V of HF DBS, relative beta was attenuated by a median of only 0.71 dB (decreased by 15% with regard to baseline) during stimulation dorsal to the STN, and was attenuated by a median of 2.72 dB (decreased by 47% with regard to baseline) during stimulation within the STN.
To quantify whether the voltage-dependence of HF DBS induced beta attenuation was steeper within the STN than dorsal to the STN, the attenuation of beta band power (by itself, not relative to broadband attenuation) for each case at each stimulation-recording site were fitted with a regression line. Linear regressions were reasonable models for 10 cases (R2 from 0.61 to 0.94, mean: 0.80 dorsal to the STN; R2 from 0.63 to 0.97, mean: 0.83 within the STN), but not for case 4L dorsal to the STN (R2 = 0.002) or case 7R dorsal to the STN (R2 = 0.161), which were excluded from the linear regression analysis. For each of the remaining 11 cases, the slopes of the linear fits both dorsal to and within the STN were negative and significantly different from 0 (p < 0.05). The slopes ranged from −0.34 to −3.6 dB/V during stimulation dorsal to the STN, and from −0.9 to −5.9 dB/V within the STN. The slopes dorsal to and within the STN of these 11 cases were compared with a paired t-test. The paired t-test indicated that the voltage dependence of beta attenuation was greater during HF DBS within than dorsal to the STN (p < 0.05).
Power outside the 13–35 Hz band was also attenuated relative to baseline (for example, Figure 3). Figure 5 demonstrates the grand mean PSD and its attenuation across all cases both during the baseline period before HF DBS and during 10 s of 2.5 V DBS including 95% confidence limits on the spectral estimates.
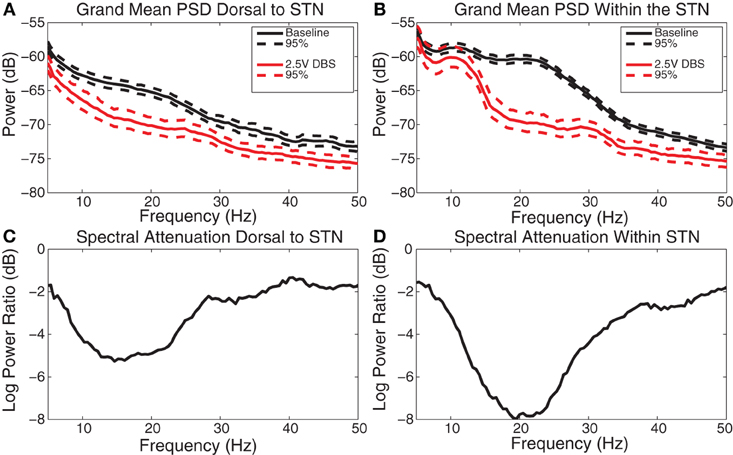
Figure 5. DBS-induced spectral attenuation. (A) Group mean power spectral density before (black) and during (red) 2.5 V DBS applied dorsal to the STN with 95% confidence limits. (B) Group mean power spectral density before (black) and during (red) 2.5 V DBS applied within the STN with 95% confidence limits. (C) Log power ratio (dB) of spectral power during 2.5 V DBS dorsal to the STN to spectral power at baseline. (D) Log power ratio (dB) of spectral power during 2.5 V DBS within the STN to spectral power at baseline.
During HF DBS dorsal to the STN, significant attenuation occurred at frequencies greater than 5 Hz dorsal to the STN, with the greatest average attenuation occurring at 13 Hz (Figures 5A and C). During HF DBS within the STN, average spectral power was attenuated at frequencies above 12 Hz, with a maximum at 18 Hz (Figures 5B and D). The degree of beta attenuation was greater during HF DBS within the STN than dorsal to the STN (Figures 5C and D) (p < 0.05).
STN DBS-Induced Attenuation of Beta Hypersynchrony in Ipsilateral Motor Cortex
Beta power was attenuated on some ECoG channels during epochs of STN HF DBS. Figure 6 displays the spectrograms from a representative example (cortical 2–3 from case 6) during HF DBS applied dorsal to (Figure 6A) and within (Figure 6B) the STN before, during, and in between 10 s DBS segments at different voltages.
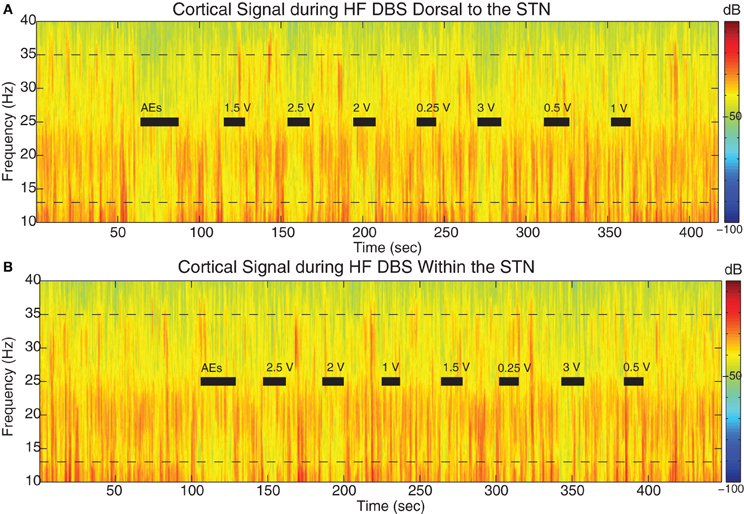
Figure 6. STN DBS-induced beta attenuation in motor cortex. Spectrogram of single cortical ECoG channel during STN DBS (A) 1.5 mM dorsal to the dorsal border of the STN and (B) within the STN (2.6 mM below dorsal border) from a representative patient (case 6). Black bars indicate the full time period that HF DBS was on. The bars marked “AEs” demark the period of time when HF DBS was increased from 0 to 3 V to test for adverse clinical effects; these segments were not used in analyses. Note the randomized order of the presentation of HF DBS voltages. The color scale indicates the level of log beta power on a decibel scale and is the same for the spectrograms in panels (A) and (B), but is different from the scale in Figure 3. Note the power rebound when STN DBS is turned off.
Coherences between STN regions and ipsilateral motor cortex were computed between monopolar LFP recordings from the MER cannula and bipolar ECoG recordings that were acquired for 90 s while patients were at rest. There was significant coherence between cortex and each STN site (dorsal to and within) in at least one cortical location for each patient, and this occurred in the high beta (~25–35 Hz) frequency range, Figures 7 and 8A,C; Figures A1 and A2. All coherence values rising above the 95% confidence limit based on bootstrapping are significant (p < 0.05).
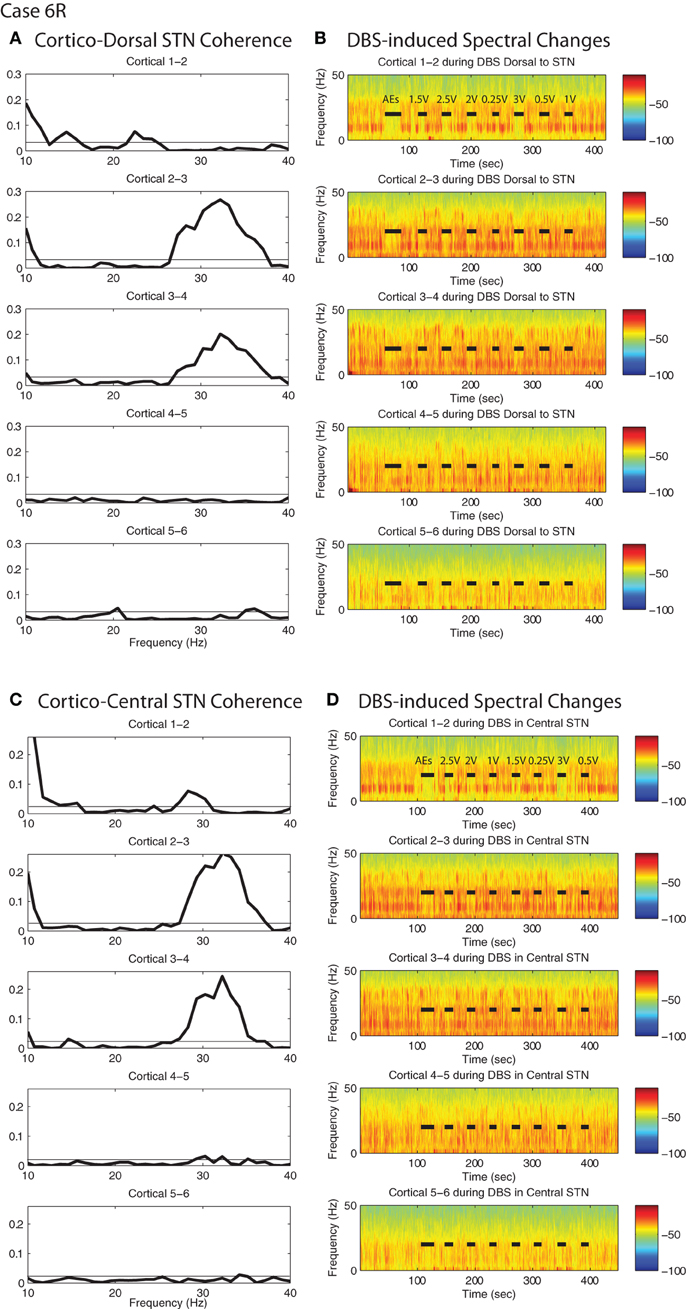
Figure 7. DBS-induced spectral attenuation in ipsilateral motor cortex. Magnitude of coherence between each cortical bipolar pair and the STN cannula (A) 1 mM dorsal to STN, (C) central STN of a representative patient (case 6R). Spectrograms of motor cortex ECoG during HF DBS (B) 1.5 mM dorsal to the STN, and (D) within the central STN. Black bars in (B) and (D) indicate time periods when DBS was on. Rows represent bipolar pairs from the ECoG 1 × 6 electrode strip. For this case (6R), ECoG electrode #3 was estimated to be closest to the purported efferent projection site of the hyperdirect pathway.
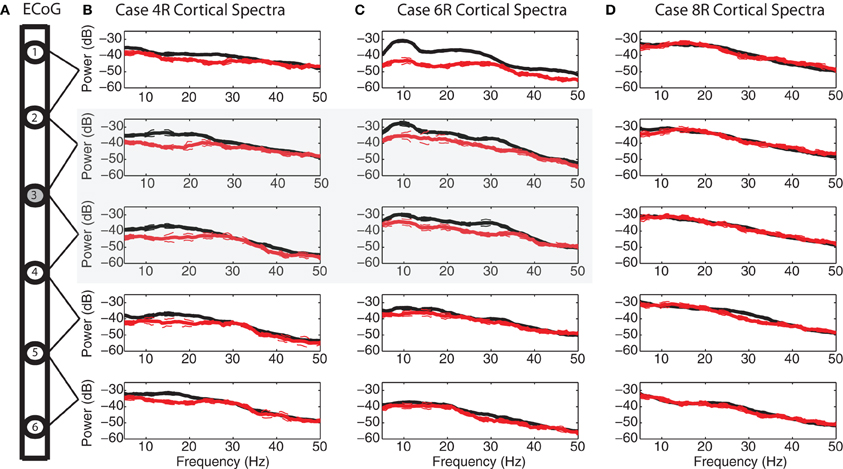
Figure 8. Spatial specificity of spectral attenuation. (A) Schematic of electrode array. Power spectral densities with 95% confidence limits before (black) and during (red) 2.5 V DBS within the STN for each ECoG bipolar pair for (B) case 4R, (C) case 6R, and (D) case 8R. Cortical electrode #3 was placed over the efferent projection site of the hyperdirect pathway for both case 4R and case 6R. For case 8R, the patient's ECoG strip ended up ~11 mM lateral to the target, in a non-specific area of motor cortex. Four out of five bipolar pairs for this patient demonstrated no spectral modulation during STN HF DBS. The spectrograms for this case are shown in Figures A2.
For the two patients with accurate ECoG placement, coherence was greater at the bipolar ECoG pairs that were calculated to be at the DTI-determined origin of the HDP than at the most distal cortical pairs, Figures 7A and C; Figure A1. Cortical alpha and beta band power appeared to be greater at these bipolar pairs. During DBS applied dorsal to (Figure 7B) and within (Figure 7D) the STN, there appeared to be attenuation of low frequency power in a similar spatial distribution, being more evident at (case 4R) or adjacent to (case 6R) the estimated origin of the HDP.
During STN DBS, spectral power in the 5–35 Hz band of the motor cortex was attenuated from its pre-DBS baseline value during DBS amplitudes of 1 V and greater for the two cases with successful targeting of the putative origin of the HDP (Figures 8B,C, gray region; Figure A1). For the case in which the ECoG strip was placed ~1 cm lateral to the intended target, attenuation of low frequency power was not evident on four out of five ECoG electrode pairs, and only subtly for the remaining bipolar pair (Figure 8D). Spectrograms from non-specific areas of motor cortex for case 8R are depicted in Figure A2.
Discussion
Voltage-Dependent Attenuation of Local Beta Power During STN HF DBS
The prevalent hypothesis that beta hypersynchrony is a pathophysiological marker of PD motor signs is supported by correlations between improved mobility and attenuated beta hypersynchrony after therapeutic doses of medication (Kuhn et al., 2006, 2009; Weinberger et al., 2006; Ray et al., 2008). The attenuation of beta hypersynchrony during HF DBS would lend further evidence in support of this hypothesis because HF DBS also improves mobility in PD (Deuschl et al., 2006; Kuhn et al., 2008; Ray et al., 2008). Several studies have shown that beta power is attenuated transiently after periods of HF DBS (Wingeier et al., 2006; Kuhn et al., 2008; Bronte-Stewart et al., 2009), but until recently it was not feasible to measure LFPs in beta frequencies during DBS due to HF stimulation artifacts. One study measured LFPs in the STN during HF DBS but reported no change in beta power during HF DBS (Rossi et al., 2008). Some PD patients were on medication and in some cases there was no evidence of a beta peak at rest, suggesting a possible floor effect. In a follow-up study by the same group, some patients off medication demonstrated a decrease in beta power whereas others did not (Giannicola et al., 2010; Rosa et al., 2011). By contrast, Eusebio and colleagues (Eusebio et al., 2010) recorded LFPs during a continuous increase of voltage of HF DBS and showed a significant attenuation of the power of beta band peaks during HF DBS at clinically therapeutic voltage levels but not at voltages below 1.5 V. Longer durations of HF DBS in the STN can cause longer periods of beta attenuation after DBS is turned-off (Kuhn et al., 2005; Wingeier et al., 2006; Bronte-Stewart et al., 2009), so cumulative attenuation after prolonged periods of DBS may have contributed to the “dose-dependent” response in the Eusebio study. The design of the present study allowed 20 s for beta power to return to baseline levels in the periods between short (10 s) stimulation segments and we confirmed that this was sufficient time for the beta band power to return to baseline values. We believe that the randomized presentation of HF DBS voltages interleaved with recovery periods in our study disambiguated voltage-dependent and duration-dependent effects. Of note, we confirmed that HF DBS in saline did not alter an injected surrogate LFP signal. However, it has been shown that during HF DBS in brain tissue, there may be non-synaptic changes in the local milieu, such as changes in charge conductance at the electrode-tissue interface (Merrill et al., 2005), increased local extra-cellular potassium which might cause neuronal depolarization block (Bikson et al., 2001), and possible changes in neural tissue function from local heating effects (Elwassif et al., 2006). It is outside the scope of this study to determine the degree of non-synaptic effects versus “neural” effects, such as axonal activation and attenuation of neural synchrony, of HF DBS in brain tissue close to the stimulating DBS electrode. We believe that this will be important to investigate if local LFP signals are to be used to guide demand-based DBS in the future.
Voltage-Dependent Beta Attenuation is Greater During HF DBS within than Dorsal to the STN
In this study, the voltage-dependent attenuation of beta power in the vicinity of HF DBS was greater when HF DBS was applied within the STN than dorsal to the STN based on statistics at the group level. Of note, although HF DBS was applied at a mean distance of 1.5 mM dorsal to the dorsal border of STN, the center of electrode 0 lay within the most dorsal aspect of the STN and the LFP recordings were bipolar recordings from electrodes 0 to 2. In contrast, for the “within STN” condition, the centers of both electrodes were within the physiologically determined borders of the STN. Direct comparison between LFP measurements and DBS responsiveness in or near white matter tracts dorsal to the STN versus in gray matter of the STN is difficult to interpret, and the present study was not designed to analyze the orientations and locations of current sources contributing to the measured LFPs. Future modeling studies could address whether the reported difference between LFP responsiveness to HF DBS dorsal to and within the STN is due to differences in the way these different types of brain tissue interact with electrical fields.
Physiological studies have suggested the site of optimal STN HF DBS may be at the site of maximum beta hypersynchrony and/or sites of maximal coherence in the beta band within the sensorimotor network (Marsden et al., 2001; Williams et al., 2002; Reck et al., 2009; Ince et al., 2010). The site of maximal beta hypersynchrony, however, is under debate and has been difficult to resolve due to methodological differences (Kuhn et al., 2005; Holdefer et al., 2010; Yoshida et al., 2010; Zaidel et al., 2010; de Solages et al., 2011). Our recent study demonstrated that beta hypersynchrony was maximal within STN (de Solages et al., 2011) from LFPs recorded from a 1 mM long macroelectrode in 1 mM increments along a dorsoventral axis of the STN. Specifically, the depth of maximal beta hypersynchrony was between 1.5 and 4.5 mM below the dorsal STN border in 17/18 PD cases. The present study, by utilizing the DBS probe itself for LFP recordings, measures activity from a volume of neural activity significantly larger than the volume recorded by de Solages et al. (de Solages et al., 2011). Nevertheless, these studies together suggest that the central STN may be the location of greater pathological signaling in PD. The question as to whether beta hypersynchrony and its DBS-induced attenuation correspond to the location of maximally clinically efficacious stimulation remains to be determined.
Several anatomically based imaging and modeling studies have suggested that dorsal STN or the region dorsal to the STN may be the optimal site for STN HF DBS (Saint-Cyr et al., 2002; Voges et al., 2002; Hamel et al., 2003; Yelnik et al., 2003; Herzog et al., 2004; Plaha et al., 2006; Butson et al., 2007; Maks et al., 2009). A recent study that combined clinical outcome data with a computational model of the site of HF DBS suggested that the stimulated regions associated with a greater than 75% improvement in rigidity and/or bradykinesia lay in the white matter dorsal to the STN (Butson et al., 2011). There are many reasons why this might be an effective location for HF DBS. This region consists largely of axons including efferents from the STN and zona incerta (Carpenter et al., 1981; Ricardo, 1981; Parent and Hazrati, 1995b), pallidal (Groenewegen and Berendse, 1990), and cortical afferents to the STN (Monakow et al., 1978; Nambu et al., 1996, 1997), and fibers of passage including the lenticular fasciculus, which carries the pallido-thalamic (Severin et al., 1976) and pallido-pedunculopontine (Lee et al., 2000) afferents. Existing evidence suggests that the therapeutic effect of HF DBS at pulse widths as low as 60 μs is probably through activation of myelinated axons (Ranck, 1975; Rizzone et al., 2001). Thus, HF DBS dorsal to the STN could affect the PD abnormal sensorimotor network through any or all of three contributing circuits: the STN efferents, the pallidal efferents (including to the brainstem), and the hyperdirect cortico-STN circuit.
Spatially-Specific Power Attenuation in Ipsilateral Motor Cortex During STN DBS
The present study demonstrated spatially-specific resting beta band coherence between the STN region and the motor cortex, with beta band coherence greatest at the electrodes close to the tractographically-derived origin of the HDP. Neural synchrony in motor cortex was attenuated during STN HF DBS in both patients with accurate ECoG placement over the HDP efferent projection site, with spectral attenuation greater at the bipolar pairs corresponding to or neighboring (1 cm away from) that with maximal resting coherence. The attenuation of neural synchrony was evident during the application of HF DBS 1.5 mM dorsal to the STN and during HF DBS within central STN. In the patient whose ECoG strip was placed ~1 cm lateral to the target, all but one bipolar pair failed to show attenuation in low frequency cortical rhythms during STN DBS. These findings support the hypothesis that the STN may act as a “node” where localized DBS can affect distal but functionally connected parts of the sensorimotor network.
The use of subdural cortical surface electrodes in this study has enabled examination of the cortico-basal ganglia network with finer spatial resolution than previous studies. The demonstration of resting beta band coherence between STN and some subdural cortical surface electrodes but not others, elucidates an underlying spatial specificity of the beta band coherence previously examined with frontal scalp EEG electrodes (Marsden et al., 2001; Williams et al., 2002; Fogelson et al., 2006; Lalo et al., 2008). In both of the present cases with accurate ECoG targeting, the DTI identified tracts originated in premotor and/or primary motor cortex. Our results are consistent with recent MEG studies that used beamforming to localize beta band coherence between STN and the ipsilateral premotor and sensorimotor cortices (Hirschmann et al., 2010; Litvak et al., 2011). These and our results suggest that there may be nodes with greater hypersynchrony within the cortico-basal ganglia network. These findings, coupled with modeling studies, could help guide the development of second-generation DBS electrode designs that more finely control the spatial spread of electrical stimulation to target nodes within the network and not to surrounding regions.
The finding that motor cortex rhythms were attenuated either during dorsal STN HF DBS or during central STN HF DBS might explain a mechanism of action for clinically effective HF DBS dorsal to the STN (Saint-Cyr et al., 2002; Yelnik et al., 2003; Herzog et al., 2004; Plaha et al., 2006; Butson et al., 2007; Maks et al., 2009; Hilliard et al., 2011) and, alternatively, within the STN (Yelnik et al., 2003; Ince et al., 2010; Hilliard et al., 2011; Mera et al., 2011; Paek et al., 2011). The determination of optimal location of HF DBS is multifactorial, taking into account each patient's particular symptom complex as well as the sometimes dynamic balance between symptom reduction and side effects. One study of cortically-evoked potentials demonstrated that the amplitude of the induced potential was higher in response to ventral than dorsal STN stimulation; however, the contact chosen for clinical efficacy differed from the contact that produced a large cortical response (MacKinnon et al., 2005). Yet another study demonstrated that coherence between motor cortex and the STN was greater for caudal than rostrally positioned DBS leads (Fogelson et al., 2006). A separate study demonstrated variability of the location within STN of maximal beta coherence but nonetheless showed correlation between this location and the clinically chosen contact (Marsden et al., 2001). It still remains to be seen whether STN-cortical coherence and/or attenuation of beta hypersynchrony could be pathophysiological markers with predictive power about the topography of clinically efficacious DBS, or whether they are merely epiphenomena.
How might STN HF DBS be suppressing activity in the motor cortex? Both human EEG measurements (Ashby et al., 2001; Baker et al., 2002) and neurophysiology recordings from animal models of PD (Maurice et al., 1998; Li et al., 2007; Gradinaru et al., 2009) have demonstrated that STN HF DBS can antidromically activate cortex. Intracellular recordings from rodents demonstrated that the antidromic activation of deep layers of cortex could spread superficially and suppress cortical rhythms in the 0.5–4 Hz and 8–20 Hz bands in superficial layers (Li et al., 2007). In the present study, the relative contributions of antidromic activation of cortex via the HDP and orthodromic activation via the pallido-thalamo-cortical pathways could not be reliably separated, since the high frequency chosen for stimulation (185 Hz) precluded the possibility of measuring fast response latencies. However, the fact that beta attenuation was maximal in the vicinity of the putative origin of the HDP supports the idea of antidromic activation as a possible mechanism. It is well established that the neocortex is comprised of networks of excitatory and inhibitory activity (Douglas and Martin, 2004; Haider et al., 2006). The spread of stimulation and resulting suppression of synchronous activity might result from inhibition through local microcircuits and resonance at the circuit level (Freeman, 1975; Li et al., 2007).
To summarize, the suppression of local beta power during STN HF DBS was “dose-dependent” based on voltage, having controlled for duration effects of DBS. The local attenuation of beta power during HF DBS both dorsal to the STN and within the STN is consistent with therapeutic effects of HF DBS in both locations, although contibutions to the observed local signal attenuation may also come from non-synaptic electrode interface and local tissue changes. The spatially-specific suppression of beta hypersynchrony in the motor cortex during STN HF DBS was most likely propagated antidromically or orthodromically through corticobasalganglionic neural pathways and supports the hypothesis that DBS may treat Parkinsonism by reducing excessive synchrony in the sensorimotor network. These results could support research and development of “smart” stimulators that provide spatially targeted stimulation based on real-time readout of neural signals.
Conflict of Interest Statement
Diane Whitmer, Bruce Hill, Camille de Solages, and Hong Yu have none to report. Jaimie M. Henderson and Helen Bronte-Stewart have received teaching honoraria from Medtronic.
Acknowledgments
The authors would like to thank the patients who participated in this study for the donation of their time. Diane Whitmer would like to thank Phil Edmonds, Zack Booth Simpson, and Brett Wingeier for useful discussions pertaining to this work.
Funding
Support for this study was provided by the Robert and Ruth Halperin Foundation, John A. Blume Foundation and Helen M. Cahill Award for Research in Parkinson's Disease.
References
Albin, R. L., Young, A. B., and Penney, J. B. (1989). The functional anatomy of basal ganglia disorders. Trends Neurosci. 12, 366–375.
Alexander, G. E., DeLong, M. R., and Strick, P. L. (1986). Parallel organization of functionally segregated circuits linking basal ganglia and cortex. Annu. Rev. Neurosci. 9, 357–381.
Ashby, P., Paradiso, G., Saint-Cyr, J. A., Chen, R., Lang, A. E., and Lozano, A. M. (2001). Potentials recorded at the scalp by stimulation near the human subthalamic nucleus. Clin. Neurophysiol. 112, 431–437.
Baker, K. B., Montgomery, E. B. Jr., Rezai, A. R., Burgess, R., and Luders, H. O. (2002). Subthalamic nucleus deep brain stimulus evoked potentials: physiological and therapeutic implications. Mov. Disord. 17, 969–983.
Bergman, H., Feingold, A., Nini, A., Raz, A., Slovin, H., Abeles, M., and Vaadia, E. (1998). Physiological aspects of information processing in the basal ganglia of normal and parkinsonian primates. Trends Neurosci. 21, 32–38.
Bikson, M., Lian, J., Hahn, P. J., Stacey, W. C., Sciortino, C., and Durand, D. M. (2001). Suppression of epileptiform activity by high frequency sinusoidal fields in rat hippocampal slices. J. Physiol. 531, 181–191.
Bronte-Stewart, H., Barberini, C., Koop, M. M., Hill, B. C., Henderson, J. M., and Wingeier, B. (2009). The STN beta-band profile in Parkinson's disease is stationary and shows prolonged attenuation after deep brain stimulation. Exp. Neurol. 215, 20–28.
Bronte-Stewart, H., Louie, S., Batya, S., and Henderson, J. M. (2010). Clinical motor outcome of bilateral subthalamic nucleus deep-brain stimulation for Parkinson's disease using image-guided frameless stereotaxy. Neurosurgery 67, 1088–1093.
Brown, P., Oliviero, A., Mazzone, P., Insola, A., Tonali, P., and Di Lazzaro, V. (2001). Dopamine dependency of oscillations between subthalamic nucleus and pallidum in Parkinson's disease. J. Neurosci. 21, 1033–1038.
Butson, C. R., Cooper, S. E., Henderson, J. M., and McIntyre, C. C. (2007). Patient-speciftic analysis of the volume of tissue activated during deep brain stimulation. Neuroimage 34, 661–670.
Butson, C. R., Cooper, S. E., Henderson, J. M., Wolgamuth, B., and McIntyre, C. C. (2011). Probabilistic analysis of activation volumes generated during deep brain stimulation. Neuroimage 54, 2096–2104.
Carpenter, M. B., Carleton, S. C., Keller, J. T., and Conte, P. (1981). Connections of the subthalamic nucleus in the monkey. Brain Res. 224, 1–29.
Cassidy, M., Mazzone, P., Oliviero, A., Insola, A., Tonali, P., Di Lazzaro, V., and Brown, P. (2002). Movement-related changes in synchronization in the human basal ganglia. Brain 125, 1235–1246.
Chen, C. C., Pogosyan, A., Zrinzo, L. U., Tisch, S., Limousin, P., Ashkan, K., Yousry, T., Hariz, M. I., and Brown, P. (2006). Intra-operative recordings of local field potentials can help localize the subthalamic nucleus in Parkinson's disease surgery. Exp. Neurol. 198, 214–221.
Courtemanche, R., Fujii, N., and Graybiel, A. M. (2003). Synchronous, focally modulated beta-band oscillations characterize local field potential activity in the striatum of awake behaving monkeys. J. Neurosci. 23, 11741–11752.
Deuschl, G., Schade-Brittinger, C., Krack, P., Volkmann, J., Schäfer, H., Bötzel, K., Daniels, C., Deutschländer, A., Dillmann, U., Eisner, W., Gruber, D., Hamel, W., Herzog, J., Hilker, R., Klebe, S., Kloß, M., Koy, J., Krause, M., Kupsch, A., Lorenz, D., Lorenzl, S., Mehdorn, H. M., Moringlane, J. R., Oertel, W., Pinsker, M. O., Reichmann, H., Reuß, A., Schneider, G-H., Schnitzler, A., Steude, U., Sturm, V., Timmermann, L., Tronnier, V., Trottenberg, T., Wojtecki, L., Wolf, E., Poewe, W., and Voges, J. (2006). A randomized trial of deep-brain stimulation for Parkinson's disease. N. Engl. J. Med. 355, 896–908.
de Solages, C., Hill, B. C., Koop, M. M., Henderson, J. M., and Bronte-Stewart, H. (2010). Bilateral symmetry and coherence of subthalamic nuclei beta band activity in Parkinson's disease. Exp. Neurol. 221, 260–266.
de Solages, C., Hill, B. C., Yu, H., Henderson, J. M., and Bronte-Stewart, H. (2011). Maximal subthalamic beta hypersynchrony of the local field potential in Parkinson's disease is located in the central region of the nucleus. J. Neurol. Neurosurg. Psychiatry 82, 1387–1389.
Douglas, R. J., and Martin, K. A. (2004). Neuronal circuits of the neocortex. Annu. Rev. Neurosci. 27, 419–451.
Elwassif, M. M., Kong, Q., Vazquez, M., and Biksom, M. (2006). Bio-heat transfer model of deep brain stimulation-induced temperature changes. J. Neural Eng. 3, 306–315.
Eusebio, A., Thevathasan, W., Doyle Gaynor, L., Pogosyan, A., Bye, E., Foltynie, T., Zrinzo, L., Ashkan, K., Aziz, T., and Brown, P. (2010). Deep brain stimulation can suppress pathological synchronisation in parkinsonian patients. J. Neurol. Neurosurg. Psychiatry 82, 569–573.
Fogelson, N., Williams, D., Tijssen, M., van Bruggen, G., Speelman, H., and Brown, P. (2006). Different functional loops between cerebral cortex and the subthalmic area in Parkinson's disease. Cereb. Cortex 16, 64–75.
Giannicola, G., Marceglia, S., Rossi, L., Mrakic-Sposta, S., Rampini, P., Tamma, F., Cogiamanian, F., Barbieri, S., and Priori, A. (2010). The effects of levodopa and ongoing deep brain stimulation on subthalamic beta oscillations in Parkinson's disease. Exp. Neurol. 226, 120–127.
Gradinaru, V., Mogri, M., Thompson, K. R., Henderson, J. M., and Deisseroth, K. (2009). Optical deconstruction of parkinsonian neural circuitry. Science 324, 354–359.
Groenewegen, H. J., and Berendse, H. W. (1990). Connections of the subthalamic nucleus with ventral striatopallidal parts of the basal ganglia in the rat. J. Comp. Neurol. 294, 607–622.
Haider, B., Duque, A., Hasenstaub, A. R., and McCormick, D. A. (2006). Neocortical network activity in vivo is generated through a dynamic balance of excitation and inhibition. J. Neurosci. 26, 4535–4545.
Hamel, W., Fietzek, U., Morsnowski, A., Schrader, B., Herzog, J., Weinert, D., Pfister, G., Muller, D., Volkmann, J., Deuschl, G., and Mehdorn, H. M. (2003). Deep brain stimulation of the subthalamic nucleus in Parkinson's disease: evaluation of active electrode contacts. J. Neurol. Neurosurg. Psychiatry 74, 1036–1046.
Henderson, J. M., and Hill, B. C. (2008). Fluoroscopic registration and localization for image-guided cranial neurosurgical procedures: a feasibility study. Stereotact. Funct. Neurosurg. 86, 271–277.
Herzog, J., Fietzek, U., Hamel, W., Morsnowski, A., Steigerwald, F., Schrader, B., Weinert, D., Pfister, G., Muller, D., Mehdorn, H. M., Deuschl, G., and Volkmann, J. (2004). Most effective stimulation site in subthalamic deep brain stimulation for Parkinson's disease. Mov. Disord. 19, 1050–1054.
Hilliard, J. D., Frysinger, R. C., and Elias, W. J. (2011). Effective subthalamic nucleus deep brain stimulation sites may differ for tremor, bradykinesia and gait disturbances in Parkinson's disease. Stereotact. Funct. Neurosurg. 89, 357–364.
Hirschmann, J., Ozkurt, T. E., Butz, M., Homburger, M., Elben, S., Hartmann, C. J., Vesper, J., Wojtecki, L., and Schnitzler, A. (2010). Distinct oscillatory STN-cortical loops revealed by simultaneous MEG and local field potential recordings in patients with Parkinson's disease. Neuroimage 55, 1159–1168.
Holdefer, R. N., Cohen, B. A., and Greene, K. A. (2010). Intraoperative local field recording for deep brain stimulation in Parkinson's disease and essential tremor. Mov. Disord. 25, 2067–2075.
Holloway, K. L., Gaede, S. E., Starr, P. A., Rosenow, J. M., Ramakrishnan, V., and Henderson, J. M. (2005). Frameless stereotaxy using bone fiducial markers for deep brain stimulation. J. Neurosurg. 103, 404–413.
Ince, N. F., Gupte, A., Wichmann, T., Ashe, J., Henry, T., Bebler, M., Eberly, L., and Abosch, A. (2010). Selection of optimal programming contacts based on local field potential recordings from subthalamic nucleus in patients with Parkinson's disease. Neurosurgery 67, 390–397.
Kitai, S. T., and Deniau, J. M. (1981). Cortical inputs to the subthalamus: intracellular analysis. Brain Res. 214, 411–415.
Kuhn, A. A., Kempf, F., Brucke, C., Gaynor Doyle, L., Martinez-Torres, I., Pogosyan, A., Trottenberg, T., Kupsch, A., Schneider, G. H., Hariz, M. I., Vandenberghe, W., Nuttin, B., and Brown, P. (2008). High-frequency stimulation of the subthalamic nucleus suppresses oscillatory beta activity in patients with Parkinson's disease in parallel with improvement in motor performance. J. Neurosci. 28, 6165–6173.
Kuhn, A. A., Kupsch, A., Schneider, G. H., and Brown, P. (2006). Reduction in subthalamic 8-35 Hz oscillatory activity correlates with clinical improvement in Parkinson's disease. Eur. J. Neurosci. 23, 1956–1960.
Kuhn, A. A., Trottenberg, T., Kivi, A., Kupsch, A., Schneider, G. H., and Brown, P. (2005). The relationship between local field potential and neuronal discharge in the subthalamic nucleus of patients with Parkinson's disease. Exp. Neurol. 194, 212–220.
Kuhn, A. A., Tsui, A., Aziz, T., Ray, N., Brucke, C., Kupsch, A., Schneider, G. H., and Brown, P. (2009). Pathological synchronisation in the subthalamic nucleus of patients with Parkinson's disease relates to both bradykinesia and rigidity. Exp. Neurol. 215, 380–387.
Lalo, E., Thobois, S., Sharott, A., Polo, G., Mertens, P., Pogosyan, A., and Brown, P. (2008). Patterns of bidirectional communication between cortex and basal ganglia during movement in patients with Parkinson disease. J. Neurosci. 28, 3008–3016.
Lee, M. S., Rinne, J. O., and Marsden, C. D. (2000). The pedunculopontine nucleus: its role in the genesis of movement disorders. Yonsei Med. J. 41, 167–184.
Li, S., Arbuthnott, G. W., Jutras, M. J., Goldberg, J. A., and Jaeger, D. (2007). Resonant antidromic cortical circuit activation as a consequence of high-frequency subthalamic deep-brain stimulation. J. Neurophysiol. 98, 3525–3537.
Litvak, V., Jha, A., Eusebio, A., Oostenveld, R., Foltynie, T., Limousin, P., Zrinzo, L., Hariz, M. I., Friston, K., and Brown, P. (2011). Resting oscillatory cortico-subthalamic connectivity in patients with Parkinson's disease. Brain 134, 359–374.
MacKinnon, C. D., Webb, R. M., Silberstein, P., Tisch, S., Asselman, P., Limousin, P., and Rothwell, J. C. (2005). Stimulation through electrodes implanted near the subthalamic nucleus activates projections to motor areas of cerebral cortex in patients with Parkinson's disease. Eur. J. Neurosci. 21, 1394–1402.
Magill, P. J., Sharott, A., Bolam, J. P., and Brown, P. (2006). Delayed synchronization of activity in cortex and subthalamic nucleus following cortical stimulation in the rat. J. Physiol. 574, 929–946.
Maks, C. B., Butson, C. R., Walter, B. L., Vitek, J. L., and McIntyre, C. C. (2009). Deep brain stimulation activation volumes and their association with neurophysiological mapping and therapeutic outcomes. J. Neurol. Neurosurg. Psychiatry 80, 659–666.
Marsden, J. F., Limousin-Dowsey, P., Ashby, P., Pollak, P., and Brown, P. (2001). Subthalamic nucleus, sensorimotor cortex and muscle interrelationships in Parkinson's disease. Brain 124, 378–388.
Maurice, N., Deniau, J. M., Menetrey, A., Glowinski, J., and Thierry, A. M. (1998). Prefrontal cortex-basal ganglia circuits in the rat: involvement of ventral pallidum and subthalamic nucleus. Synapse 29, 363–370.
Mera, T., Vitek, J. L., Alberts, J. L., and Giuffrida, J. P. (2011). Kinematic optimization of deep brain stimulation across multiple motor symptoms in Parkinson's disease. J. Neurosci. Methods 198, 280–286.
Merrill, D. R., Bikson, M., and Jefferys, J. G. R. (2005). Electrical stimulation of excitable tissue: design of safe and efficacious protocols. J. Neurosci. Methods 141, 171–198.
Monakow, K. H., Akert, K., and Kunzle, H. (1978). Projections of the precentral motor cortex and other cortical areas of the frontal lobe to the subthalamic nucleus in the monkey. Exp. Brain Res. 33, 395–403.
Nambu, A., Takada, M., Inase, M., and Tokuno, H. (1996). Dual somatotopical representations in the primate subthalamic nucleus: evidence for ordered but reversed body-map transformations from the primary motor cortex and the supplementary motor area. J. Neurosci. 16, 2671–2683.
Nambu, A., Tokuno, H., Inase, M., and Takada, M. (1997). Corticosubthalamic input zones from forelimb representations of the dorsal and ventral divisions of the premotor cortex in the macaque monkey: comparison with the input zones from the primary motor cortex and the supplementary motor area. Neurosci. Lett. 239, 13–16.
Nini, A., Feingold, A., Slovin, H., and Bergman, H. (1995). Neurons in the globus pallidus do not show correlated activity in the normal monkey, but phase-locked oscillations appear in the MPTP model of parkinsonism. J. Neurophysiol. 74, 1800–1805.
Paek, S. H., Lee, J. Y., Kim, H. J., Kang, D., Lim, Y. H., Kim, M. R., Kim, C., Jeon, B. S., and Kim, D. G. (2011). Electrode position and the clinical outcome after bilateral subthalamic nucleus stimulation. J. Korean Med. Sci. 26, 1344–1355.
Parent, A., and Hazrati, L. N. (1995a). Functional anatomy of the basal ganglia. I. The cortico-basal ganglia-thalamo-cortical loop. Brain Res. Brain Res. Rev. 20, 91–127.
Parent, A., and Hazrati, L. N. (1995b). Functional anatomy of the basal ganglia. II. The place of subthalamic nucleus and external pallidum in basal ganglia circuitry. Brain Res. Brain Res. Rev. 20, 128–154.
Plaha, P., Ben-Shlomo, Y., Patel, N. K., and Gill, S. S. (2006). Stimulation of the caudal zona incerta is superior to stimulation of the subthalamic nucleus in improving contralateral parkinsonism. Brain 129, 1732–1747.
Ranck, J. J. (1975). Which elements are excited in electrical stimulation of mammalian central nervous system: a review. Brain Res. 98, 417–440.
Raz, A., Frechter-Mazar, V., Feingold, A., Abeles, M., Vaadia, E., and Bergman, H. (2001). Activity of pallidal and striatal tonically active neurons is correlated in mptp-treated monkeys but not in normal monkeys. J. Neurosci. 21, RC128.
Raz, A., Vaadia, E., and Bergman, H. (2000). Firing patterns and correlations of spontaneous discharge of pallidal neurons in the normal and the tremulous 1-methyl-4-phenyl-1,2,3,6-tetrahydropyridine vervet model of parkinsonism. J. Neurosci. 20, 8559–8571.
Ray, N. J., Jenkinson, N., Wang, S., Holland, P., Brittain, J. S., Joint, C., Stein, J. F., and Aziz, T. (2008). Local field potential beta activity in the subthalamic nucleus of patients with Parkinson's disease is associated with improvements in bradykinesia after dopamine and deep brain stimulation. Exp. Neurol. 213, 108–113.
Reck, C., Florin, E., Wojtecki, L., Groiss, S., Voges, J., Sturm, V., Schnitzler, A., and Timmermann, L. (2009). Differential distribution of coherence between beta-band subthalamic oscillations and forearm muscles in Parkinson's disease during isometric contraction. Clin. Neurophysiol. 120, 1601–1609.
Ricardo, J. A. (1981). Efferent connections of the subthalamic region in the rat. II. The zona incerta. Brain Res. 214, 43–60.
Rizzone, M., Lanotte, M., Bergamasco, B., Tavella, A., Torre, E., Faccani, G., Melcarne, A., and Lopiano, L. (2001). Deep brain stimulation of the subthalamic nucleus in Parkinson's disease: effects of variation in stimulation parameters. J. Neurol. Neurosurg. Psychiatry 71, 215–219.
Romanelli, P., Bronte-Stewart, H., Heit, G., Schaal, D. W., and Esposito, V. (2004). The functional organization of the sensorimotor region of the subthalamic nucleus. Stereotact. Funct. Neurosurg. 82, 222–229.
Romansky, K. V., Usunoff, K. G., Ivanov, D. P., and Galabov, G. P. (1979). Cortico-subthalamic projection in the cat: an electron microscopic study. Brain Res. 163, 319–322.
Rosa, M., Giannicola, G., Servello, D., Marceglia, S., Pacchetti, C., Porta, M., Sassi, M., Scelzo, E., Barbieri, S., and Priori, A. (2011). Subthalamic local field beta oscillations during ongoing deep brain stimulation in Parkinson's disease in hyperacute and chronic phases. Neurosignals 19, 151–162.
Rossi, L., Marceglia, S., Foffani, G., Cogiamanian, F., Tamma, F., Rampini, P., Barbieri, S., Bracchi, F., and Priori, A. (2008). Subthalamic local field potential oscillations during ongoing deep brain stimulation in Parkinson's disease. Brain Res. Bull. 76, 512–521.
Saint-Cyr, J. A., Hoque, T., Pereira, L. C., Dostrovsky, J. O., Hutchison, W. D., Mikulis, D. J., Abosch, A., Sime, E., Lang, A. E., and Lozano, A. M. (2002). Localization of clinically effective stimulating electrodes in the human subthalamic nucleus on magnetic resonance imaging. J. Neurosurg. 97, 1152–1166.
Severin, C. M., Young, P. A., and Massapust, L. C. (1976). Pallidothalamic projections in the rat. J. Comp. Neurol. 166, 491–502.
Sharott, A., Magill, P. J., Bolam, J. P., and Brown, P. (2005). Directional analysis of coherent oscillatory field potentials in the cerebral cortex and basal ganglia of the rat. J. Physiol. 562, 951–963.
Trottenberg, T., Kupsch, A., Schneider, G. H., Brown, P., and Kuhn, A. A. (2007). Frequency-dependent distribution of local field potential activity within the subthalamic nucleus in Parkinson's disease. Exp. Neurol. 205, 287–291.
Voges, J., Volkmann, J., Allert, N., Lehrke, R., Koulousakis, A., Freund, H. J., and Sturm, V. (2002). Bilateral high-frequency stimulation in the subthalamic nucleus for the treatment of Parkinson disease: correlation of therapeutic effect with anatomical electrode position. J. Neurosurg. 96, 269–279.
Walden, D. B., and Percival, A. T. (1998). Spectral Analysis for Physical Applications. Cambridge, MA: Cambridge University Press.
Weinberger, M., Mahant, N., Hutchison, W. D., Lozano, A. M., Moro, E., Hodaie, M., Lang, A. E., and Dostrovsky, J. O. (2006). Beta oscillatory activity in the subthalamic nucleus and its relation to dopaminergic response in Parkinson's disease. J. Neurophysiol. 96, 3248–3256.
Welch, P. D. (1967). Use of fast fourier transform for estimation of power spectra - a method based on time averaging over short modified periodograms. IEEE Trans. Audio Electroacoustics 15, 70–73.
Williams, A., Gill, S., Varma, T., Jenkinson, C., Quinn, N., Mitchell, R., Scott, R., Ives, N., Rick, C., Daniels, J., Patel, S., and Wheatley, K. (2010). Deep brain stimulation plus best medical therapy versus best medical therapy alone for advanced Parkinson's disease (PD SURG trial): a randomised, open-label trial. Lancet Neurol. 9, 581–591.
Williams, D., Tijssen, M., van Bruggen, G., Bosch, A., Insola, A., Di Lazzaro, V., Mazzone, P., Oliviero, A., Quartarone, A., Speelman, H., and Brown, P. (2002). Dopamine-dependent changes in the functional connectivity between basal ganglia and cerebral cortex in humans. Brain 125, 1558–1569.
Wingeier, B., Tcheng, T., Koop, M. M., Hill, B. C., Heit, G., and Bronte-Stewart, H. M. (2006). Intra-operative STN DBS attenuates the prominent beta rhythm in the STN in Parkinson's disease. Exp. Neurol. 197, 244–251.
Yelnik, J., Damier, P., Demeret, S., Gervais, D., Bardinet, E., Bejjani, B. P., Francois, C., Houeto, J. L., Arnule, I., Dormont, D., Galanaud, D., Pidoux, B., Cornu, P., and Agid, Y. (2003). Localization of stimulating electrodes in patients with Parkinson disease by using a three-dimensional atlas-magnetic resonance imaging coregistration method. J. Neurosurg. 99, 89–99.
Yoshida, F., Martinez-Torres, I., Pogosyan, A., Holl, E., Petersen, E., Chen, C. C., Foltynie, T., Limousin, P., Zrinzo, L. U., Hariz, M. I., and Brown, P. (2010). Value of subthalamic nucleus local field potentials recordings in predicting stimulation parameters for deep brain stimulation in Parkinson's disease. J. Neurol. Neurosurg. Psychiatry 81, 885–889.
Zaidel, A., Spivak, A., Grieb, B., Bergman, H., and Israel, Z. (2010). Subthalamic span of beta oscillations predicts deep brain stimulation efficacy for patients with Parkinson's disease. Brain 133, 2007–2021.
Appendix
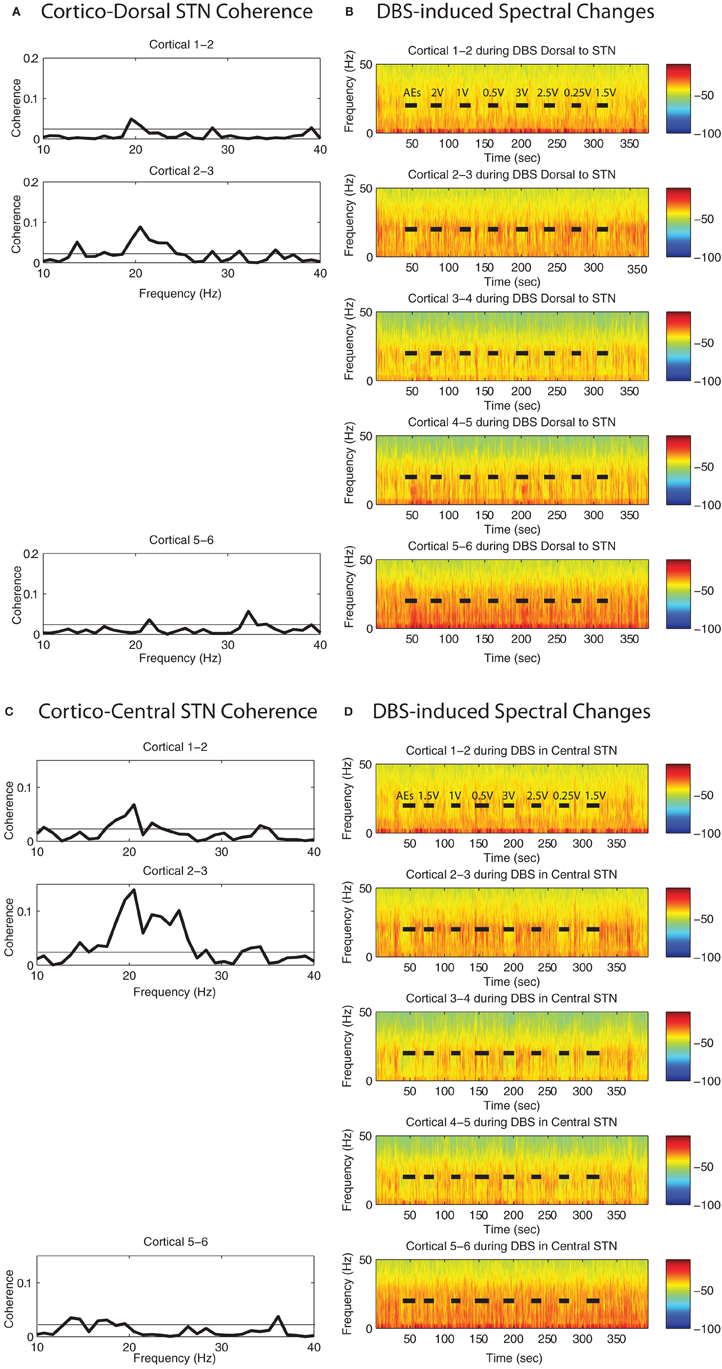
Figure A1. Spectral attenuation in ipsilateral motor cortex of single case (4R). Magnitude of coherence between each cortical bipolar pair and the STN cannula (A) 1 mM dorsal to STN, (C) central STN of another patient (case 4R). Spectrograms of motor cortex ECoG during HF DBS (B) 1.5 mM dorsal to the STN, and (D) within the central STN. Rows represent bipolar pairs from the ECoG 1 × 6 electrode strip. ECoG electrode #3 was estimated to be closest to the purported efferent projection site of the hyperdirect pathway. Coherence computation missing in cases where cortical channel #4 was contaminated by noise.
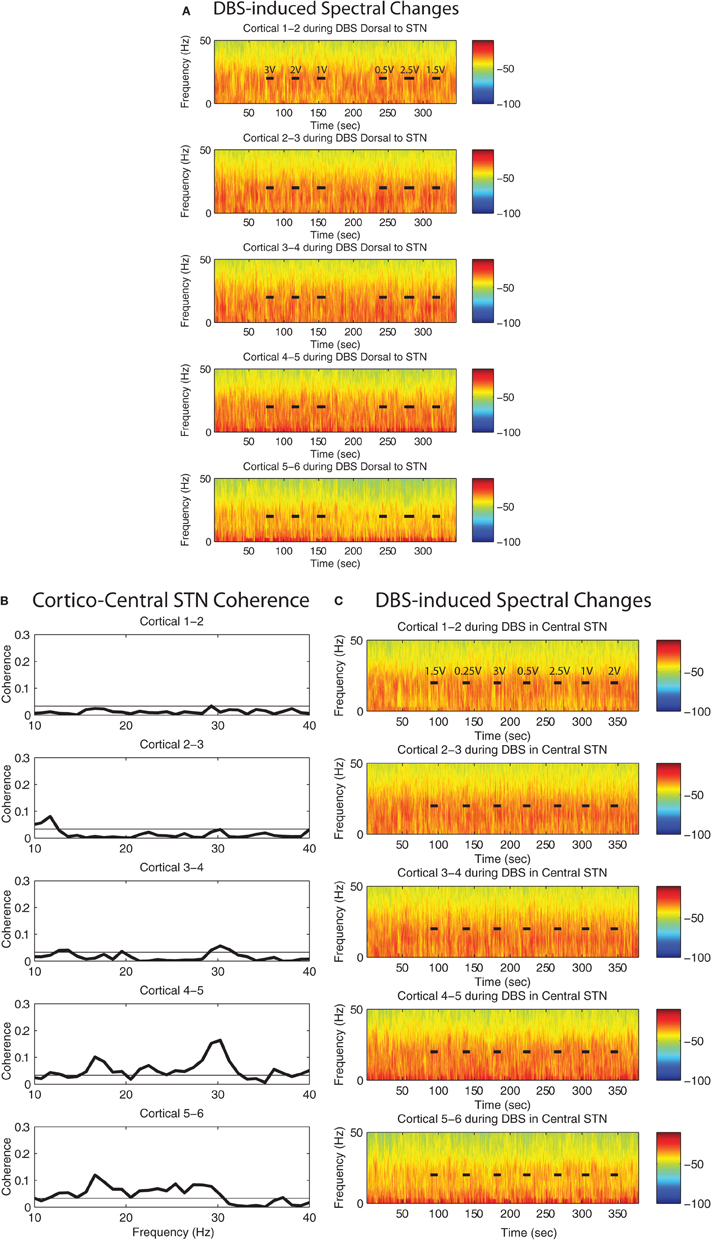
Figure A2. Spectrogram of the motor cortex ECoG during HF DBS (A) 1 mM dorsal to the STN, and (C) within the central STN of patient case 8R. This patient's ECoG strip was placed ~1 cm lateral to the intended target. (B) Magnitude of coherence between each cortical bipolar pair and the STN cannula in the central STN. Data for coherence computations between the dorsal STN region and cortex were not available from this patient. Rows in (A), (B), (C) represent bipolar pairs from the ECoG 1 × 6 electrode strip.
Keywords: Parkinson's disease, deep brain stimulation (DBS), intracranial EEG, subthalamic nucleus, motor cortex, electrocorticography (ECoG), beta rhythm, synchrony
Citation: Whitmer D, de Solages C, Hill B, Yu H, Henderson JM and Bronte-Stewart H (2012) High frequency deep brain stimulation attenuates subthalamic and cortical rhythms in Parkinson's disease. Front. Hum. Neurosci. 6:155. doi: 10.3389/fnhum.2012.00155
Received: 28 December 2011; Paper pending published: 24 February 2012;
Accepted: 16 May 2012; Published online: 04 June 2012.
Edited by:
Hans-Jochen Heinze, University of Magdeburg, GermanyReviewed by:
Marian Berryhill, University of Nevada, Reno, USAAlfons Schnitzler, Heinrich-Heine-University, Germany
Copyright: © 2012 Whitmer, de Solages, Hill, Yu, Henderson and Bronte-Stewart. This is an open-access article distributed under the terms of the Creative Commons Attribution Non Commercial License, which permits non-commercial use, distribution, and reproduction in other forums, provided the original authors and source are credited.
*Correspondence: Helen Bronte-Stewart, Department of Neurology and Neurological Sciences, Stanford University School of Medicine, Rm A343, 300 Pasteur Drive, Stanford, CA 94305, USA. e-mail: hbs@stanford.edu