The insular taste cortex contributes to odor quality coding
- 1 The John B Pierce Laboratory, New Haven, CT, USA
- 2 Department of Psychiatry, Yale University School of Medicine, New Haven, CT, USA
- 3 Department of Neurology, Feinberg School of Medicine, Northwestern University, Chicago, IL, USA
- 4 Department of Radiology, Feinberg School of Medicine, Northwestern University, Chicago, IL, USA
- 5 Interdepartmental Neuroscience Program, Yale University School of Medicine, New Haven, CT, USA
- 6 Department of Psychology, Yale University, New Haven, CT, USA
Despite distinct peripheral and central pathways, stimulation of both the olfactory and the gustatory systems may give rise to the sensation of sweetness. Whether there is a common central mechanism producing sweet quality sensations or two discrete mechanisms associated independently with gustatory and olfactory stimuli is currently unknown. Here we used fMRI to determine whether odor sweetness is represented in the piriform olfactory cortex, which is thought to code odor quality, or in the insular taste cortex, which is thought to code taste quality. Fifteen participants sampled two concentrations of a pure sweet taste (sucrose), two sweet food odors (chocolate and strawberry), and two sweet floral odors (lilac and rose). Replicating prior work we found that olfactory stimulation activated the piriform, orbitofrontal and insular cortices. Of these regions, only the insula also responded to sweet taste. More importantly, the magnitude of the response to the food odors, but not to the non-food odors, in this region of insula was positively correlated with odor sweetness rating. These findings demonstrate that insular taste cortex contributes to odor quality coding by representing the taste-like aspects of food odors. Since the effect was specific to the food odors, and only food odors are experienced with taste, we suggest this common central mechanism develops as a function of experiencing flavors.
Introduction
Despite distinct peripheral and central pathways, stimulation of both the olfactory and gustatory systems gives rise to the sensation of sweetness. Here we use fMRI to explore whether peripherally distinct sources of sweet sensation have a common central mechanism. More specifically, we test whether sweet odors evoke responses in the same region of cortex that encodes sweet taste, and if so, whether the responses to the odors in this region are graded according to the perceived sweetness of the odor.
Four lines of evidence suggest that there is a common central mechanism. First, the sweetness ratings of pure tastes and pure odors tend to summate in a roughly additive fashion (Frank and Byram, 1988; Schifferstein and Verlegh, 1996). That is, subjects conflate odor and taste sweetness, and as a result report that the overall sweetness of a taste/odor solution is approximately the sum of the sweetness of the taste alone and the odor alone. This suggests that the sweetness quality produced by stimulation of both modalities is similar.
Second, there is evidence that taste perception can influence olfactory coding (Wilson and Stevenson, 2003a). Experiencing odors retronasally in solution with a taste results in that odor smelling more like the taste with which it was paired when it is subsequently sniffed (Stevenson et al., 1995). Additionally, taste perceptual abilities are associated with odor-induced taste perceptual abilities (Stevenson et al., 2008). More specifically, a pooled score of taste hedonics, naming, quality and intensity judgments was shown to be positively associated with a pooled score of similarity, discrimination and intensity judgments of odor-induced taste perception. These data suggest that olfactory perception is dependent upon influences from the taste system, which is in turn consistent with a common central mechanism.
Third, there is evidence for overlapping taste and odor representation in the insular cortex. Although the gustatory and olfactory systems are peripherally distinct, there are monosynaptic connections between the primary insular gustatory cortex and the primary piriform olfactory cortex (Mesulam and Mufson, 1985). There is also evidence that neurons in the primary taste cortex respond to odors in monkeys (Scott and Plata-Salaman, 1999). Likewise, in humans, neuroimaging studies frequently report activations in the insula following taste or odor stimulation (Cerf-Ducastel and Murphy, 2001; De Araujo et al., 2003; Rolls et al., 2003). Indeed, a meta-analysis of gustatory and olfactory neuroimaging investigations showed that responses to odors occur in the same region of insular cortex where responses to taste are observed (Verhagen and Engelen, 2006). In addition, in the same group of subjects, De Araujo et al. (2003) showed that retronasally sensed chicken and strawberry odors (i.e., odors delivered in an aqueous solution) activate the same region of insula that responds to sweet taste. We have also demonstrated that insular cortex shows supra-additive responses to congruent (sweet vanilla) but not incongruent (salty vanilla) odor-taste mixtures, indicating that taste-odor integration occurs in the insula and that it is dependent upon experience (Small et al., 2004).
Fourth, there is evidence that the insular cortex contributes to olfactory perception. Two studies have reported that patients with insular lesions exhibit both taste and smell perceptual deficits (Mak et al., 2005; Stevenson et al., 2008). Moreover, the latter study specifically tested whether insular lesions would impair the ability to perceive the taste-like qualities of odors, and confirmed a reduced ability to perceive taste-like qualities of odors in six patients with insular lesions. More recently, Fortis-Santiago et al. (2010) showed that inactivation of taste cortex blocks the ability of rodents to learn to use an odor cue to guide food preference, suggesting that taste cortex contributes to olfactory learning.
Taken together, these four lines of evidence support the possibility of a common central mechanism giving rise to odor and taste-induced sweetness perception. Further, the neuroanatomical and neurophysiological data suggest that this mechanism likely resides in insular cortex. However, an alternative possibility is that the taste-like properties of odors are coded in the piriform cortex. Wilson and Stevenson (2003a,b) have argued that the piriform cortex is devoted to the experience-dependent synthesis of an odor’s molecular structure from the periphery to create emergent codes, termed “odor objects.” In support of this view, Gottfried et al. (2006) used fMRI to demonstrate a double dissociation of odor coding in piriform cortex. They found that the posterior piriform, which receives projections directly from the olfactory bulb, is sensitive to odorant molecular structure (alcohol vs. aldehyde) and not odor quality (vegetable vs. fruit), whereas the anterior piriform cortex is sensitive to odor quality and not molecular structure. In a subsequent study they also found that the quality code in the anterior piriform is sculpted by experience (Li et al., 2008). As such, it is possible that the experience-dependent taste-like properties of odors are represented with other aspects of odor quality in anterior piriform cortex.
The aim of the current study was to determine if the sweet taste-like quality of odors is encoded in piriform cortex or in insular taste cortex. We used fMRI to measure neural activity in 15 subjects while they sniffed similarly intense food and floral odors, and tasted a strong and a weak concentration of (sweet) sucrose solution. We reasoned that if the insula contributes to coding of the taste-like qualities of odors, then orthonasally sensed sweet odors should activate regions of insular cortex that respond to sweet taste. Moreover, the magnitude of this response should be related to perceptual ratings of odor sweetness. In contrast, if odor quality is represented distinctly from taste quality, then the piriform cortex should respond specifically to odors (and not taste) and the magnitude of response here should be related to odor sweetness ratings.
Materials and Methods
Subjects
Nineteen right-handed subjects (15 women, 4 men, mean age 24.9 ± 4.8 years) gave written informed consent to participate in our study that was approved by Yale University School of Medicine Human Investigation Committee. All subjects reported having no known taste, smell, neurological, or psychiatric disorders. Four subjects were excluded from the study following the initial session because their ratings of the odorants did not fall within a target range (see below). Therefore, the results of the study are based on data from 15 right-handed subjects (11 women, 4 men, mean age 24 ± 4.9 years with an Edinburgh Handedness Inventory score (Oldfield, 1971) ranging between 55 and 100).
Stimuli and Delivery
Olfactory stimulation
Food odors were represented by chocolate-cookie and strawberry-and-cream odorants (6002335, 6106524 from Bell Labs Flavors and Fragrances, Inc., IL, USA), and floral odors by lilac (31731066 International Flavors and Fragrances) and rose odorants (6104579 from Bell Labs Flavors and Fragrances). These stimuli were selected to be of relatively similar intensity and pleasantness and were presented by a custom-built, MRI-compatible olfactometer programmed in Labview (National Instruments, TX, USA). The design is based upon that described by Johnson and Sobel (2007). A detailed description of olfactory stimulation system has been described previously (Small et al., 2008). In brief, odorants are contained in stainless steel wells. Mass flow controllers (MKS Instruments, Andover, MA, USA) adjust the rate of air flow over wells containing an odorous substance or nothing (odorless) at 10 l/min, allowing passing air to pick up vaporized odor molecules from the odorous substance. The humidity of the air is adjusted to 25% water vapor with a sparging humidifier. The olfactometer has separate channels for odorized and clean air. The air exits the odor from the wells into a mixing manifold (where dilution clean air may mix with odorized air) and then passes into one of two 25 foot Teflon tubes, where one channel is dedicated for always clean air and the other for odorized air. To prevent condensation, the temperature in the air tubes is heated by running water tubes (connected to a water recirculator, with water heated to 40°C) alongside the air tubes in the trunk. The trunk terminates in a custom-built Teflon manifold (Teqcom, Santa Ana, CA, USA) that is placed upon the subject’s chest. This manifold also receives a vacuum line which serves to evacuate air from either the clean air or odor channel, thereby creating a closed loop so that odorized air does not contaminate the headspace. Because switching between odorized and clean air occurs very close to the subject’s nose, stimulus onset and offset is on the order of milliseconds. The subjects receive the air via a nasal mask (Sleepnet, Manchester, NH, USA). The mask is coupled to a pneumotachograph to measure airflow in the nose (Johnson and Sobel, 2007). The pneumotachograph connects to a spirometer (ADInstruments, Grand Junction, CO, USA), from which a signal is fed into an amplifier (ADInstruments, PowerLab 4SP), and digitally recorded at 100 Hz using Chart version 5.5.1 (ADInstruments). This allows us to record airflow simultaneous with scanning. We calculate sniff volume by averaging area-under-the-curve for the signal during each trial.
Gustatory stimulation
To create sweet taste stimuli sucrose was dissolved in distilled water to provide a weak (0.1 M) and a strong (0.56 M) sweet taste stimulus. Since water activates taste cortex (Frey and Petrides, 1999; Zald and Pardo, 2000), and has a taste (Bartoshuk et al., 1964), we used artificial saliva as a tasteless rinse after each stimulation with sweet taste (see Figure 1B). We created this from a stock tasteless solution containing 2.5 mM sodium bicarbonate (Sigma Aldrich Inc., MO, USA) and 25 mM potassium chloride (Sigma Aldrich Inc., MO, USA) (O’Doherty et al., 2001). Three weaker versions were also prepared (at 25%, 50%, and 75% of the original concentration). Subjects were instructed to select the dilution that tasted most like nothing. Stimuli were delivered as 0.5 ml of solution over 3 s from syringe pumps with a gustometer system that has been previously described in detail (Veldhuizen et al., 2007). In brief, this system consists of computer controlled syringe pumps (Braintree Scientific, Braintree, MA, USA), which infuse liquids from syringes filled with taste solutions into an fMRI-compatible custom designed gustatory manifold via 25-foot lengths of Tygon beverage tubing (Saint-Gobain Performance Plastics, Akron, OH, USA). The gustatory manifold is mounted on the MRI headcoil and the tubes anchor into separate channels that converge over a stylus, which rests just inside the subject’s mouth. When a pump is triggered liquid drops from the channel onto the stylus and comes in contact with the tongue. To measure swallowing an expanding MR-compatible respiratory bellows (Siemens, Erlangen, Germany) is positioned over the subject’s thyroid cartilage to measure laryngeal movement (Martin et al., 2004). The bellows is connected to a valve that bleeds off residual air and is in turn connected to a second spirometer that feeds into the Powerlab amplifier so that this signal can be recorded by the Chart software. We set a subject-specific signal to filter out low-amplitude signals from the carotid pulse, and then used the deviation of the amplitude in either direction (above or below baseline) to quantify tongue movement. Overall tongue movement is calculated by averaging deviation of amplitude during each trial.
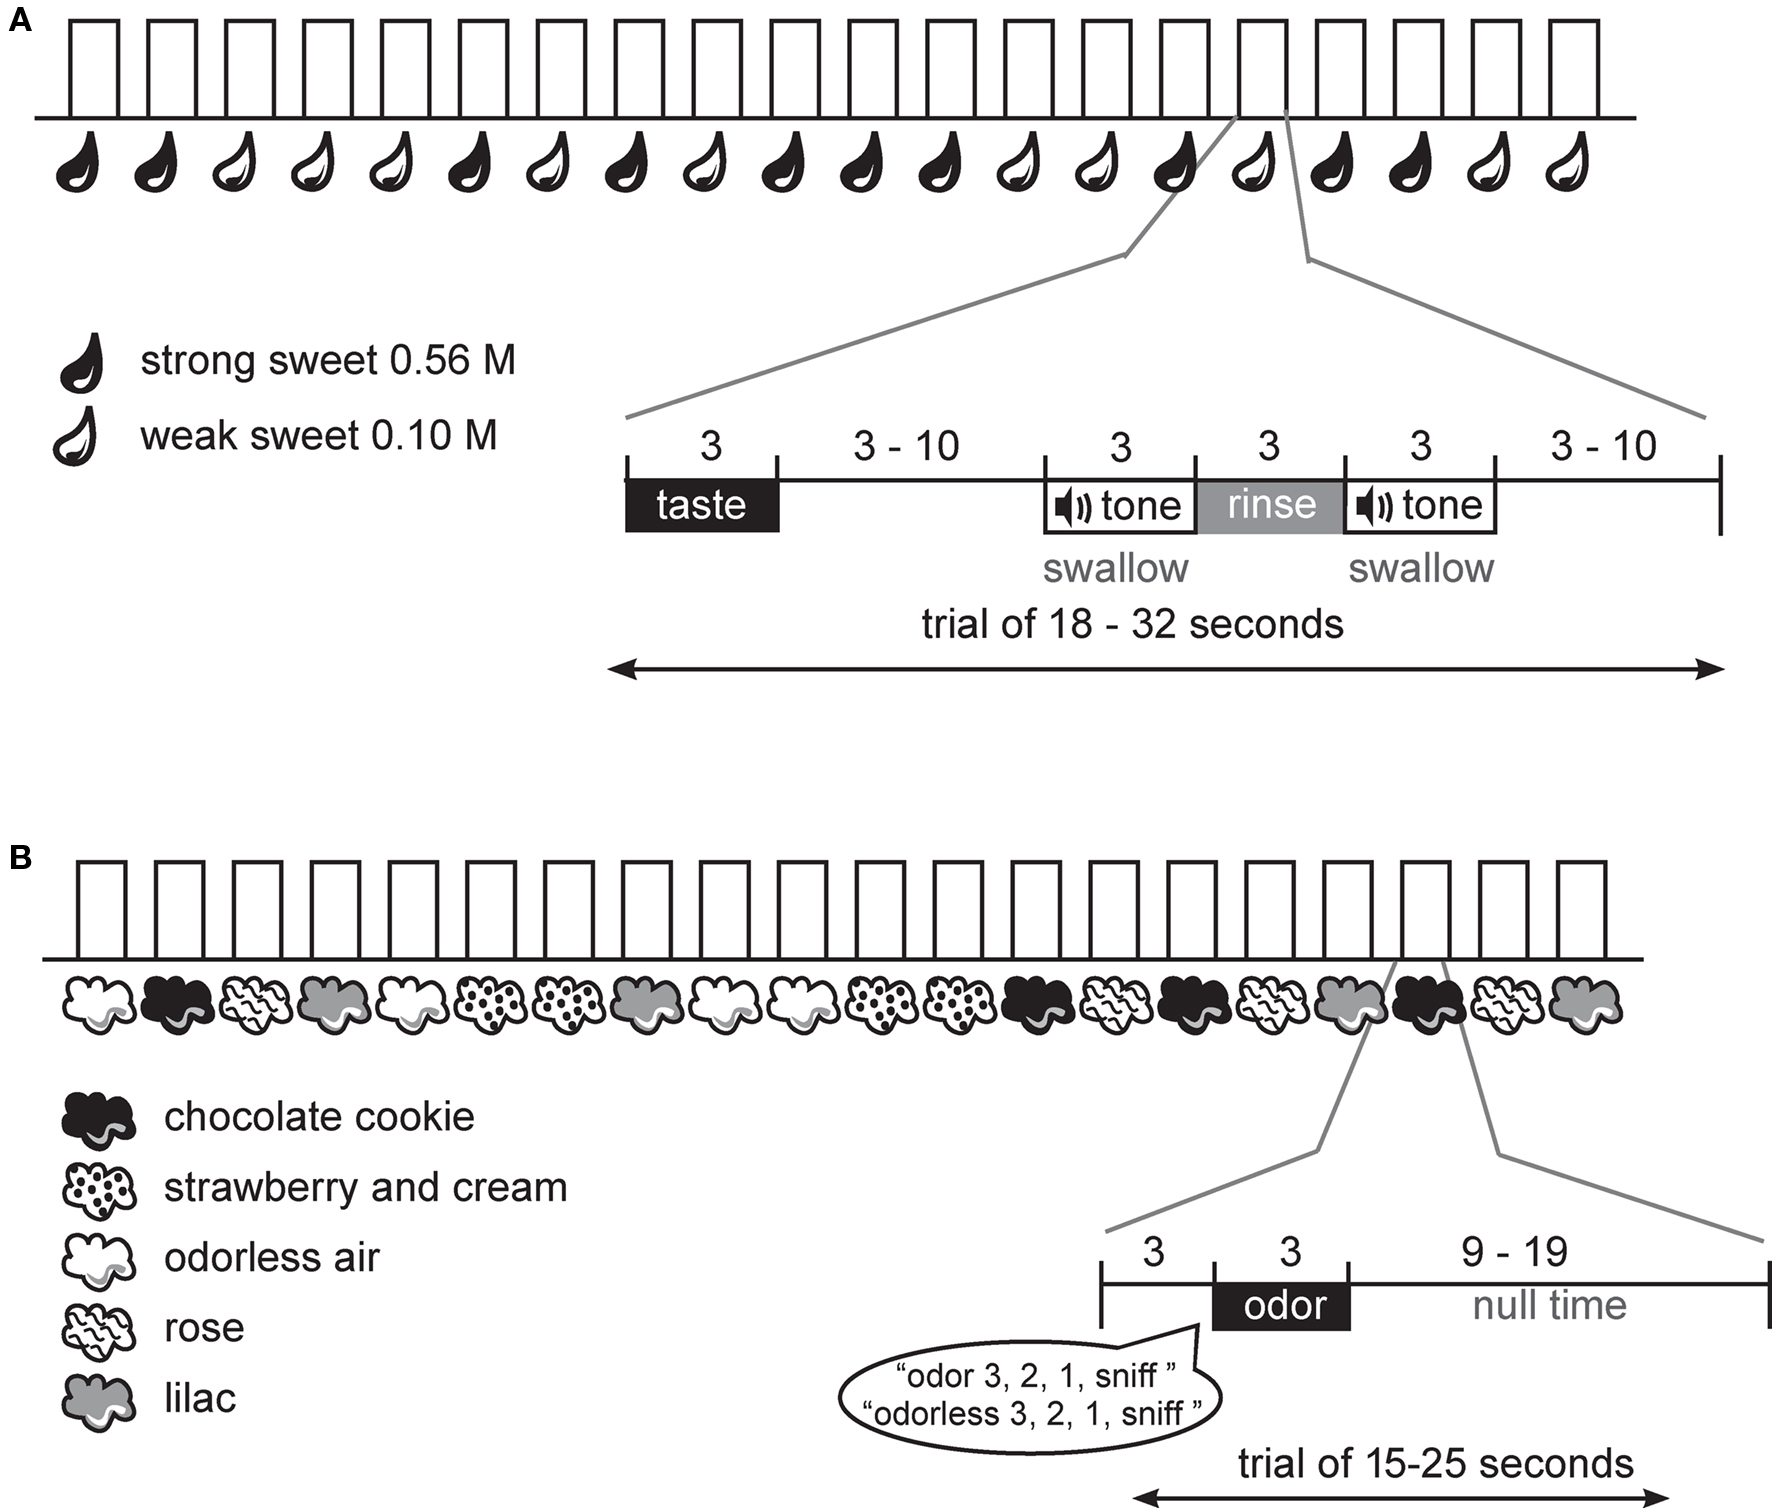
Figure 1. Design. (A) Schematic of gustatory protocol. At the onset of each trial the subject received the taste solution over 3 s. This was followed by a variable wait, a cue to swallow the taste solution, a rinse, and a cue to swallow the rinse. A variable interval followed until the start of the next trial. (B) Schematic of olfactory protocol. At the onset of each trial the subject heard a spoken word, indicating the trial type and then a countdown to sniff. Immediately following the word “sniff” the odor was delivered over 3 s. This was followed by a variable interval until the start of the next trial.
Experimental Design
All subjects first participated in a training session in a mock scanner. The purpose of this session was to familiarize subjects with the task, to collect perceptual ratings of the stimuli, and to identify subjects who were uncomfortable with any part of the experimental procedure, for example, swallowing in the supine position. No subject reported experiencing discomfort with the procedure.
In the training session subjects first selected their tasteless solution. They then rated the taste and odor stimuli for several different attributes. Pleasantness was rated on a visual analog line scale (VAS) of 100 mm with the label “most unpleasant sensation ever” at the left anchor point (−100), the label “neutral” in the middle (0), and the label “most pleasant sensation ever” at the right anchor point (+100) (Lawless and Heymann, 1999). Edibility and familiarity were rated on similar VAS scales, with “not edible at all” or “not familiar at all” as the left anchor, “neutral” in the middle, and “very edible” or “very familiar” as the right anchor. Subjective overall intensity and the intensity of the sweetness, sourness, saltiness, and bitterness of stimuli were rated on the general Labeled Magnitude Scale (Green et al., 1996; Bartoshuk et al., 2004), a vertical line scale of 100 mm anchored by the labels “no sensation” at the bottom and “strongest imaginable sensation” at the top. In between these anchors the following words were quasi-logarithmically spaced in ascending order: “barely detectable,” “weak,” “moderate,” “strong,” and “very strong.” The presentation order of the scales was counterbalanced across subject.
After completing the ratings, subjects underwent two training runs in the fMRI simulator (one run with odors only and one with tastes only). After the training session, and before and after scanning, subjects rated the stimuli again. Subjects were not asked to participate in the fMRI portion of the study if they rated the food odors as inedible, the floral odors as edible, any odor as unpleasant, or any odor as unfamiliar. Four subjects were excluded based upon these criteria.
During the fMRI scanning session, subjects performed one anatomical run and a total of six functional runs; four odor runs, each 6 min and 20 s and two taste runs, each 7 min and 46 s. A long event-related design was used for the gustatory protocol and a standard event-related design for the olfactory protocol (Figure 1). The use of the long event-related design for taste is necessary because it is not possible to achieve rapid phasic sensory stimulation required for a standard event-related design. This is because the taste remains in the mouth until the swallow occurs, and it is advantageous to delay the swallow (and hence taste stimulation) so that the movement associated with the swallow can be decoupled from the expected peak of the hemodynamic response to the sensation of the taste stimulus.
During the gustatory runs the sweet taste was delivered over 3 s, followed by a variable interval (3–10 s) that ended with the onset of a tone signaling subjects to swallow over the next 3 s. A tasteless rinse was then delivered over 3 s and the trial ended with a final swallow tone (Figure 1A). Each trial type (weak sweet, strong sweet) was repeated 20 times over the two runs in random order.
During the olfactory runs odor trials began with the spoken word “odor” or “odorless” followed by a spoken countdown to the sniff: “3, 2, 1, sniff.” This was followed by a 3 s delivery of odorless or odorized air embedded in the continuous stream of odorless air. Careful orchestration of the sniff onset ensured that the respiratory cycle did not interfere with stimulus delivery (e.g., if a subject breathed out during a 3 s odor delivery they might miss perceiving the stimulus). Odor delivery was followed by a variable window of time (9–19 s) before the start of the next trial (Figure 1B). Each odor and the odorless air were presented 16 times in a random order over the 4 runs.
To minimize olfactory adaptation odor runs were always followed by either a taste run or the high resolution anatomical scan.
fMRI Data Acquisition
The images were acquired on a Siemens 3 T Trio magnetom scanner. Echoplanar imaging was used to measure the blood oxygenation-level dependent (BOLD) signal as an indication of cerebral brain activation. A susceptibility-weighted single-shot echoplanar method was used to image the regional distribution of the BOLD signal with TR, 2000 ms; TE, 20 ms; flip angle, 90°; FOV, 220 mm; matrix, 64 × 64; slice thickness, 3 mm; and acquisition of 40 contiguous slices. Slices were acquired in an interleaved mode. The MR signal was allowed to equilibrate at the beginning of each functional run over six scans for a total of 12 s, which were then excluded from analysis. For a high resolution anatomical scan a T1-weighted 3D FLASH sequence was used (TR/TE, 2530/3.66 ms; flip angle, 20°; matrix, 256 × 256; 1 mm thick slices; FOV, 256; 176 slices). Data were pre-processed and analyzed using SPM5 software (Wellcome Department of Imaging Neuroscience, London, UK) (Friston et al., 1995; Worsley and Friston, 1995) in MATLAB 7.3.0 (Mathworks, Inc., Sherborn, MA, USA).
Analysis of Behavioral Data
Perceptual ratings
We performed a 2 × 2 × 2 × 2 within-subjects MANOVA in SPSS for Windows (release 16.0.0, Chicago SPSS Inc.) in which we evaluated whether the multiple attributes for which we collected ratings (intensity, pleasantness, edibility, familiarity, sweetness, sourness, saltiness and bitterness) differed across odor category (food vs. floral), odor identity within each category (food: strawberry-and-cream vs. chocolate-cookie, floral: lilac vs. rose), session (training vs. scanner session) and time (before vs. after session) using SPSS. We used an alpha of 0.05 to determine significance for the multivariate effect of each factor on the perceptual ratings. Univariate effects were used to further probe which of the perceptual ratings were affected by the independent factors. Because of technical difficulties with recording responses during the training session for one subject, this analysis included 14 subjects only.
Sniff volume and tongue movement
To rule out potential differences in sniff volume or tongue movement in response to smelling food vs. non-food odors we conducted a within-subjects 2 × 2 ANOVA on sniff volume and deviation of tongue movement with odor category (food vs. floral) and odor identity within each category (food: strawberry-and-cream vs. chocolate-cookie, floral: lilac vs. rose). Six of the 15 datasets were lost due to either technical difficulties with the spirometer equipment during scanning or because the subject experienced the respiratory bellows as uncomfortable.
fMRI
fMRI single-subject level analyses
The images were time-acquisition corrected to the slice obtained at 50% of the TR. All functional images were then realigned to the mean functional image. The images (anatomical and functional) were normalized to the standard MNI template brain implemented in SPM5, and resliced to give isotropic structural (1 mm3) or functional (3 mm3) voxels, respectively. We then detrended the fMRI time-series using a linear model of the global signal (Macey et al., 2004). This method has been shown not to cause a negative bias in the detrended signal. Functional images were smoothed with a 6 mm FWHM isotropic Gaussian kernel. For time-series analysis on all subjects, a high-pass filter (128 Hz) was applied to the design matrix (according to convention in SPM5) in order to remove low-frequency noise and slow drifts in the signal. Condition-specific effects at each voxel were estimated using the general linear model. The response to events was modeled by a canonical hemodynamic response function (HRF), including a temporal derivative to enable examination of differences in timing between various events (Henson et al., 2002). We defined our events of interest as mini-blocks with a duration of 3 s after taste or odor onset. The events of interest we defined at the single-subject level depended on the second-level analyses. The instructions, swallows and the rinses were modeled as events of no interest.
fMRI group level analyses
To localize brain regions responding to sweet taste and then to create a map of these regions for later use as an inclusive group mask for the odor analyses we created two taste events of interest for each subject: (1) weak sweet taste, and (2) strong sweet taste. The parameter estimates of the averaged response from the two event types were then entered into a group level fixed effects analysis contrasting strong sweet taste - weak sweet taste. In this, and all subsequent contrasts, the resulting t-map was thresholded at p < 0.001 and 3 or more contiguous voxels. Peaks were then considered significant if the p-value is less than 0.05 following false discovery rate correction for multiple comparisons across the whole brain (denoted PFDR-WB-corrected). In addition, to create a functional mask for later use the t-map was also thresholded at Puncorrected < 0.05 and saved as the “sweet taste mask.” It is convention to use such a liberal threshold for functional masks to include all voxels with a potential response. However, we note that we only consider peaks significant if they are in the masked region AND surpass our statistical threshold (p < 0.05 corrected across all voxels included in the functional mask, denoted PFDR-FM-corrected). We follow a similar procedure whenever a functional mask is used to delimit responses.
To localize brain regions responding to odor sensation, we compared the average response to all odors vs. the average response to all odorless trials. Parameter estimate images, isolating average response to all odors and all odorless trials, from the single-subject design matrices were entered into a multi-subject repeated measures ANOVA design (i.e., SPM5 “flexible factorial” model) with factors “subject” (with one level for each subject) and “stimulus” (with two levels; all odors and odorless). These analyses were also run with inclusive masking (with the “sweet taste mask”) to limit identification of olfactory responses to regions that also responded to sweet taste. Finally, we created a “sweet odors and sweet taste overlap mask” for later use.
Next, to determine if odor-induced responses are related to sweet perception, we regressed sweetness intensity ratings for each of the four odorants against BOLD response evoked by those odors across all of the subjects in a whole brain regression analysis in SPM5. This analysis was used to test whether and where we observe significant correlations in neural response to odors and sweetness ratings of those odors. At the single-subject level we created six events of interest: (1) chocolate-cookie odor; (2) strawberry-and-cream odor; (3) lilac odor; (4) rose odor; and two separate odorless air baselines; (5) odorless air A; and (6) odorless air B. Contrasts were then prepared of: (1) chocolate-cookie odor – odorless A; (2) strawberry-and-cream odor – odorless B; (3) lilac odor – odorless A; and (4) rose odor – odorless B. Thus we created independent odorless baselines for each of the odors within the two odor categories. The parameter estimate images from the contrasts were then entered into a flexible factorial regression design along with a vector of the respective odor sweetness ratings. This vector was created by averaging, for each subject and each odor, the sweetness ratings given to the odor at the four points of collection (before and after training session and before and after the fMRI scan) minus the sweetness ratings provided to the odorless pulses (which are near barely detectable). This resulted in four measurements per subject in the regression analysis (one sweetness value for each odor). We observed two univariate outliers for the floral odors (z-score > 2.5) ratings (from the same subject). All data points for this subject were therefore left out of the regression analysis, resulting in n = 14. To test the prediction that the sweetness of food odors is coded in the same area that shows overlapping neural responses to sweet odors and to sweet taste, we inclusively masked the regression analysis with a functional mask of “sweet odors and sweet taste overlap” activation. The flexible factorial regression analysis included two factors: “subject” (with 14 levels, one for each subject), and stimulus (with four levels, one for each odor minus its baseline). This analysis also includes a regressor for the sweetness ratings, which was specified in the design matrix to interact with the factor stimulus, effectively leading to four regressors while retaining the information that these values in these four regressors are not independent (within-subjects design). In this regression analysis the sweetness of food odors was treated as a regressor of interest, whereas the sweetness of floral odors was included as a nuisance variable; e.g., the resulting correlation map specifically shows regions that show a graded response with food odors and not with floral odors.
We used the regression analysis in SPM5 (as described above) to confirm whether and where we observe significant correlations in neural response to odors and sweetness ratings of those odors (Jabbi et al., 2009; Lindquist and Gelman, 2009). Thus, SPM5 only shows which voxels correlate significantly with sweetness ratings. In a separate step we calculate the magnitude of the correlation (r) across the significantly activated cluster (as SPM5 does not give this information) and other areas of interest for post hoc illustrative purposes only. We computed the average correlation coefficients across significantly activated clusters, by extracting parameter estimates from the chocolate odor – odorless A and strawberry odor – odorless B images for the voxels that displayed a correlation (p < 0.001 and a cluster size > 3 voxels) with food odor sweetness in the regression analysis in SPM, and calculated the average (±standard deviation) of those correlation coefficients. To illustrate the absence of correlation with sweetness ratings in other areas of interest, we used the peak coordinates of the significant responses to odor – odorless (see Table S2 in Supplementary Material) to guide data extraction of parameter estimate from within a sphere with a 6 mm radius. Since we illustrate the magnitude of the correlation for the significant cluster (by definition) with a bias toward voxels that display a high correlation, we mirrored this selection bias for other areas of interest, by selecting those voxels from the other areas of interest whose parameter estimate displayed the highest (although always non-significant as per SPM5) correlation with the odor sweetness ratings. Calculating the correlation coefficient per voxel and then averaging the coefficients across voxels reflects the magnitude of the correlation better than first averaging over parameter estimates from multiple voxels and then computing the correlation, as this latter procedure may falsely inflate the correlation coefficient (Vul et al., 2009). The same procedure was followed for the floral odors.
Results
Perceptual Ratings
A multivariate effect of odor category on overall ratings [F(9,5) = 6.742, p = 0.025] was observed, indicating that food and floral odors are generally perceived to be different. Average ratings for each of the perceptual scales (±s.e.m.) and each odor type are depicted in Figure 2. The food odors were significantly more sweet F(1,13) = 31.523, p < 0.0001, edible F(1,13) = 76.382, p = 0.000, familiar F(1,13) = 7.883, p = 0.015, and marginally more pleasant F(1,13) = 4.659, p = 0.050 than the floral odors. However, both odor categories were experienced as pleasant, familiar and sweet (see Figure 2). Within the categories the ratings did not differ as a function of odor identity F(9,5) = 2.976, p = 0.121. A multivariate effect of session [F(9,5) = 4.804, p = 0.049] was observed, with the intensity of the odor stimuli rated as significantly higher during the training than during the scanner session F(1,13) = 5.395, p = 0.037. There was no effect of time of ratings (before or after the session) on the ratings overall [multivariate F(9,5) = 1.751, p = 0.278]; however, inspection of the univariate effects showed that odor pleasantness and sweetness were experienced as higher before, compared to after, the session for all odors [F(1,13) = 8.218, p = 0.013 and F(1,13) = 7.366, p = 0.018 respectively]. No other significant effects were observed.
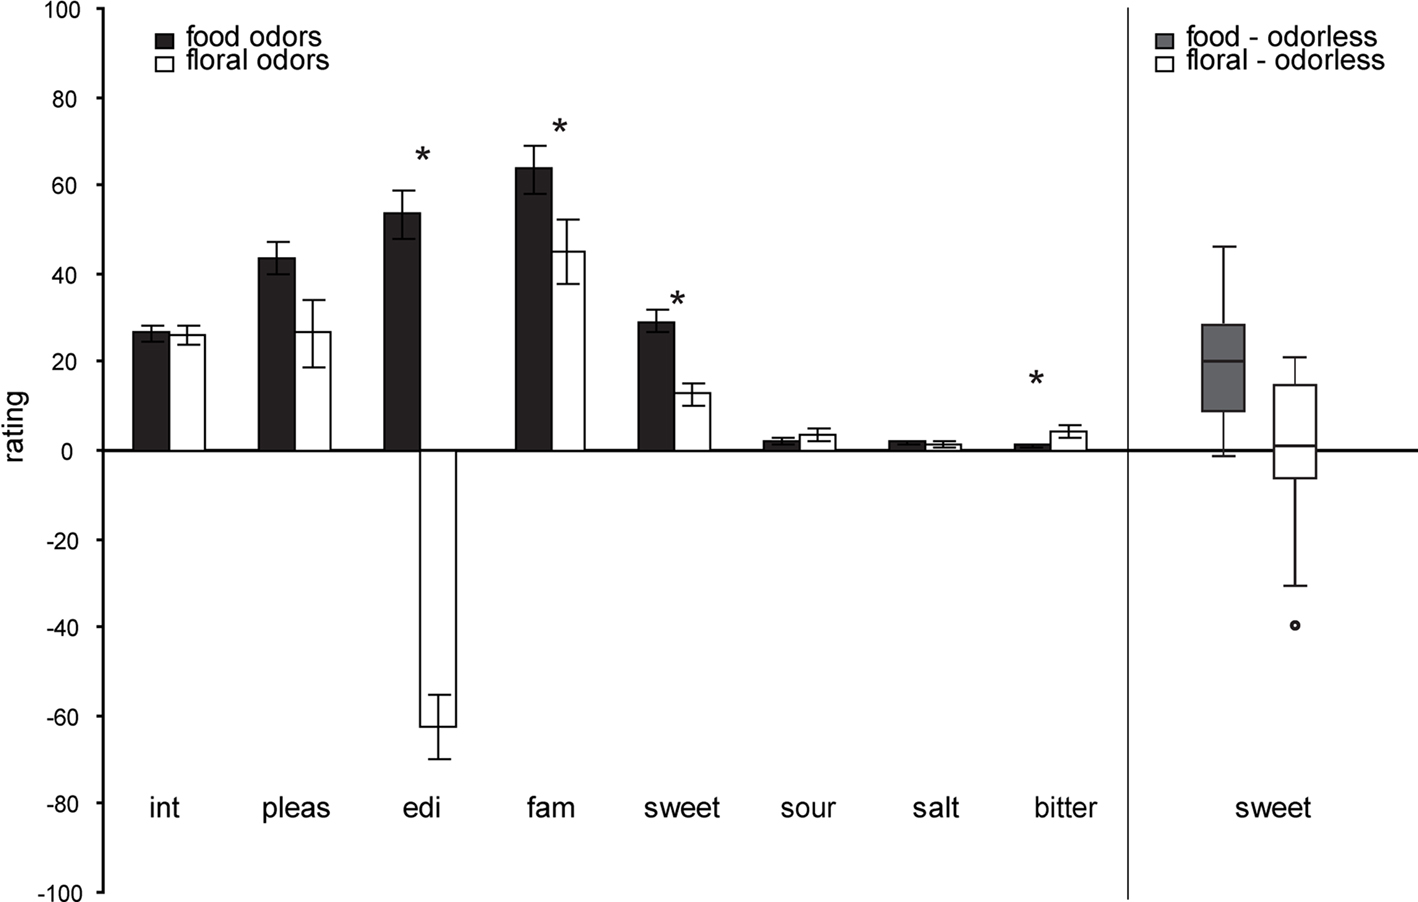
Figure 2. Left panel: Average perceptual ratings (y axis) over subjects (±s. e.m.) of the food (chocolate-cookie and strawberry-and-cream) and floral (rose and lilac) odors (x axis). Int, intensity; pleas, pleasantness; edi, edibility; fam, familiarity. Stars represent significant differences. Right Panel: Box plots illustrating the range and variability of sweetness rating for food and floral odors. Whiskers reflect the lowest and highest observation, the upper and lower boundaries of the box represent the upper and lower quartiles, the middle line of the box represents the median and the circle represents a single outlier, that was removed from the correlation analyses). Note that there is similar across-subject variability in food and floral sweetness ratings, as illustrated in right box and whisker plots.
Sniff Volume and Tongue Movement
There were no differences in sniff volume [F(1,8) = 0.195, p = 0.671] or tongue movement [F(1,8) = 0.658, p = 0.441] between the food and floral odors. There were also no differences between the two odors in each category [sniff volume (F(1,8) = 1.224, p = 0.301] or tongue movement [F(1,8) = 0.382, p = 0.554]. In addition, a within-subjects ANOVA on olfactory stimulus, with five levels, corresponding to odorless, chocolate, strawberry, rose and lilac showed no significant effect of stimulus on sniff volume [F(4,32) = 0.478, p = 0.752], and post hoc planned comparisons (t-tests) indicated that subjects sniffed a similar volume of odorized vs. odorless air (p > 0.954).
Neuroimaging Results
Sweet taste localizer
As predicted, significantly greater responses were observed to strong vs. weak sweet tastes in the anterior and mid insula bilaterally (−42 −3 0, Z = 4.49, PFDR-WB = 0.001, k = 65; (39 −9 9, Z = 4.23, PFDR-WB = 0.002, k = 41) (Figure 3). A full list of significant activations from this contrast can be found in Table S1 in Supplementary Material.
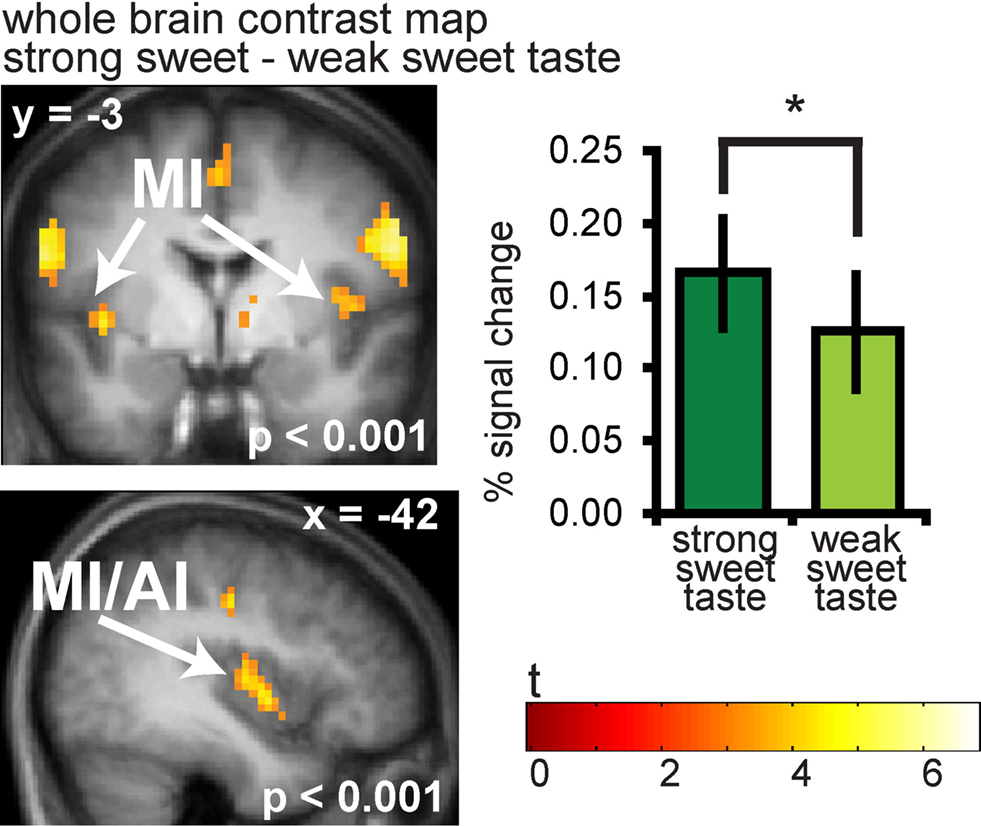
Figure 3. Neural response in the insula to sweet taste. Coronal and sagittal sections of the insula showing response to strong sweet taste – weak sweet taste. In the bargraphs we plotted the average percent signal change for the two sweet taste conditions over subjects (±s.e.m.): (Figure 6A and 6B) strong sweet taste (dark green) and weak sweet taste (light green), averaged over subjects. The response was taken from the voxel that responded maximally, as identified in the SPM analysis. Thus, these estimates are non-independent, and are provided to illustrate the relative difference in neural response.
Neural response to sweet odors
Significant responses to all odors – odorless were observed in the insula and overlying operculum, the piriform cortex, and the orbitofrontal cortex (OFC) (Figure 4 and Table S2 in Supplementary Material). To determine whether there is overlap in neural response to sweet odors and sweet taste, we masked (all odors – odorless) with the “sweet taste” mask. This resulted in significant activations in bilateral insula and overlying operculum only (Figure 5 and Table S3 in Supplementary Material). We then saved this activation map for use as a “sweet odors and sweet taste overlap” mask during subsequent analyses.
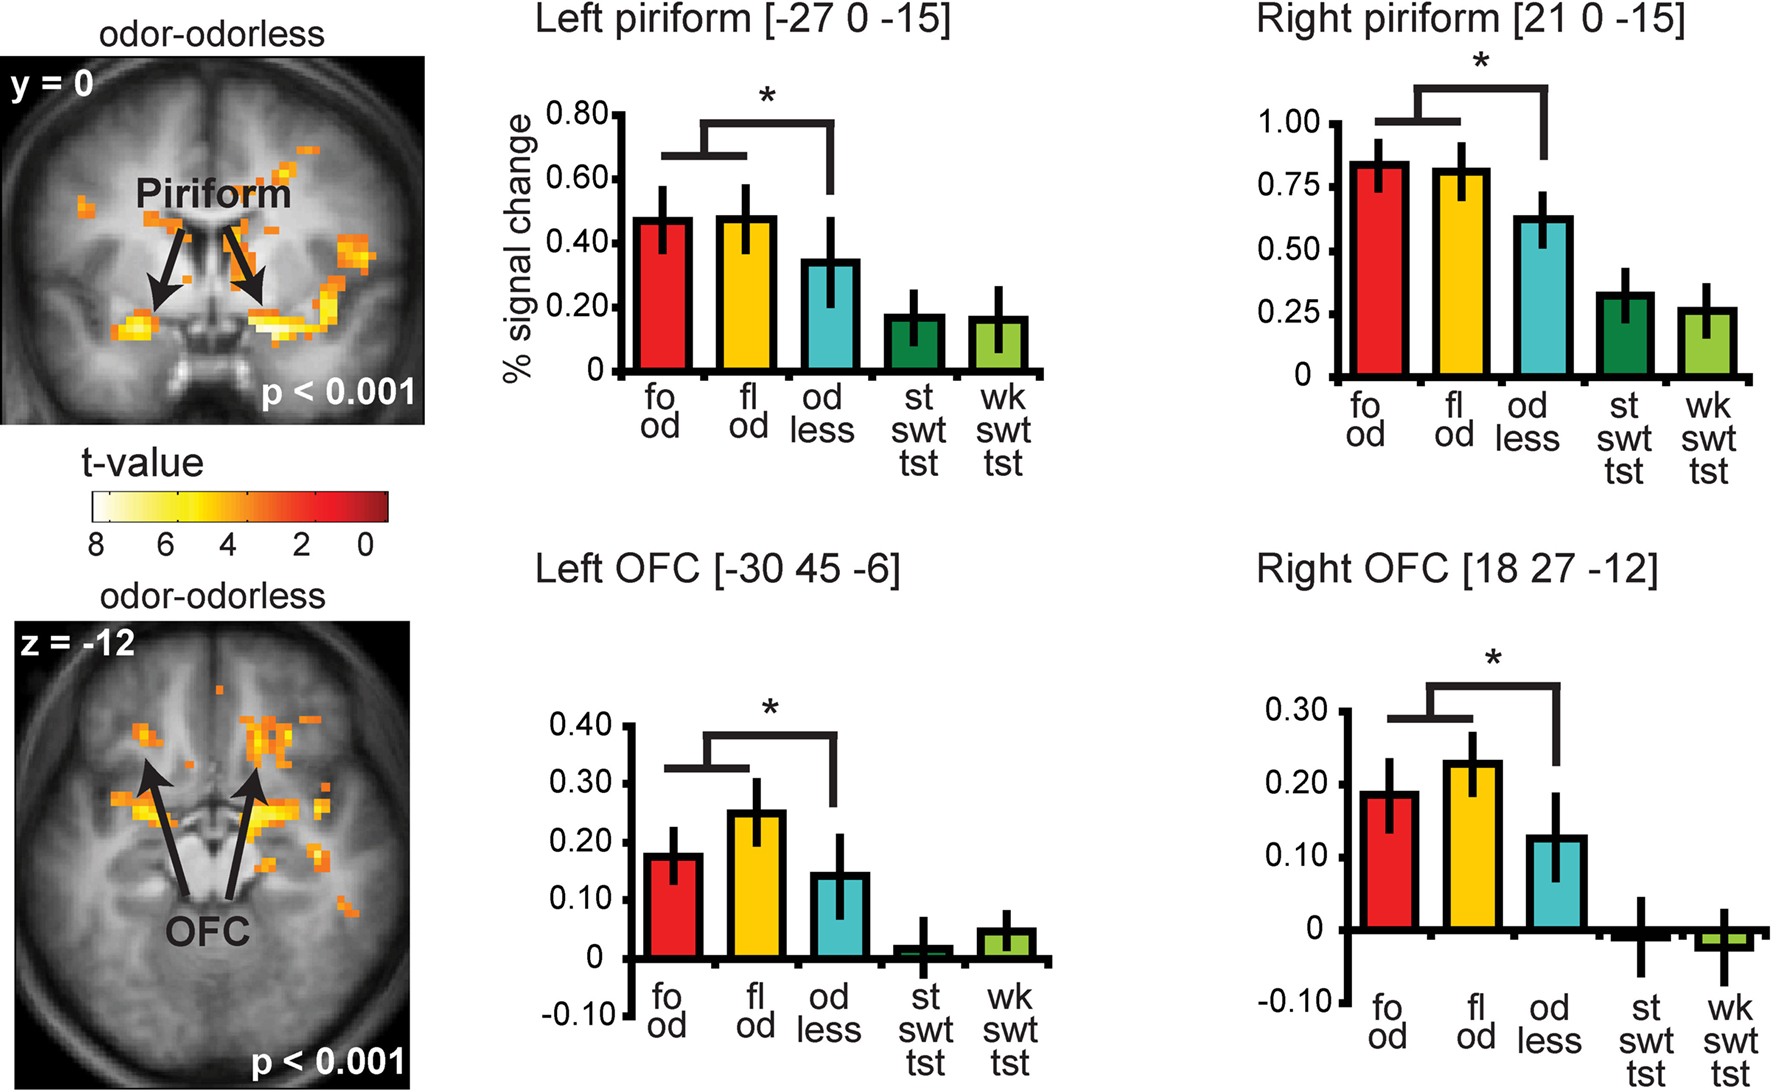
Figure 4. Coronal and axial sections showing neural response to food and floral odors vs. odorless air in bilateral piriform and OFC. The bar graphs show the percent signal change for the three odor conditions: food odors (fo od, red), floral (fl od, yellow), and odorless air (od less, blue) (±s.e.m.), averaged over subjects). The response was taken from the voxel that responded maximally, as identified in the SPM analysis. Thus, these estimates are non-independent, and are provided to illustrate the relative difference in neural response. For illustrative purposes we also plotted the percent signal change for the strong sweet taste (st swt tst, dark green) and the weak sweet taste (wk swt tst, light green), which do not show a differential response in piriform and OFC.
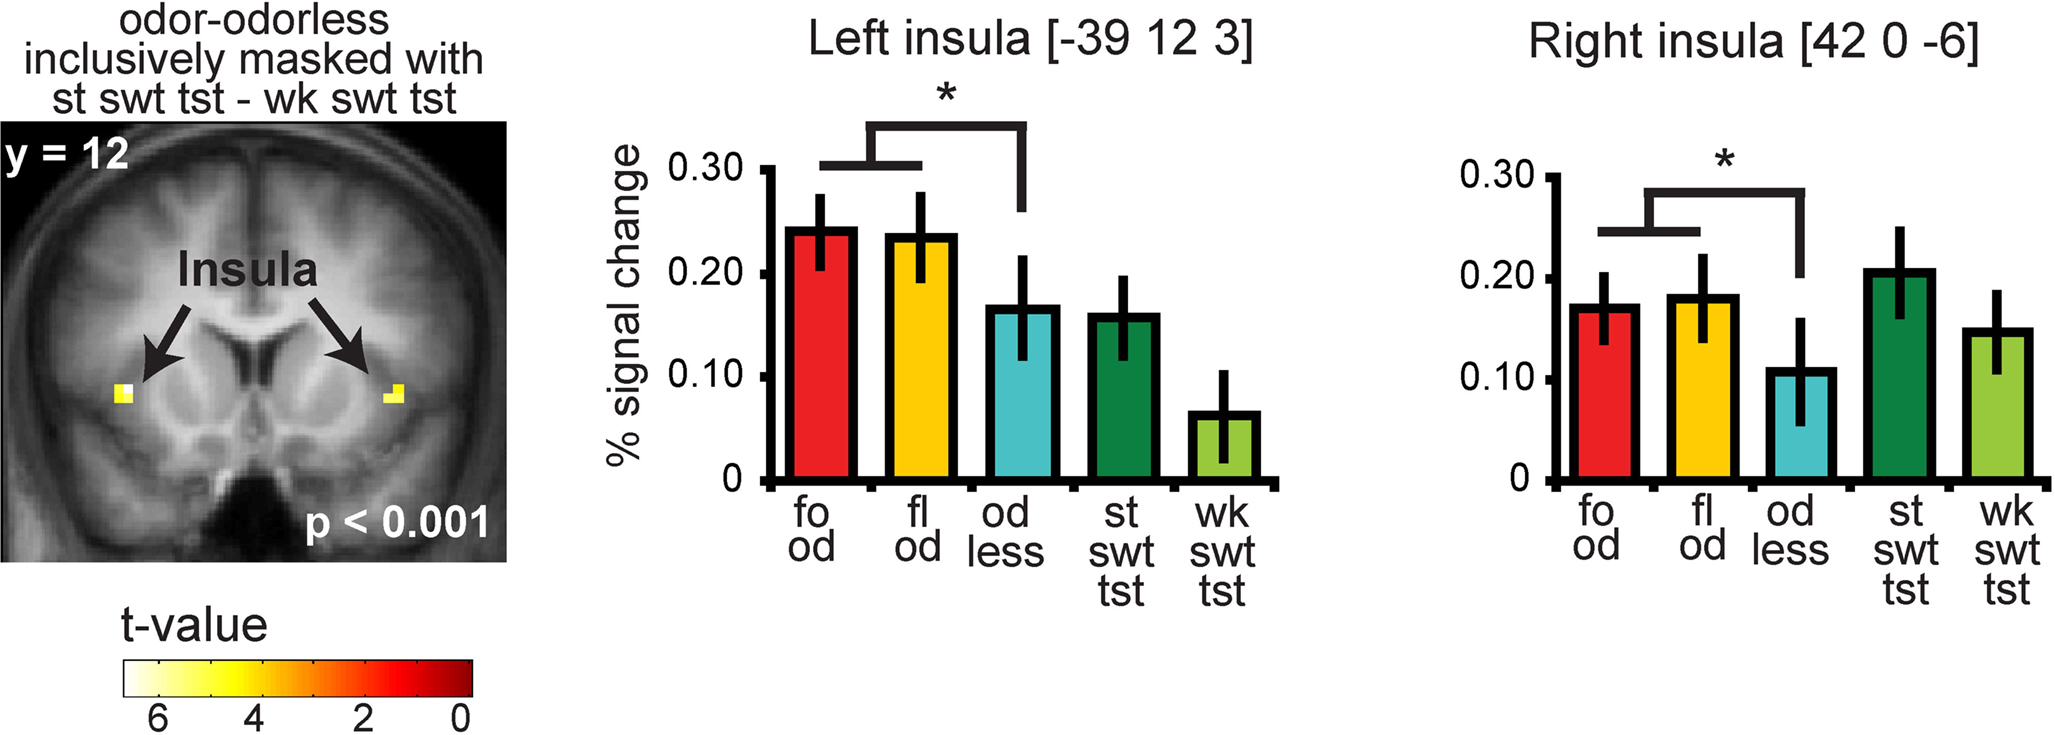
Figure 5. Coronal section showing neural response to food and floral odors vs. odorless air in bilateral insula, inclusively masked by response to strong sweet taste minus weak sweet taste. The bar graphs show the percent signal change for the three odor conditions: food (red), floral (yellow), and odorless air (blue), and the two taste conditions: strong sweet taste (dark green) and the weak sweet taste (light green) (±s.e.m.), averaged over subjects. The response was taken from the voxel that responded maximally, as identified in the SPM analysis. Thus, these estimates are non-independent, and are provided to illustrate the relative difference in neural response.
Significant correlations with odor sweetness
As predicted, we observed a significant association between the BOLD response in the insula to the food odors and the sweetness ratings of those odors (−45 −3 9, Z = 3.73, PFDR-FM = 0.037, k = 4), (Figures 6A and 6B). Importantly, since we used an inclusive mask (sweet odor and sweet taste overlap mask) we can confirm that the effect is in a region of insula that responds to both modalities (Figure 6A, inset 1). No significant correlations were observed between sweetness rating and BOLD response in the insula (or any other region responding to odors and tastes) to the floral odors (Figure 6B). In addition, a direct contrast of the correlation maps between the food and floral odors indicated that the association between BOLD response in the insula and sweetness rating was stronger for the food vs. the floral odors, though this did not survive correction for multiple comparisons across the voxels within the mask, it is significant when we correct across voxels just within the insula (−39 6 12, Z = 3.70, k = 6; PFDR-FM = 0.037). Note that the differential effect of food vs. non-food odors cannot be accounted for by differences in variance in sweetness ratings (box and wisker plot Figure 2). Additionally, including familiarity and pleasantness ratings as covariates did not appreciably change the magnitude of the effect (Z = 3.75 with the covariates, and the peak is displaced by one voxel) (Figure 6A inset 2).
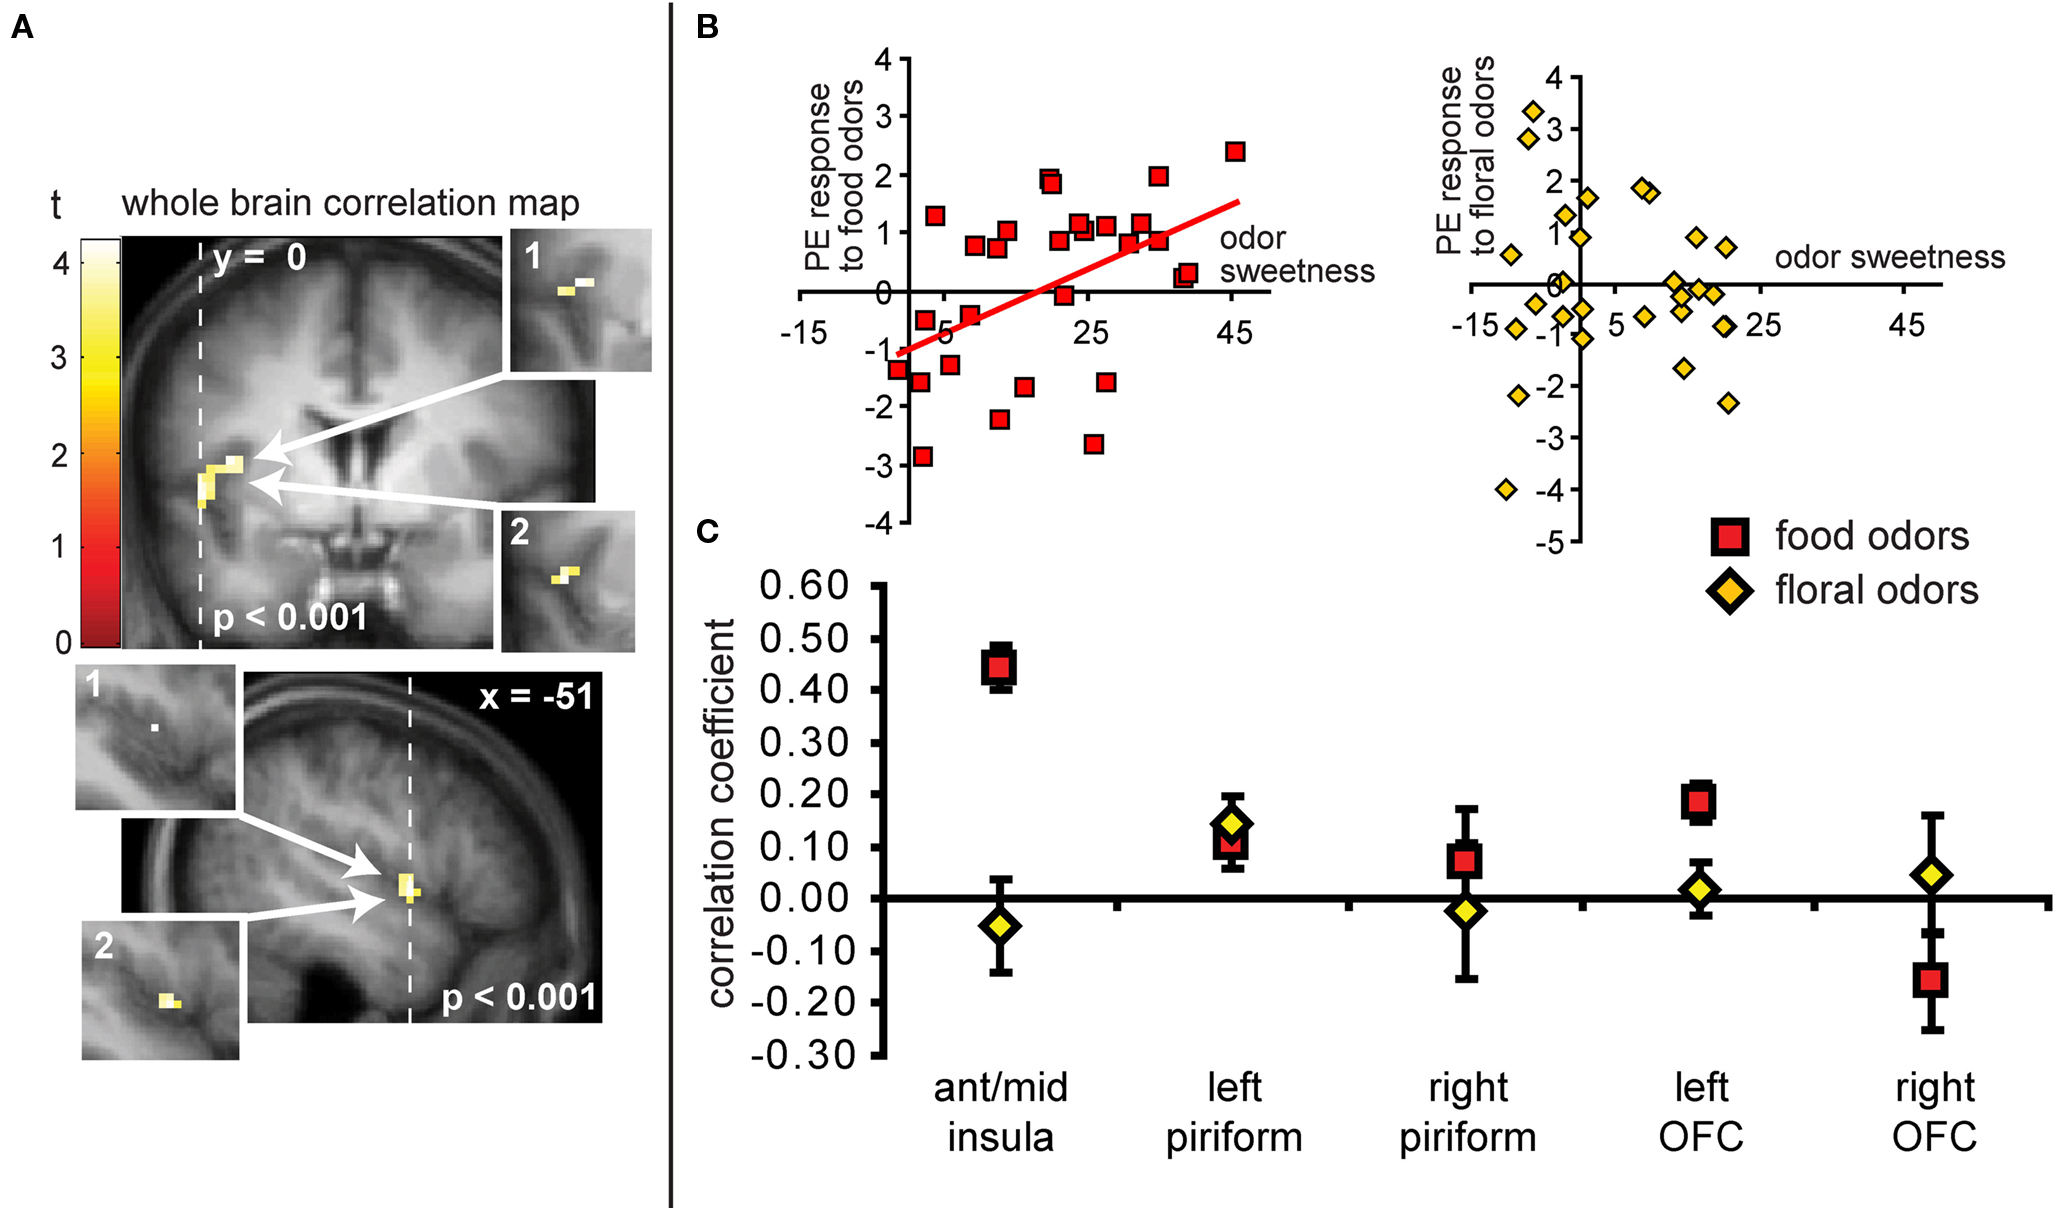
Figure 6. (A) Coronal and sagittal sections of the area of insula where neural response to the food odors shows a positive correlation with the sweetness ratings of those odors. The main images display the unmasked regression maps while the insets labeled 1 depict the masked regressions (i.e., using the “sweet odors and sweet taste overlap” inclusive mask). The insets labeled 2 depict the analysis with the pleasantness and familiarity ratings as covariates. (B) Shows neural response (in parameter estimate) in the insula (at the maximally responding voxel at −45 −3 9), plotted against sweetness ratings for the food (red squares) and floral odors (yellow diamonds). (C) Illustrates the magnitude of the correlation (averaged across all voxels ± standard deviation) in the insula for food odors (in red squares) and non-food odor (yellow diamonds) in comparison to the responses in other areas for food and non-food odors vs. odorless. Note that although there appears to be a significant difference between food and floral odors in the left OFC, this effect this effect does not survive our criterion for significance in SPM and is therefore not discussed.
Neither the responses in the piriform cortex nor in the OFC correlated with sweetness ratings for the food or for the floral odors (analyses performed without the mask) (Figure 6C).
Discussion
Photons give rise to the perception of light and vibrations to sound. Like vision and audition, the sensations of taste and smell also result from distinct physical stimuli, and have distinct peripheral transduction mechanisms and separate central pathways. However, certain odorants, while binding uniquely to olfactory receptors, can result in the perception of taste-like properties. The aim of the current study was to determine if the sweet taste-like quality of odors is encoded in primary olfactory cortex, which is known to code other aspects of odor quality (Gottfried et al., 2006; Li et al., 2008) or in primary insular taste cortex, which is thought to play a role in representing taste quality (Scott and Plata-Salaman, 1999; Schoenfeld et al., 2004).
Olfactory and Gustatory Stimuli Activate Overlapping Regions of Insular Cortex
Consistent with prior neuroimaging studies of olfaction (Savic, 2002; Sobel et al., 2003; Gottfried and Zald, 2005; Gottfried, 2006), we found that sniffing odorized compared to odorless air resulted in activation in the piriform cortex, OFC, and insula (Figures 4 and 5). Of these areas, only the insular cortex responded to sweet taste. This finding extends previous literature because it is the first demonstration of overlapping insular responses to sniffed odors and to sipped tastes in the same subjects. It is also consistent with prior studies showing overlapping responses to sipped odors (e.g., retronasal odors) and tastes within the insula (De Araujo et al., 2003; Small et al., 2004), with electrophysiological work in primates showing single-unit responses to olfactory stimuli in primary taste cortex (Scott and Plata-Salaman, 1999), and with a recent study in rodents showing that inactivation of taste cortex results in olfactory learning deficits (Fortis-Santiago et al., 2010). We therefore suggest that there is strong support for olfactory representation in insular taste cortex in rodents, monkeys and humans.
The Insular Taste Cortex is Sensitive to the Sweetness of Food Odors
Overlapping representation does not necessarily imply a functional role for taste cortex in odor coding. Here, we reasoned that the insular taste cortex contributes to olfactory perception by coding the taste-like properties of odors. This possibility is supported by prior work showing that insular lesions are associated with impairments in taste and odor-induced taste perception (Stevenson et al., 2008). However, since lesions cannot be experimentally induced and it is hard to deactivate the insula with transcranial magnetic stimulation (due do its buried location), it is not possible to know if there is a critical region of insula involved in olfaction, or if such a region plays a role in both taste and olfactory perception. In the present study we demonstrate that the magnitude of response to the food odors in the region of the insula that responds to sweet taste is related to the odor sweetness ratings. More specifically, the sweeter the food odor is rated, the stronger the response is. We also show that this effect is selective since it is not moderated by odor pleasantness or odor familiarity and it does not occur in the piriform or OFC. This suggests that it is sweetness intensity rather than related perceptual properties that is specifically driving the overall insular, and not the piriform or orbital responses to the food odors. However, while this finding strongly supports a role for the insular cortex in representing taste-like properties of odors, we cannot rule out the possibility of taste-like quality representation in olfactory cortex since we did not use a wide range of sweet odors (including a non-sweet odor), nor did we test the full range of taste qualities (e.g., salty or sour). Additionally, it is possible that the overall pattern of activity is related to sweetness but is coded in a more complex way that does not result in greater overall activation as a function of sweetness intensity perception. Future studies optimized for pattern classification analyses will be required to test this possibility.
The Insular Cortex is not Sensitive to the Sweetness of Non-Food Odors
Although the insula responded equally to food and to non-food odors, the magnitude of the response to the non-food odors did not vary as a function of their sweetness ratings. Two conclusions can be drawn from this result. First, since the food odors were sweeter than the non-food odors, but the response was similar, it is clear that sweetness alone cannot account for insular response to all odors. This conclusion accords with other work showing that the insula responds to odors of widely varying qualities. For example, food, body, and floral odors, as well as disgusting odors like feces or rubbish (Poellinger et al., 2001; Heining et al., 2003; Small et al., 2005; Lundström et al., 2009). Therefore it is clearly the case that insular response to odors is not dependent upon the odor being a food-related odor or upon the odor possessing a taste-like quality. Second, since the correlation between sweetness and response was observed only for the food odors there must be something special about the relationship between food odors and taste-like qualities that accounts for the association. We propose that the key to the selective association between sweetness and insular response to food odors can be explained by learning. More specifically, this region of insular cortex is heteromodal, and in particular, contains neurons sensitive to multiple sensory aspects of foods. It is therefore possible that associations between the independent sensory inputs that comprise a flavor are made within this region. Consistent with this possibility we speculate that all odors have the ability to activate insular neurons and that through learning processes the strength between cells that fire together is strengthened. In the case of food odors this may manifest as an association between co-activated taste and odor cells during eating and drinking. Upon future sensation of the odor the specific taste cells that had been activated by the flavor stimulus may come to be sensitive to the odor alone (Small, 2008). If such a process exists, it would be expected that the magnitude of the taste sensation would be related to the magnitude of the response and that the region would also respond to odors without taste-like properties. This proposal is consistent with work in rodents showing that insular lesions disrupt taste-odor association learning (Sakai and Imada, 2003; Fortis-Santiago et al., 2010) and attenuate odor potentiated taste aversion learning (Inui et al., 2006), and with work in humans showing that BOLD response to flavor is dependent upon the rated familiarity of the taste-odor combination (Small et al., 2004), indicating that experience changes neural response to flavors. It may also represent the neural correlate of the acquisition of taste-like properties by odors, in which odors that are experienced in solution with a taste come to be perceived as smelling more like that taste when subsequently sniffed (Stevenson et al., 1995; Stevenson and Boakes, 2004). An important avenue for further research will be to determine whether the perceptual-acquisition of a taste-like property is dependent upon insular response.
We also note that the lack of association between sweetness and insular response to the non-food odors cannot be accounted for by a lack of variation in odor sweetness ratings, as similar variances were found for both the food and the non-food odors (Figure 2). However, because the overall magnitude of the sweetness rating was significantly greater for the food odors, we cannot rule out the possibility that a relationship between perception and insular response might be present for non-food odors with higher sweetness intensity than the rose and lilac odors used in the current study.
Conclusion
Odors and tastes may both evoke the perception of sweetness. In the current study we show that sweet tastes and odors activate a common area of insular cortex and that the magnitude of this response in this region to food odors is associated with perceived sweetness but not perceived familiarity or pleasantness. Moreover, we show that the effect is specific to insular cortex and provide preliminary evidence that it may be experience-dependent. We conclude that insular taste cortex contributes to odor quality coding by imparting taste-like notes to the olfactory percept.
Conflict of Interest Statement
The authors declare that the research was conducted in the absence of any commercial or financial relationships that could be construed as a potential conflict of interest.
Acknowledgments
This work was supported by NIDCD grants RO3 DC006169 and R01 DC006706 to D.M.S.
Supplementary Material
The Supplementary Material for this article can be found online at http://www.frontiersin.org/neuroscience/humanneuroscience/paper/10.3389/fnhum.2010.00058/
References
Bartoshuk, L. M., Duffy, V. B., Green, B. G., Hoffman, H. J., Ko, C. W., Lucchina, L. A., Marks, L. E., Snyder, D. J., and Weiffenbach, J. M. (2004). Valid across-group comparisons with labeled scales: the gLMS versus magnitude matching. Physiol. Behav. 82, 109–114.
Bartoshuk, L. M., McBurney, D. H., and Pfaffmann, C. (1964). Taste of sodium chloride solutions after adaptation to sodium chloride: implications for the “water taste”. Science 143, 967–968.
Cerf-Ducastel, B., and Murphy, C. (2001). fMRI activation in response to odorants orally delivered in aqueous solutions. Chem. Senses 26, 625–637.
De Araujo, I. E., Rolls, E. T., Kringelbach, M. L., McGlone, F., and Phillips, N. (2003). Taste-olfactory convergence, and the representation of the pleasantness of flavour, in the human brain. Eur. J. Neurosci. 18, 2059–2068.
Fortis-Santiago, Y., Rodwin, B. A., Neseliler, S., Piette, C. E., and Katz, D. B. (2010). State dependence of olfactory perception as a function of taste cortical inactivation. Nat. Neurosci. 13, 158–159.
Frank, R. A., and Byram, J. (1988). Taste–smell interactions are tastant and odorant dependent. Chem. Senses 13, 445–455.
Frey, S., and Petrides, M. (1999). Re-examination of the human taste region: a positron emission tomography study. Eur. J. Neurosci. 11, 2985–2988.
Friston, K. J., Holmes, A. P., Worsley, K. J., Poline, J. B., Frith, C. D., and Frackowiak, R. S. J. (1995). Statistical parametric maps in functional imaging. Hum. brain mapp. 2, 189–210.
Gottfried, J. A. (2006). “Smell: central nervous processing,” in Taste and Smell. An Update, Vol. 63, eds T. Hummel and A. Welge-Lüssen (Basel: Karger), 44–69.
Gottfried, J. A., Winston, J. S., and Dolan, R. J. (2006). Dissociable codes of odor quality and odorant structure in human piriform cortex. Neuron 49, 467–479.
Gottfried, J. A., and Zald, D. H. (2005). On the scent of human olfactory orbitofrontal cortex: meta-analysis and comparison to non-human primates. Brain Res. Rev. 50, 287–304.
Green, B. G., Dalton, P., Cowart, B., Shaffer, G., Rankin, K., and Higgins, J. (1996). Evaluating the ‘labeled magnitude scale’ for measuring sensations of taste and smell. Chem. Senses 21, 323–334.
Heining, M., Young, A. W., Ioannou, G., Andrew, C. M., Brammer, M. J., Gray, J. A., and Phillips, M. L. (2003). Disgusting smells activate human anterior insula and ventral striatum. Ann. N. Y. Acad. Sci. 1000, 380–384.
Henson, R. N., Price, C. J., Rugg, M. D., Turner, R., and Friston, K. J. (2002). Detecting latency differences in event-related BOLD responses: application to words versus nonwords and initial versus repeated face presentations. Neuroimage 15, 83–97.
Inui, T., Shimura, T., and Yamamoto, T. (2006). Effects of brain lesions on taste-potentiated odor aversion in rats. Behav. Neurosci. 120, 590–599.
Jabbi, M., Keysers, C., Singer, T., and Stephan, K. E. (2009). Rebuttal of “Voodoo Correlations in Social Neuroscience” by Vul et al. Summary information for the press.
Johnson, B. N., and Sobel, N. (2007). Methods for building an olfactometer with known concentration outcomes. J. Neurosci. Methods 160, 231–245.
Lawless, H. T., and Heymann, H. (1999). Sensory Evaluation of Food. Principles and Practices. Gaithersburg: Aspen Publisher, Inc.
Li, W., Howard, J. D., Parrish, T. B., and Gottfried, J. A. (2008). Aversive learning enhances perceptual and cortical discrimination of indiscriminable odor cues. Science 319, 1842–1845.
Lindquist, M. A., and Gelman, A. (2009). Correlations and multiple comparisons in functional imaging: a statistical perspective (Commentary on Vul et al., 2009). Perspect. Psychol. Sci. 4, 310–313.
Lundström, J. N., Boyle, J. A., Zatorre, R. J., and Jones-Gotman, M. (2009). The neuronal substrates of human olfactory based kin recognition. Hum. Brain Mapp. 30, 2571–2580.
Macey, P. M., Macey, K. E., Kumar, R., and Harper, R. M. (2004). A method for removal of global effects from fMRI time series. Neuroimage 22, 360–366.
Mak, Y. E., Simmons, K. B., Gitelman, D. R., and Small, D. M. (2005). Taste and olfactory intensity perception changes following left insular stroke. Behav. Neurosci. 119, 1693–1700.
Martin, R. E., MacIntosh, B. J., Smith, R. C., Barr, A. M., Stevens, T. K., Gati, J. S., and Menon, R. S. (2004). Cerebral areas processing swallowing and tongue movement are overlapping but distinct: a functional magnetic resonance imaging study. J. Neurophys. 92, 2428–2443.
Mesulam, M. M., and Mufson, E. J. (1985). The insula of Reil in man and monkey. Cereb. Cortex 4, 179–225.
O’Doherty, J., Rolls, E. T., Francis, S., Bowtell, R., and McGlone, F. (2001). Representation of pleasant and aversive taste in the human brain. J. Neurophysiol. 85, 1315–1321.
Oldfield, R. C. (1971). The assessment and analysis of handedness: the Edinburgh inventory. Neuropsychologia 9, 97–113.
Poellinger, A., Thomas, R., Lio, P., Lee, A., Makris, N., Rosen, B. R., and Kwong, K. K. (2001). Activation and habituation in olfaction – an fMRI study. Neuroimage 13, 547–560.
Rolls, E. T., Kringelbach, M. L., and de Araujo, I. E. (2003). Different representations of pleasant and unpleasant odours in the human brain. Eur. J. Neurosci. 18, 695–703.
Sakai, N., and Imada, S. (2003). Bilateral lesions of the insular cortex or of the prefrontal cortex block the association between taste and odor in the rat. Neurobiol. Learn. Mem. 80, 24–31.
Savic, I. (2002). Imaging of brain activation by odorants in humans. Curr. Opin. Neurobiol. 12, 455–461.
Schifferstein, H. N. J., and Verlegh, P. W. J. (1996). The role of congruency and pleasantness in odor-induced taste enhancement. Acta Psychol. 94, 87–105.
Schoenfeld, M. A., Neuer, G., Tempelmann, C., Schussler, K., Noesselt, T., Hopf, J. M., and Heinze, H. J. (2004). Functional magnetic resonance tomography correlates of taste perception in the human primary taste cortex. Neuroscience 127, 347–353.
Scott, T. R., and Plata-Salaman, C. R. (1999). Taste in the monkey cortex. Physiol. Behav. 67, 489–511.
Small, D. M. (2008). Flavor and the formation of category-specific processing in olfaction. Chemosens. Percept. 1, 136–146.
Small, D. M., Gerber, J. C., Mak, Y. E., and Hummel, T. (2005). Differential neural responses evoked by orthonasal versus retronasal odorant perception in humans. Neuron 47, 593–605.
Small, D. M., Veldhuizen, M. G., Felsted, J., Mak, Y. E., and McGlone, F. (2008). Separable substrates for anticipatory and consummatory food chemosensation. Neuron 57, 786–797.
Small, D. M., Voss, J., Mak, Y. E., Simmons, K. B., Parrish, T., and Gitelman, D. (2004). Experience-dependent neural integration of taste and smell in the human brain. J. Neurophysiol. 92, 1892–1903.
Sobel, N., Johnson, B., Mainland, J., and Yousem, D. M. (2003). “Functional neuroimaging of human olfaction,” in Handbook of Olfaction and Gustation, ed. R. L. Doty (New York: Dekker), 251–273.
Stevenson, R. J., and Boakes, R. A. (2004). “Sweet and sour smells: learned synesthesia between the senses of taste and smell,” in Handbook of Multisensory Processing, eds G. Calvert, C. Spence, and B. Stein. (Boston: MIT Press), 69–83.
Stevenson, R. J., Miller, L. A., and Thayer, Z. C. (2008). Impairments in the perception of odor-induced tastes and their relationship to impairments in taste perception. J. Exp. Psychol. Hum. Percept. Perform. 34, 1183–1197.
Stevenson, R. J., Prescott, J., and Boakes, R. A. (1995). The acquisition of taste properties by odors. Learn. Motiv. 26, 433–455.
Veldhuizen, M. G., Bender, G., Constable, R. T., and Small, D. M. (2007). Trying to detect taste in a tasteless solution: modulation of early gustatory cortex by attention to taste. Chem. Senses 32, 569–581.
Verhagen, J. V., and Engelen, L. (2006). The neurocognitive bases of human multimodal food perception: sensory integration. Neurosci. Biobehav. Rev. 30, 613–650.
Vul, E., Harris, C., Winkielman, P., and Pashler, H. E. (2009). Puzzingly high correlations in fMRI studies of emotion, personality, and social cognition. Perspect. Psychol. Sci. 4, 274–290.
Wilson, D. A., and Stevenson, R. J. (2003a). Olfactory perceptual learning: the critical role of memory in odor discrimination. Neurosci. Biobehav. Rev. 27, 307–328.
Wilson, D. A., and Stevenson, R. J. (2003b). The fundamental role of memory in olfactory perception. Trends Neurosci. 26, 243–247.
Worsley K.J., Friston K.J. (1995). Analysis of fMRI time-series revisited-again. Neuroimage 2, 173–181.
Keywords: gustatory, sweet, fMRI, olfactory, piriform, insula, multimodal, flavor
Citation: Veldhuizen MG, Nachtigal D, Teulings L, Gitelman DR and Small DM (2010) The insular taste cortex contributes to odor quality coding. Front. Hum. Neurosci. 4:58. doi: 10.3389/fnhum.2010.00058
Received: 08 April 2010;
Paper pending published: 23 May 2010;
Accepted: 29 June 2010;
Published online: 21 July 2010
Edited by:
Russell A. Poldrack, University of California, USAReviewed by:
Noam Sobel, The Weizmann Institute of Science, IsraelRussell A. Poldrack, University of California, USA
Copyright: © 2010 Veldhuizen, Nachtigal, Teulings, Gitelman and Small. This is an open-access article subject to an exclusive license agreement between the authors and the Frontiers Research Foundation, which permits unrestricted use, distribution, and reproduction in any medium, provided the original authors and source are credited.
*Correspondence: Maria G. Veldhuizen and Dana M. Small, The John B Pierce Laboratory, 290 Congress Avenue, New Haven, CT 06519, USA. e-mail: mveldhuizen@jbpierce.org; dsmall@jbpierce.org