Decoding developmental differences and individual variability in response inhibition through predictive analyses across individuals
- 1 Department of Psychology, University of California, Los Angeles, CA, USA
- 2 Department of Psychiatry and Biobehavioral Sciences, University of California, Los Angeles, CA, USA
- 3 Brain Research Institute, University of California, Los Angeles, CA, USA
Response inhibition is thought to improve throughout childhood and into adulthood. Despite the relationship between age and the ability to stop ongoing behavior, questions remain regarding whether these age-related changes reflect improvements in response inhibition or in other factors that contribute to response performance variability. Functional neuroimaging data shows age-related changes in neural activity during response inhibition. While traditional methods of exploring neuroimaging data are limited to determining correlational relationships, newer methods can determine predictability and can begin to answer these questions. Therefore, the goal of the current study was to determine which aspects of neural function predict individual differences in age, inhibitory function, response speed, and response time variability. We administered a stop-signal task requiring rapid inhibition of ongoing motor responses to healthy participants aged 9–30. We conducted a standard analysis using GLM and a predictive analysis using high-dimensional regression methods. During successful response inhibition we found regions typically involved in motor control, such as the ACC and striatum, that were correlated with either age, response inhibition (as indexed by stop-signal reaction time; SSRT), response speed, or response time variability. However, when examining which variables neural data could predict, we found that age and SSRT, but not speed or variability of response execution, were predicted by neural activity during successful response inhibition. This predictive relationship provides novel evidence that developmental differences and individual differences in response inhibition are related specifically to inhibitory processes. More generally, this study demonstrates a new approach to identifying the neurocognitive bases of individual differences.
Introduction
The ability to rapidly cancel planned or ongoing behaviors, referred to as response inhibition, is crucial to adaptive behavior and is known to improve throughout childhood and into adulthood (Casey et al., 1997 ; Williams et al., 1999 ; Durston et al., 2002 ). A network of cortical and basal ganglia regions that are not fully developed until adulthood (Giedd et al., 1999 ; Sowell et al., 1999 ) has been identified as being critical for this form of executive control, including the right inferior frontal gyrus (IFG), pre-supplementary motor area (preSMA), and subthalamic nucleus (STN). The necessity of these regions for response inhibition has been established by lesion (Aron et al., 2003 ; Floden and Stuss, 2006 ; Picton et al., 2007 ) and transcranial magnetic stimulation (Chambers et al., 2007 , 2006 ; Chen et al., 2009 ) studies, which demonstrate that disruption of right IFG and preSMA functioning specifically impairs response inhibition, as compared to response execution, while disrupting other prefrontal areas has no effect. Additionally, deep brain stimulation of the STN in Parkinson’s disease has been shown to enhance response inhibition (van den Wildenberg et al., 2006 ). Moreover, there is evidence for direct white matter connectivity between the STN, right IFG, and preSMA (Aron et al., 2007 ), which further supports the existence of this network. Lastly, both age and behavior have been found to correlate with brain activity in these regions, indicating that individual differences in the engagement of this network may relate to variability in behavior. For example, adults have greater activity than children during inhibition in the right IFG (Bunge et al., 2002 ; Durston et al., 2002 ; Rubia et al., 2007 ). It has also been found that activity in the right IFG and STN rises with increasingly successful response inhibition in adults (Aron and Poldrack, 2006 ).
The stop-signal paradigm (Logan, 1994 ) is commonly used to measure the rapid engagement of response inhibition. In this task, participants are presented with a simple choice response task (e.g., pressing a left or right button in response to an arrow pointing left or right), but a small proportion of trials are presented with a “stop-signal” (often an auditory tone), which signals to participants to withhold their response. A unique feature of this task is the ability to estimate a continuous measure of response inhibition, known as the “stop-signal reaction time” (SSRT), using a model known as the independent race model (Logan and Cowan, 1984 ; Band et al., 2003 ). As a measure of response inhibition ability, SSRT is both highly reliable and has substantial external validity, exhibiting relations with self-reported impulsivity in the population (Logan et al., 1997 ). In addition, SSRT is significantly lengthened in a number of impulse control disorders, including attention deficit/hyperactivity disorder (ADHD; Logan et al., 2000 ; Lijffijt et al., 2005 ), substance use (Fillmore and Rush, 2002 ; Monterosso et al., 2005 ), and obsessive-compulsive disorder (OCD; Chamberlain et al., 2006 ).
Despite the strong observed relations between age, SSRT, and neural activity during successful response inhibition, there remain questions regarding the degree to which these relationships truly reflect underlying variability in inhibitory control functions. In particular, it has been noted that although individuals with ADHD show impairments in SSRT, they show even greater impairments in the variability of response times on “Go” trials (Lijffijt et al., 2005 ). Because increased variability in response times can result in spurious increases in SSRT, it is possible that the previous findings of slower SSRT in children as compared to adults could instead reflect variability in behavior rather than reduced inhibitory control in children. Unfortunately, with analyses being limited to how individual difference variables are correlated with neural activity and each other, it has not been possible to determine if there is a predictive relationship between neural activity and these variables during response inhibition or if they are simply correlated.
Therefore, the goal of the present study was to determine which aspects of neural function enable prediction of individual differences in age, response inhibition, response execution, and response time variability. More precisely, we wished to clarify whether neural function during successful inhibitory control is specifically predictive of age and SSRT. A large body of work has shown that individual difference variables often exhibit substantial correlations with functional neuroimaging data (Miller et al., 2002 ). These findings are often couched in terms of “prediction”. However, the correlation within a particular sample generally overestimates the ability to predict to new samples because the predictions will include a contribution from the noise in the data in addition to the true signal. This distinction between training versus generalization error is a fundamental concept in the field of statistical learning, which focuses on the development of methods that enable optimal predictions about new observations based on existing data (Hastie et al., 2001 ). These methods have been used extensively within the fMRI literature to decode mental states based on fMRI data (Haynes and Rees, 2006 ; O’Toole et al., 2007 ); they have largely been used to predict within participants (i.e., predict mental states on one set of scans based on another set of scans from the same individual), but recent work has shown that these methods can also predict across individuals (Poldrack et al., 2009 ). Further, previous work has focused on classification into discrete categories (e.g., different stimulus classes), rather than prediction of quantitative differences (i.e., regression). We applied high-dimensional regression methods to fMRI data from a healthy developmental sample of participants performing the stop-signal task in order to determine which aspects of the task can be used to decode quantitative differences in age and behavior. We hypothesized that if age and SSRT could be decoded from neural activity during successful inhibitory control then we would provide stronger evidence that individual and developmental differences in these variables are directly related to inhibitory function, as opposed to reflecting some aspect of response execution. We found that while neural activity during successful response inhibition was correlated with age, response inhibition performance, speed of response execution, and variability of response execution, only age and response inhibition performance were successfully decoded from activation during successful inhibition. This specific predictive relation provides novel evidence that developmental differences as well as individual differences in SSRT are specifically related to inhibitory processes.
Materials and Methods
Participants
Sixty seven healthy typically-developing right-handed participants between the ages of 9 and 30 were recruited from the community as control participants for a study of childhood onset schizophrenia. They were recruited with online advertisements and by randomly calling families found through a commercially available list of households within a 25-mile radius of UCLA (Survey Sampling Inc., Fairfield, CT, USA). Potential participants (or their parents, for minors) were interviewed to determine whether they met inclusion/exclusion criteria for the study. Participants were eligible if they had no history of CNS disease, DSM-IV disorders, or learning disabilities and no treatment with anti-psychotic drugs or substance use in the past 2 years. Additionally, they could not have any metal in their bodies other than dental fillings, and could not be pregnant. Of these 67 potential participants, 61 were eligible to participate in the MRI study. Of these, 25 were excluded because of: technical issues (1; field of view did not cover the entire brain), excessive motion (3; more than one translational displacement of 3 mm or greater), or poor performance (21; poor performance defined a priori as a response rate on the Go task of less than 90%, more than 10% incorrect trials on the Go task, percent inhibition on the Stop task less than 25% or greater than 75%, or an SSRT of less than 80 ms). This proportion of participants excluded for behavior is comparable to that in other fMRI studies of the stop-signal task using a developmental population (Leibenluft et al., 2007 ). Of the remaining 36 participants included in this analysis, there were 27 youth aged 9–19 (mean age 13.7, 16 females) and 9 adults aged 25–30 (mean age 26.6, 4 females). All participants (and their parents if they were under 18) provided written informed consent or assent (for minors) according to the procedures of the UCLA Institutional Review Board.
Experimental Design and Procedure
Participants performed four runs of the stop-signal task (Logan, 1994 ; Figure 1 A). Two training runs were conducted before the functional scans, one approximately a week before the scanning session and one just before functional scanning. These two training runs were administered to ensure that participants understood the task; feedback was given after each run. The last two runs were during fMRI acquisition. The primary task was a simple two-choice reaction time task with spatially compatible stimulus-response mappings. On Go trials, participants pressed the right button with their right middle finger if an arrow pointed rightwards and the left button with their right index finger if the arrow pointed leftwards. On each Go trial, a warning signal (open circle) appeared on the computer monitor for 500 ms (visual angle subtended 4.9° × 4.9°). An arrow then appeared in the center of the circle until either the participant responded or 1000 ms elapsed. The duration of the blank screen between the trials was jittered between 500 and 4000 ms (mean 1000 ms, sampled from an exponential distribution) so as to optimize the contrast of successful Stop trials with successful Go trials. For the two behavioral runs, instead of a jittered inter-trial interval, each delay lasted 500 ms.
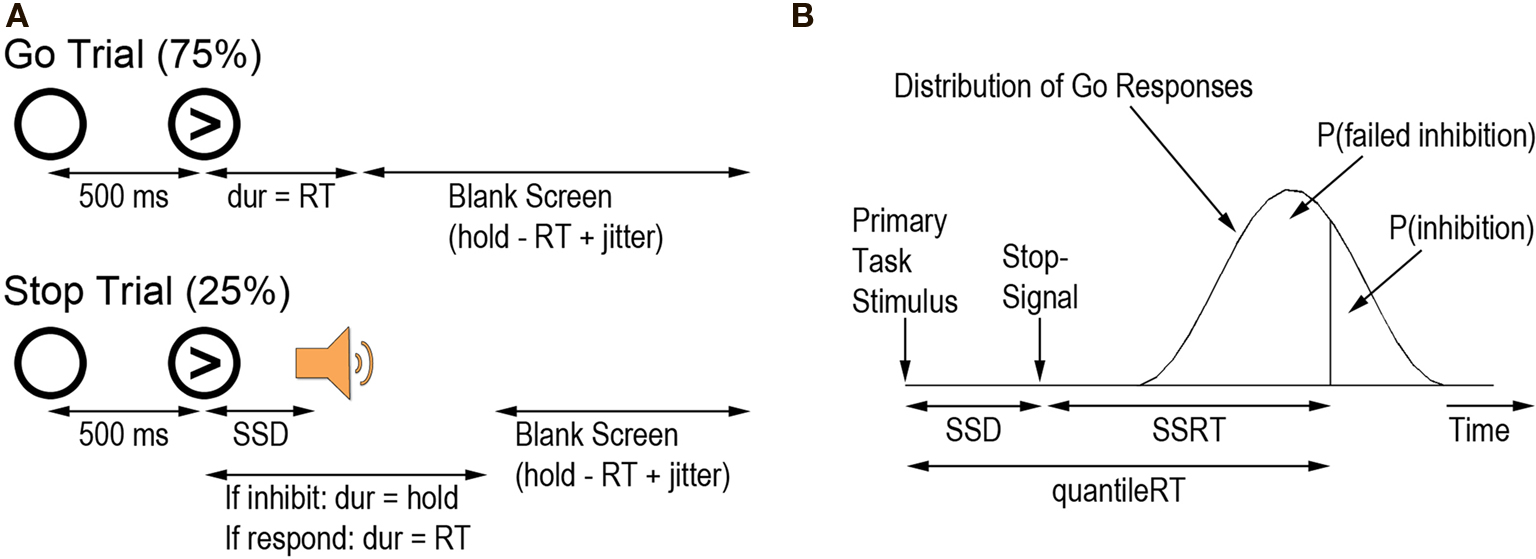
Figure 1. (A) Schematic of go trials and stop trials. (B) The race model of stopping (Logan and Cowan, 1984 ). All correct RTs were arranged in ascending order in an assumption-free distribution to calculate the RT at each participant’s proportion of failed inhibition (quantileRT). SSRT could then be calculated as quantileRT – SSD. Figure adapted from Aron et al. (2006) .
On 25% of the trials (Stop trials), a tone was sounded and participants tried to inhibit their already initiated response to the arrow. The tone was presented at varying delays (the stop-signal delay; SSD) after the onset of the primary stimulus. If participants responded on a Stop trial, the trial proceeded as if it were a Go trial. If participants inhibited their response, the arrow remained on the screen for 1000 ms, followed by the jittered interval between trials. An adaptive tracking procedure (1-up, 1-down staircase) was used to adjust the SSD to produce approximately 50% successful inhibition. Two independent staircase functions with a step size of 50 ms were used, with starting delays on the first run of the stop-signal task of 200 ms and 320 ms respectively. For runs 2–4, the average SSD of each staircase on the previous run was used as each staircase’s starting value.
Each run had 128 trials: 96 Go trials and 32 Stop trials. For each eight trials, there were four left arrows and four right arrows. There were also two Stop trials (one for each ladder). Order of arrow direction, Stop trial ladder, and on which trials the stop-signal occurred were randomized.
The MATLAB (The MathWorks, Inc., Natick, MA, USA) Psychophysics Toolbox (Brainard, 1997 ) version 7.4 was used to present the stimuli to participants and to record their responses. Participants viewed the task through LCD goggles and responded using an MR-compatible button box.
fMRI Data Acquisition
Imaging data were collected with a 3T head-only Siemens Allegra scanner at the UCLA Ahmanson-Lovelace Brain Mapping Center. For each functional run we collected 182 T2*-weighted echoplanar images (33 slices, slice thickness 4 mm, TR = 2000 ms, TE = 30 ms, flip angle = 90°, matrix 64 × 64, field of view 200 mm). A T2-weighted matched-bandwidth high-resolution anatomical scan with the same slice prescription as the functional images was also acquired. Lastly, a magnetization-prepared rapid-acquisition gradient echo (MPRage; 160 sagittal slices, slice thickness 1 mm, TR = 2000 ms, TE = 2.1 ms, matrix 192 × 192, field of view 256) was collected.
Behavioral Data Analysis
Go task response time (GoRT) and accuracy (GoAcc), standard deviation of GoRT (SDRT), percent successful inhibition, average SSD, and SSRT were calculated for each participant. Only correct Go trials were included in the GoRT analyses. SSRT was calculated according to the race model of stopping (Logan and Cowan, 1984 ). The race model assumes that the Go and Stop processes occur in parallel and are stochastically independent (although when using the tracking method this assumption is not critical; see Band et al., 2003 ). To calculate SSRT, first all correct RTs were arranged in an assumption-free distribution in ascending order. Then the proportion of failed inhibition (i.e., the proportion of Stop trials on which the participant responded) was determined. The RT corresponding to that proportion was computed: the quantileRT (i.e., if failed inhibition was 0.55, the RT corresponding to 55% of the area under the RT distribution curve was the quantileRT). SSRT was calculated as the difference between the quantileRT and the average SSD (Figure 1 B). Correlations with behavior were conducted using robust linear regression with iteratively reweighted least squares to deweight outliers.
fMRI Data Analysis
Imaging data were processed and analyzed using FSL (FMRIB’s Software Library 1 ). For preprocessing we used FSL 3.3, including BET to extract the brain from the skull and MCFLIRT for motion correction. Following motion correction, the data were submitted to independent components analysis using MELODIC ICA, and the results from this analysis were used to identify and remove potentially artifactual components in the data. After manually identifying artifactual components from one run for each of 11 randomly selected participants, we trained a classifier (Tohka et al., 2008 ) to automatically identify these components, and then used MELODIC to remove them from the data.
Statistical analysis was conducted in FSL 4.1 using FEAT 5.98. The statistical model included events for successful go responses, successful stop responses, and unsuccessful stop responses. Incorrect and missed Go trials were included in a nuisance regressor. All events began at stimulus onset and lasted the duration of the fixation plus the stimulus (1.5 s).
For the first-level analysis, images were spatially smoothed using a Gaussian kernel of FWHM 5 mm. Time-series statistical analysis was carried out using FILM (FMRIBs Improved Linear Model) with local autocorrelation correction after highpass temporal filtering (Gaussian-weighted least squares straight line fitting, with sigma = 33.0 s). Regressors of interest were created by convolving a delta function representing each event of interest with a canonical (double-gamma) hemodynamic response function (Woolrich et al., 2001 ). Parametric regressors were created by modulating the amplitude of a delta function using a demeaned version of the parameter of interest. In addition to regressors of interest, estimated motion parameters and their temporal derivatives (i.e., displacement) were included as nuisance regressors. Linear contrasts were performed for comparisons of interest.
A 3-step registration process was applied using FSL’s FLIRT module for linear registration. EPI functional images were first registered to an inplane T2-weighted structural image (matched bandwidth; 7 DOF). The inplane structural image was registered to the high-resolution structural image (MPRage; 7 DOF), and the high-resolution image was registered to standard MNI152 space using FLIRT linear registration with 12 degrees of freedom. These transformation matrices were combined to provide the transform from EPI to MNI space, and this transform was applied to the results from the first-level analysis.
Data were combined across runs using a fixed effects model, and then modeled using mixed effects at the group level with FSL’s FLAME model (Stage 1 only). The model included a regressor modeling mean activity and demeaned regressors for age, gender, SSRT, GoRT, and SDRT so we could examine neural effects of age, gender, and relevant behavioral performance during going and stopping. Contrasts included positive and negative relationships with each of the regressors. Outlier deweighting was performed using a mixture modeling approach (Woolrich, 2008 ). Results were thresholded at a whole-brain level using cluster-based Gaussian random field theory, with a cluster-forming threshold of z > 2.3 and a whole-brain corrected cluster significance level of p < 0.05. Cortical surface renderings were performed using CARET software 2 . Group statistical maps were mapped to the Population Average Landmark and Surface–based (PALS) atlas using the multi-fiducial mapping technique described by Van Essen (2005) . For the purposes of presentation, data are overlaid on the average atlas surface.
Predictive Analysis
Multivariate analyses were performed using the PyMVPA toolbox (Hanke et al., 2009 ). Prediction of individual differences from whole-brain fMRI data was performed using Gaussian process regression (Rasmussen and Williams, 2006 ) as implemented in PyMVPA, and support vector machines (Scholkopf and Smola, 2000 ) as implemented in libsvm (Chang and Lin, 2001 ). Individual differences for four different variables were included: age, SSRT, GoRT, and SDRT. These four variables are referred to as “labels.” Contrast values from each voxel included in the whole-brain analysis mask were included as features in the analysis; because these are centered around zero, no scaling was performed. Four-fold balanced cross-validation was performed for each label (Figure 2 A). On each run, participants were randomly assigned to one of the four folds, with the constraint that the mean label value did not differ across folds according to a one-way ANOVA (p > 0.98). This approach was used because it prevents overfitting that can occur when leave-one-out cross-validation is used with small sample sizes, resulting in systematically incorrect predictions (Kohavi, 1995 ). Several different approaches for high-dimensional regression were employed:
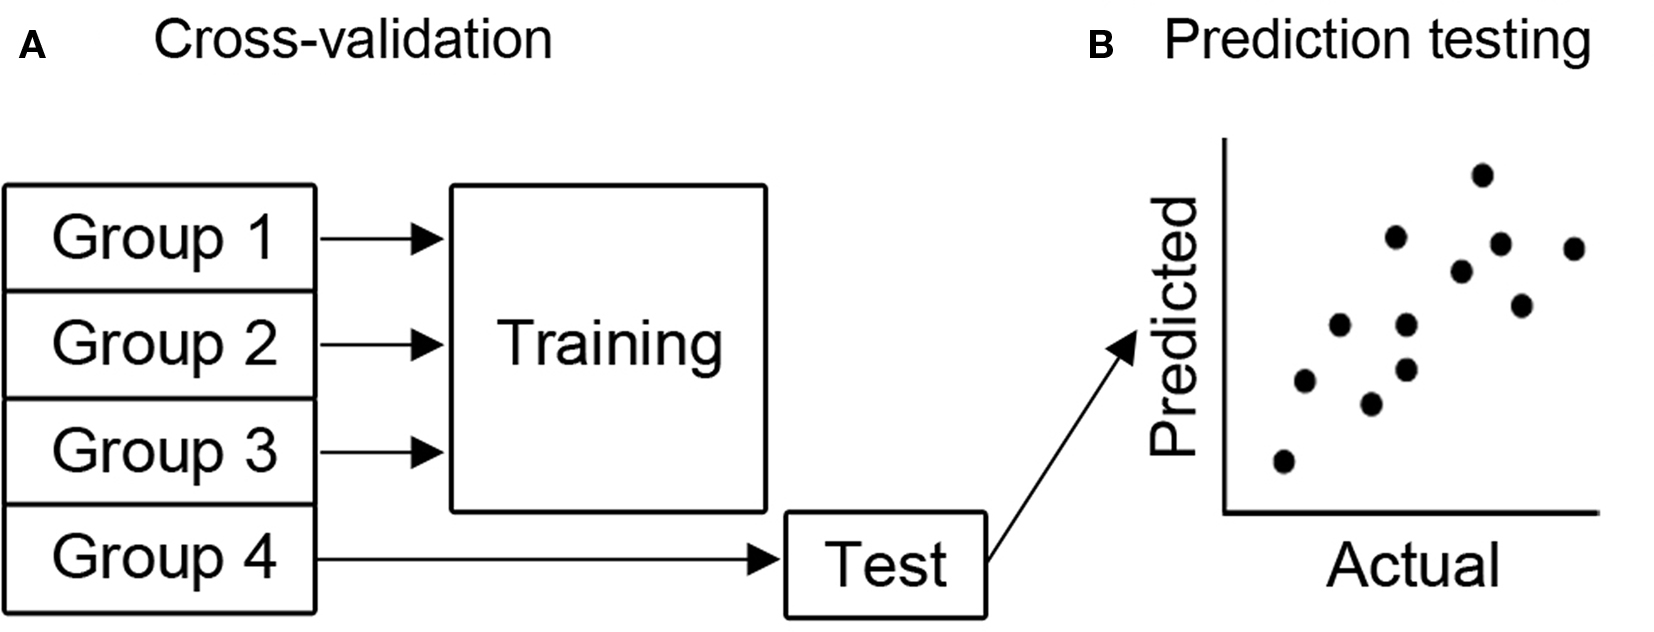
Figure 2. Depiction of the predictive methods used. (A) All subjects were randomly assigned to 1 of 4 groups in such a way as to balance the distribution of the target variable across groups. Cross-validation was used, meaning that 3 groups were used to train the classifier (in this case 1, 2 and 3, although all iterations were used) and the classifier predicted the label value for the 4th group. (B) To quantify the accuracy of the classifier, the correlation between the actual label value and the label value predicted by the classifier was computed. Higher correlations imply that the actual and predicted values were similar, and thus the classifier was successfully predictive.
• Gaussian process regression using a linear kernel and noise SD = 40.
• Gaussian process regression using a squared exponential (i.e., radial basis function) kernel with noise SD = 40, length scale = 12,000 and sigma f = 10,000.
• Support vector regression (epsilon-regression) with a linear kernel and cost function = 0.001.
In each case, parameters were determined using a set of increasingly fine grid searches over a broad parameter space. Predicted values were obtained for the left-out observations on each run and compared to the true label values using Pearson correlation (Figure 2 B). This was performed 100 times for each analysis in order to obtain an estimate of prediction accuracy that was robust to the random group assignments. Statistical significance of prediction accuracy was determined by running each analysis 1000 times using randomly permuted labels; the correlation coefficients for predicted versus “true” labels in this analysis were used as an empirical null distribution against which the observed value was tested. Correlations were considered significant if the probability of such a correlation occurring was < 0.05.
Sensitivity maps were generated for the linear Gaussian process regression by averaging the linear regression weights for each voxel obtained for each training fold (it is not possible to create such maps for the non-linear case).
Results
Behavioral Results
Behavioral results are summarized in Table 1 . There was no relationship between age and Go task performance (r = 0.04, robust p = 0.92). Older participants were, however, better at the Stop task than younger participants, as noted by decreasing SSRTs with increasing age (r = −0.40, robust p = 0.03). Additionally, there was no relationship between Stop task performance and Go task performance (r = −0.008, robust p = 0.78 for median GoRT and r = −0.07, robust p = 0.66 for SDRT).
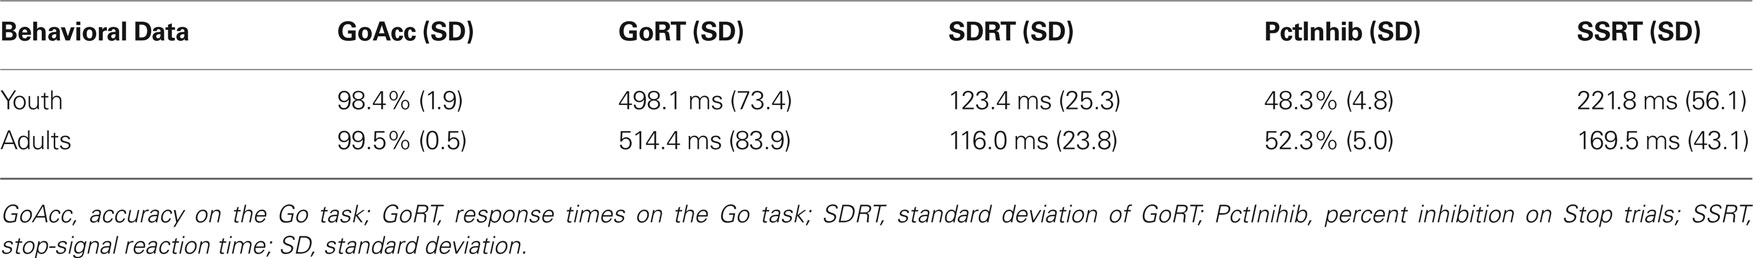
Table 1. Accuracy and response times of youth (ages 9–19) and adults (ages 25–30) on the stop-signal task.
Standard GLM Analysis
We explored neural activity during successful Go task performance (successful go – baseline) and successful Stop task performance (successful stop – successful go and successful stop – unsuccessful stop). We included two contrasts exploring different aspects of successful stopping because both are commonly used in the literature. We also looked at correlations between neural activity during each of the contrasts and the four labels tested during the predictive analysis (age, SSRT, GoRT, and SDRT). All fMRI results were corrected for multiple comparisons using cluster-based Gaussian random field theory (cluster-forming threshold of z > 2.3, whole-brain FWE-corrected p < 0.05).
In order to determine which brain regions were associated with completing a planned response to a visual stimulus, we contrasted successful going with baseline. We found that the left motor cortex (corresponding to a right-handed button press), the left postcentral gyrus and the right occipital cortex were the only regions significantly active (Figure 3 A; Table 2 A). Similar to the behavioral data, there were no significant correlations with age or stopping ability (SSRT) and brain activity during the going process. There were, however, significant negative correlations between GoRT and SDRT and brain activity during the Go task. Regions correlated with GoRT included the right posterior middle frontal gyrus into the precentral gyrus, left angular gyrus, left superior lateral occipital cortex and left precuneus. All these regions displayed less activity with longer response times (Figure 4 A; Table 3 A). In a region in the left postcentral gyrus and supramarginal gyrus there was a significant negative correlation between SDRT and brain activity during the Go task, such that when participants’ response speeds were more variable, there was less brain activity (Figure 4 B; Table 3 B).
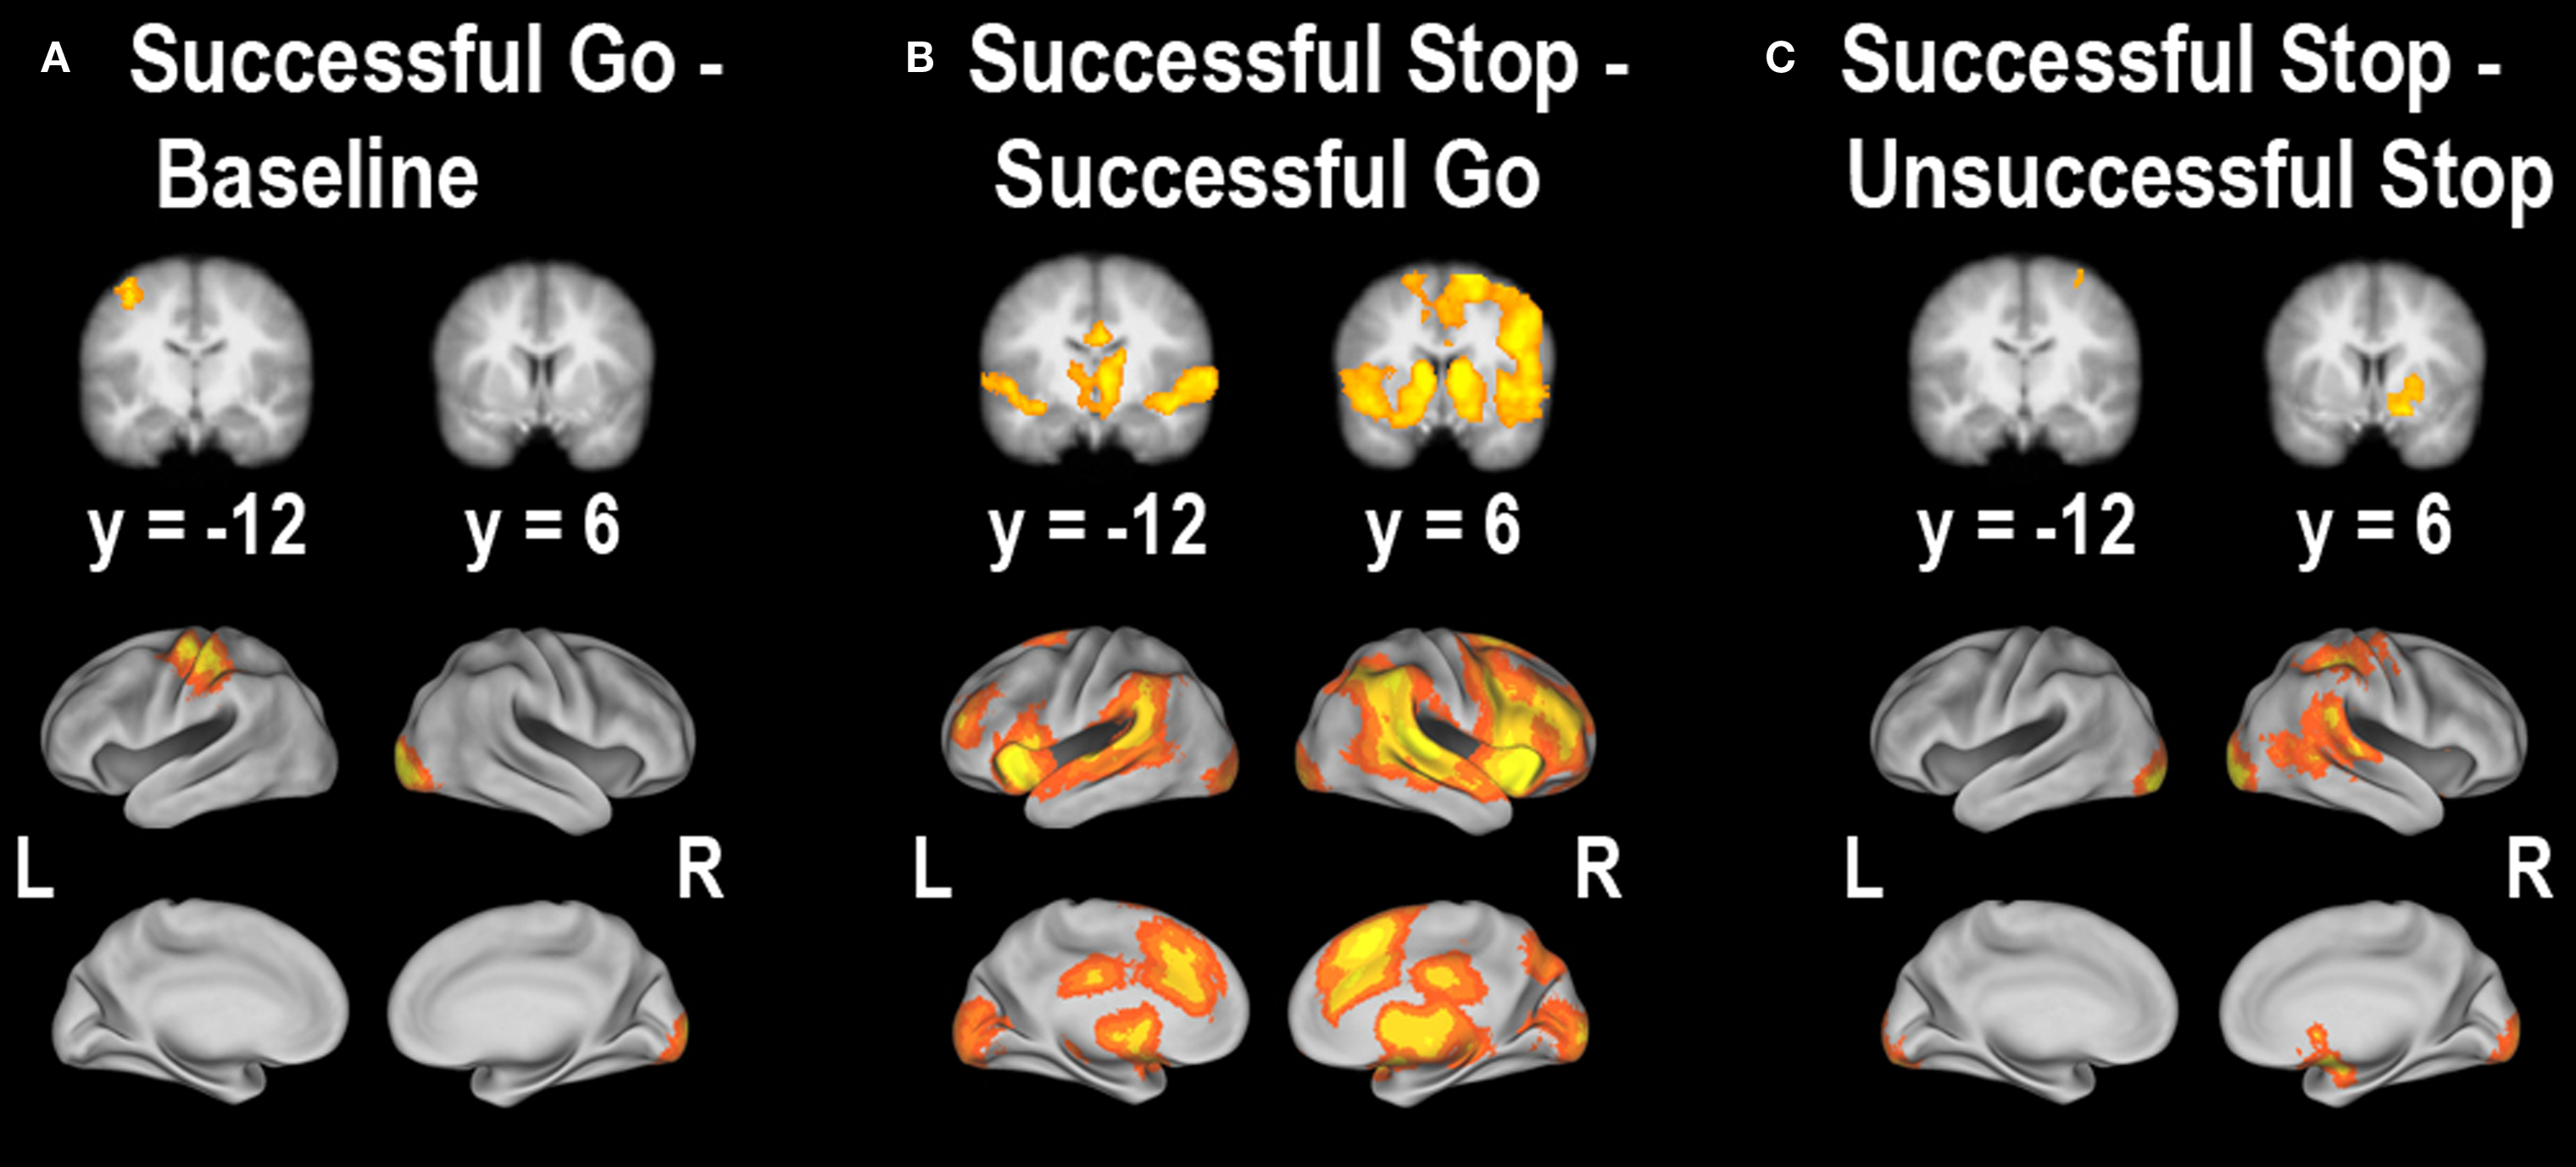
Figure 3. Whole-brain main effects of (A) successful going – baseline, (B) successful stopping – successful going, and (C) successful stopping – unsuccessful stopping. All clusters survived whole-brain correction at z > 2.3, p < 0.05. For a list of clusters of activity, see Table 2 .
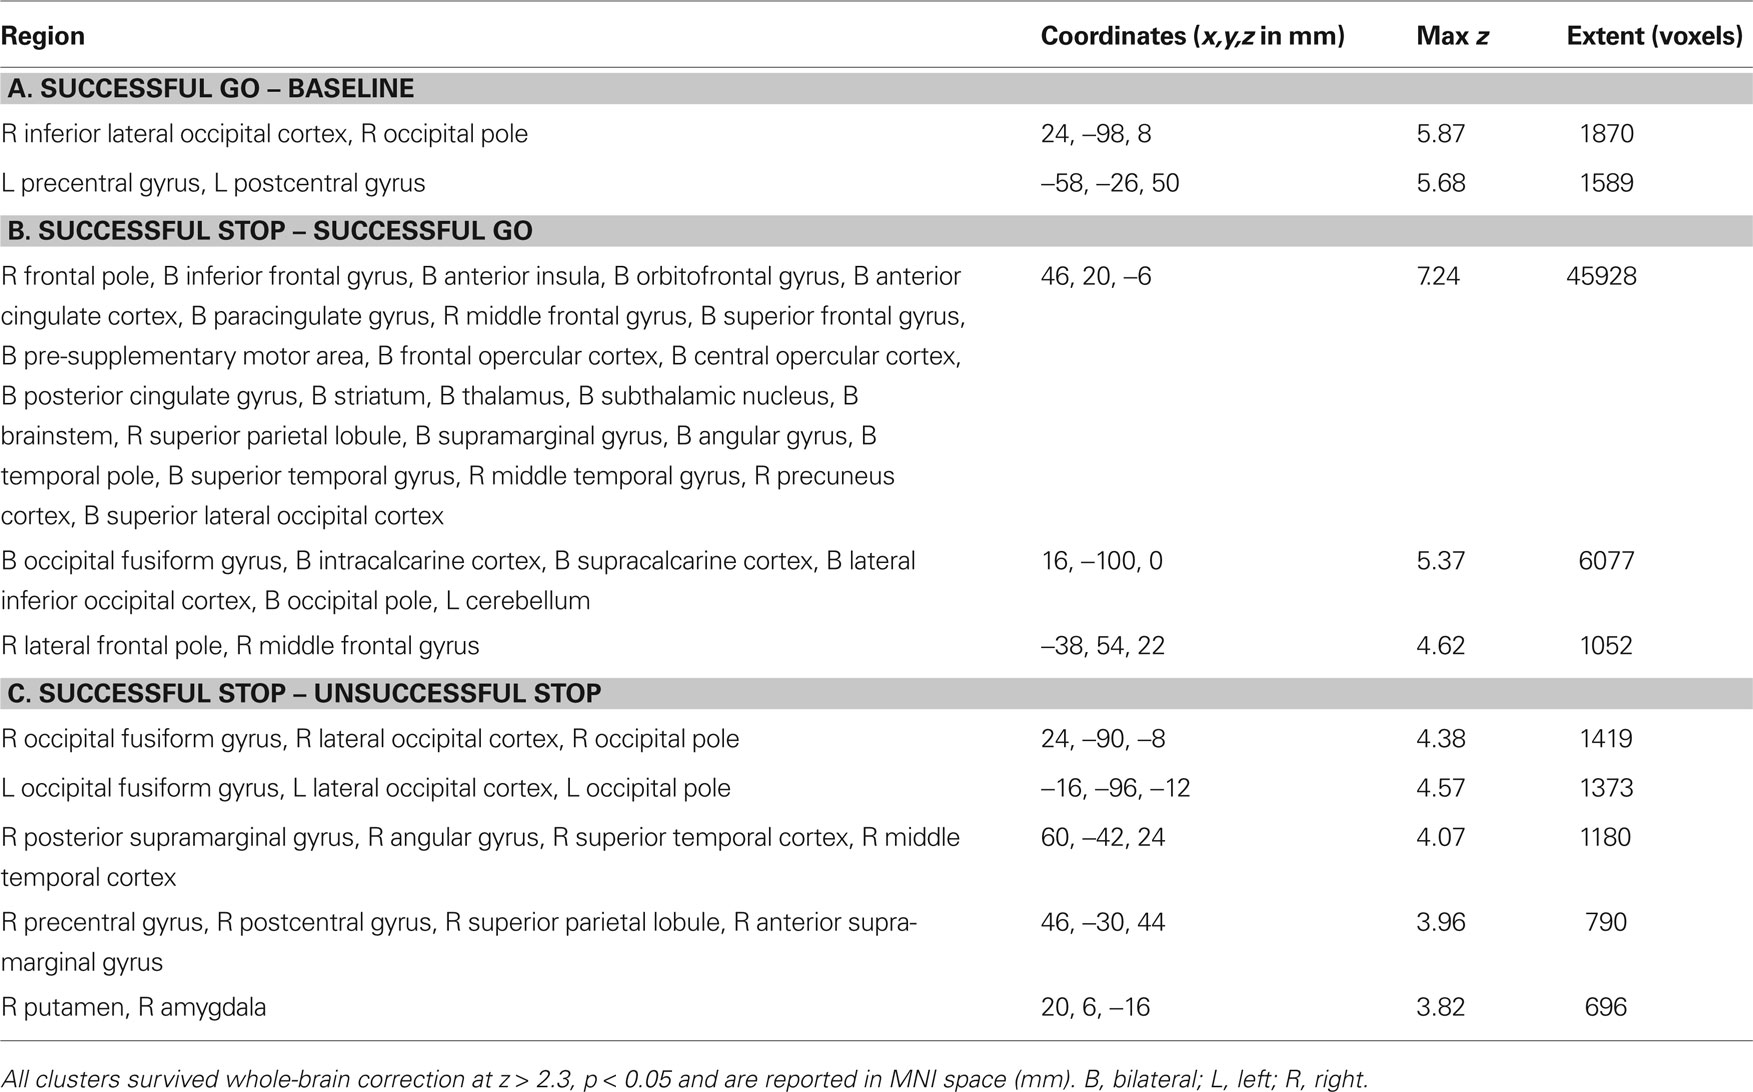
Table 2. Clusters associated with (A) successful going – baseline, (B) successful stopping – successful going, and (C) successful stopping – unsuccessful stopping.
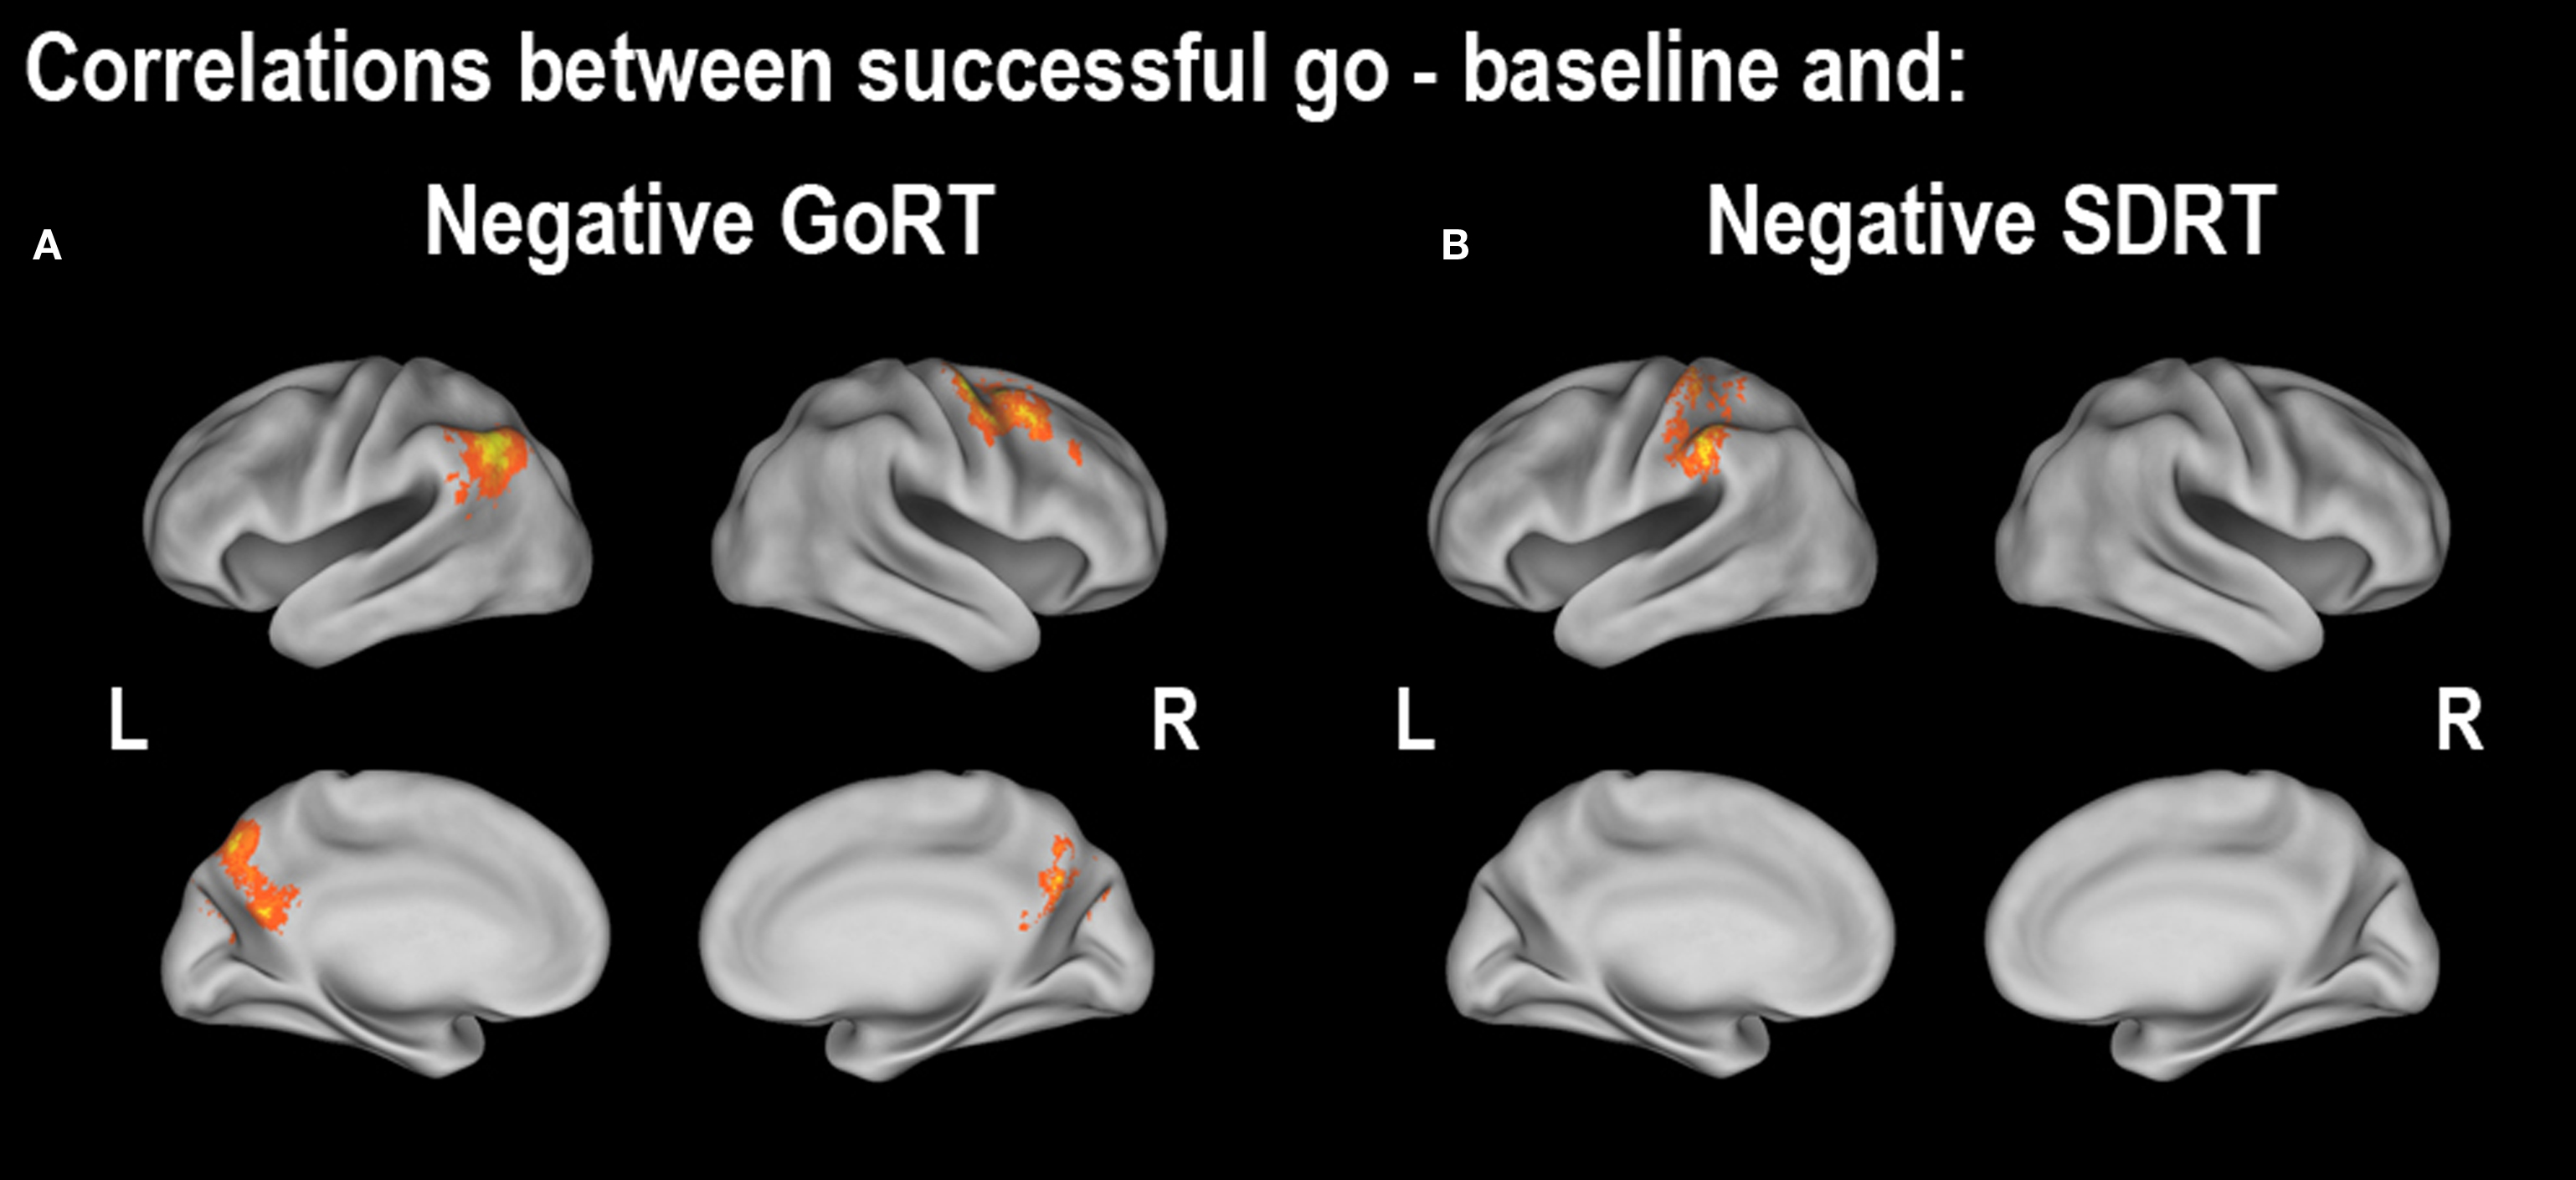
Figure 4. Regions showing correlations between successful going vs. baseline and (A) median Go response time (GoRT) and (B) the standard deviation of Go response time (SDRT). All correlations were corrected at the whole-brain level at z > 2.3, p < 0.05. For cluster details, see Table 3 .
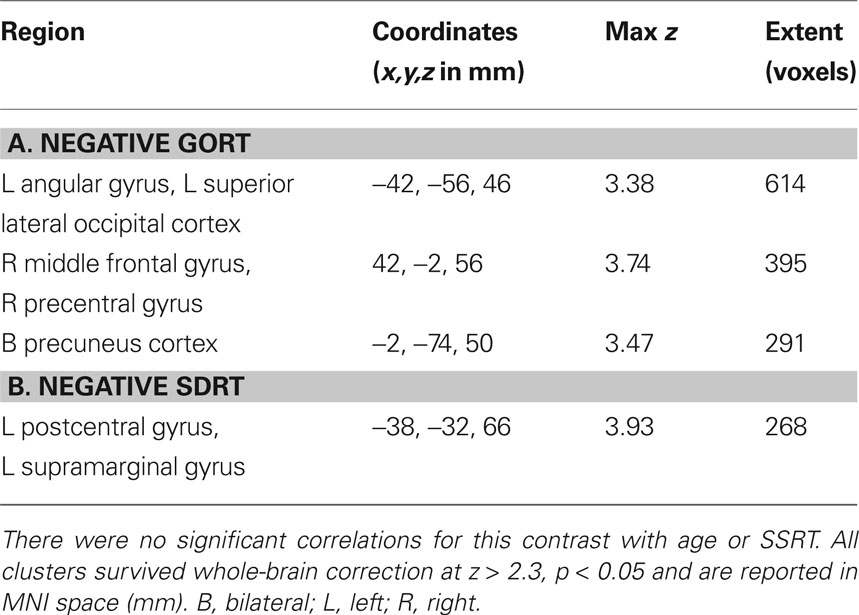
Table 3. Clusters of activity associated with correlations between successful going vs. baseline and (A) median Go response time (GoRT) and (B) the standard deviation of Go response time (SDRT).
Next, we explored regions associated with successful response inhibition by comparing activity during successful stopping to activity during successful going. We saw significant activity in a bilateral but predominantly right-lateralized network including the frontal pole, IFG, anterior insula, orbitofrontal gyrus, anterior cingulate gyrus, paracingulate gyrus, middle frontal gyrus, superior frontal gyrus, preSMA, posterior cingulate gyrus, central opercular cortex, striatum, thalamus, STN, brainstem, superior temporal gyrus, middle temporal gyrus, occipital fusiform cortex, precuneus cortex, intracalcarine cortex, supracalcarine cortex, lateral inferior occipital cortex, occipital pole, and cerebellum (Figure 3 B; Table 2 B). Many of these regions are typically active during successful stopping performance in adults (Aron and Poldrack, 2006 ). When examining correlations between age and neural activity during successful response inhibition we found one region, in the left medial prefrontal cortex, including part of the rostral anterior cingulate gyrus, that was significantly related to age. Activity in this region was decreased in older participants as compared to younger participants (Figure 5 A; Table 4 A). We then examined whether neural activity was related to behavior. To this end, we looked at brain regions correlated with SSRT, GoRT, and SDRT. During response inhibition, we found significant negative correlations between SSRT and successful response inhibition in regions relevant to the stopping process, such as the right medial prefrontal cortex, bilateral rostral anterior cingulate gyrus and paracingulate gyrus, right superior frontal gyrus, bilateral striatum, right subcallosal cortex, bilateral thalamus, right STN, right superior parietal lobule, right supramarginal gyrus, right parietal and central opercular cortex, right temporal pole, right superior temporal gyrus, right middle temporal gyrus, and right cerebellum. People with better inhibitory performance had more brain activity in these regions (Figure 5 B; Table 4 B). We also found a significant positive correlation between GoRT and left-lateralized activity in the insula, superior temporal gyrus and transverse temporal gyrus (including the auditory cortex), and middle temporal gyrus, suggesting that when the auditory cortex was more engaged, GoRTs on the Go task were slower (Figure 5 C; Table 4 C). Lastly, we found regions that were significantly negatively correlated with SDRT, including mostly left-lateralized frontal pole, middle frontal gyrus, superior frontal gyrus, preSMA, SMA, anterior cingulate cortex and paracingulate cortex, pre- and postcentral gyri, insula and frontal opercular cortex, striatum, pallidum, thalamus, supramarginal gyrus, superior parietal lobule, temporal pole, right inferior temporal gyrus, and bilateral occipital cortex (Figure 5 D; Table 4 D). It has been proposed that variability in stopping ability may be due to Go response time variability (Bellgrove et al., 2004 ), but the present results suggest that variability and inhibitory function are largely related to activity in different regions.
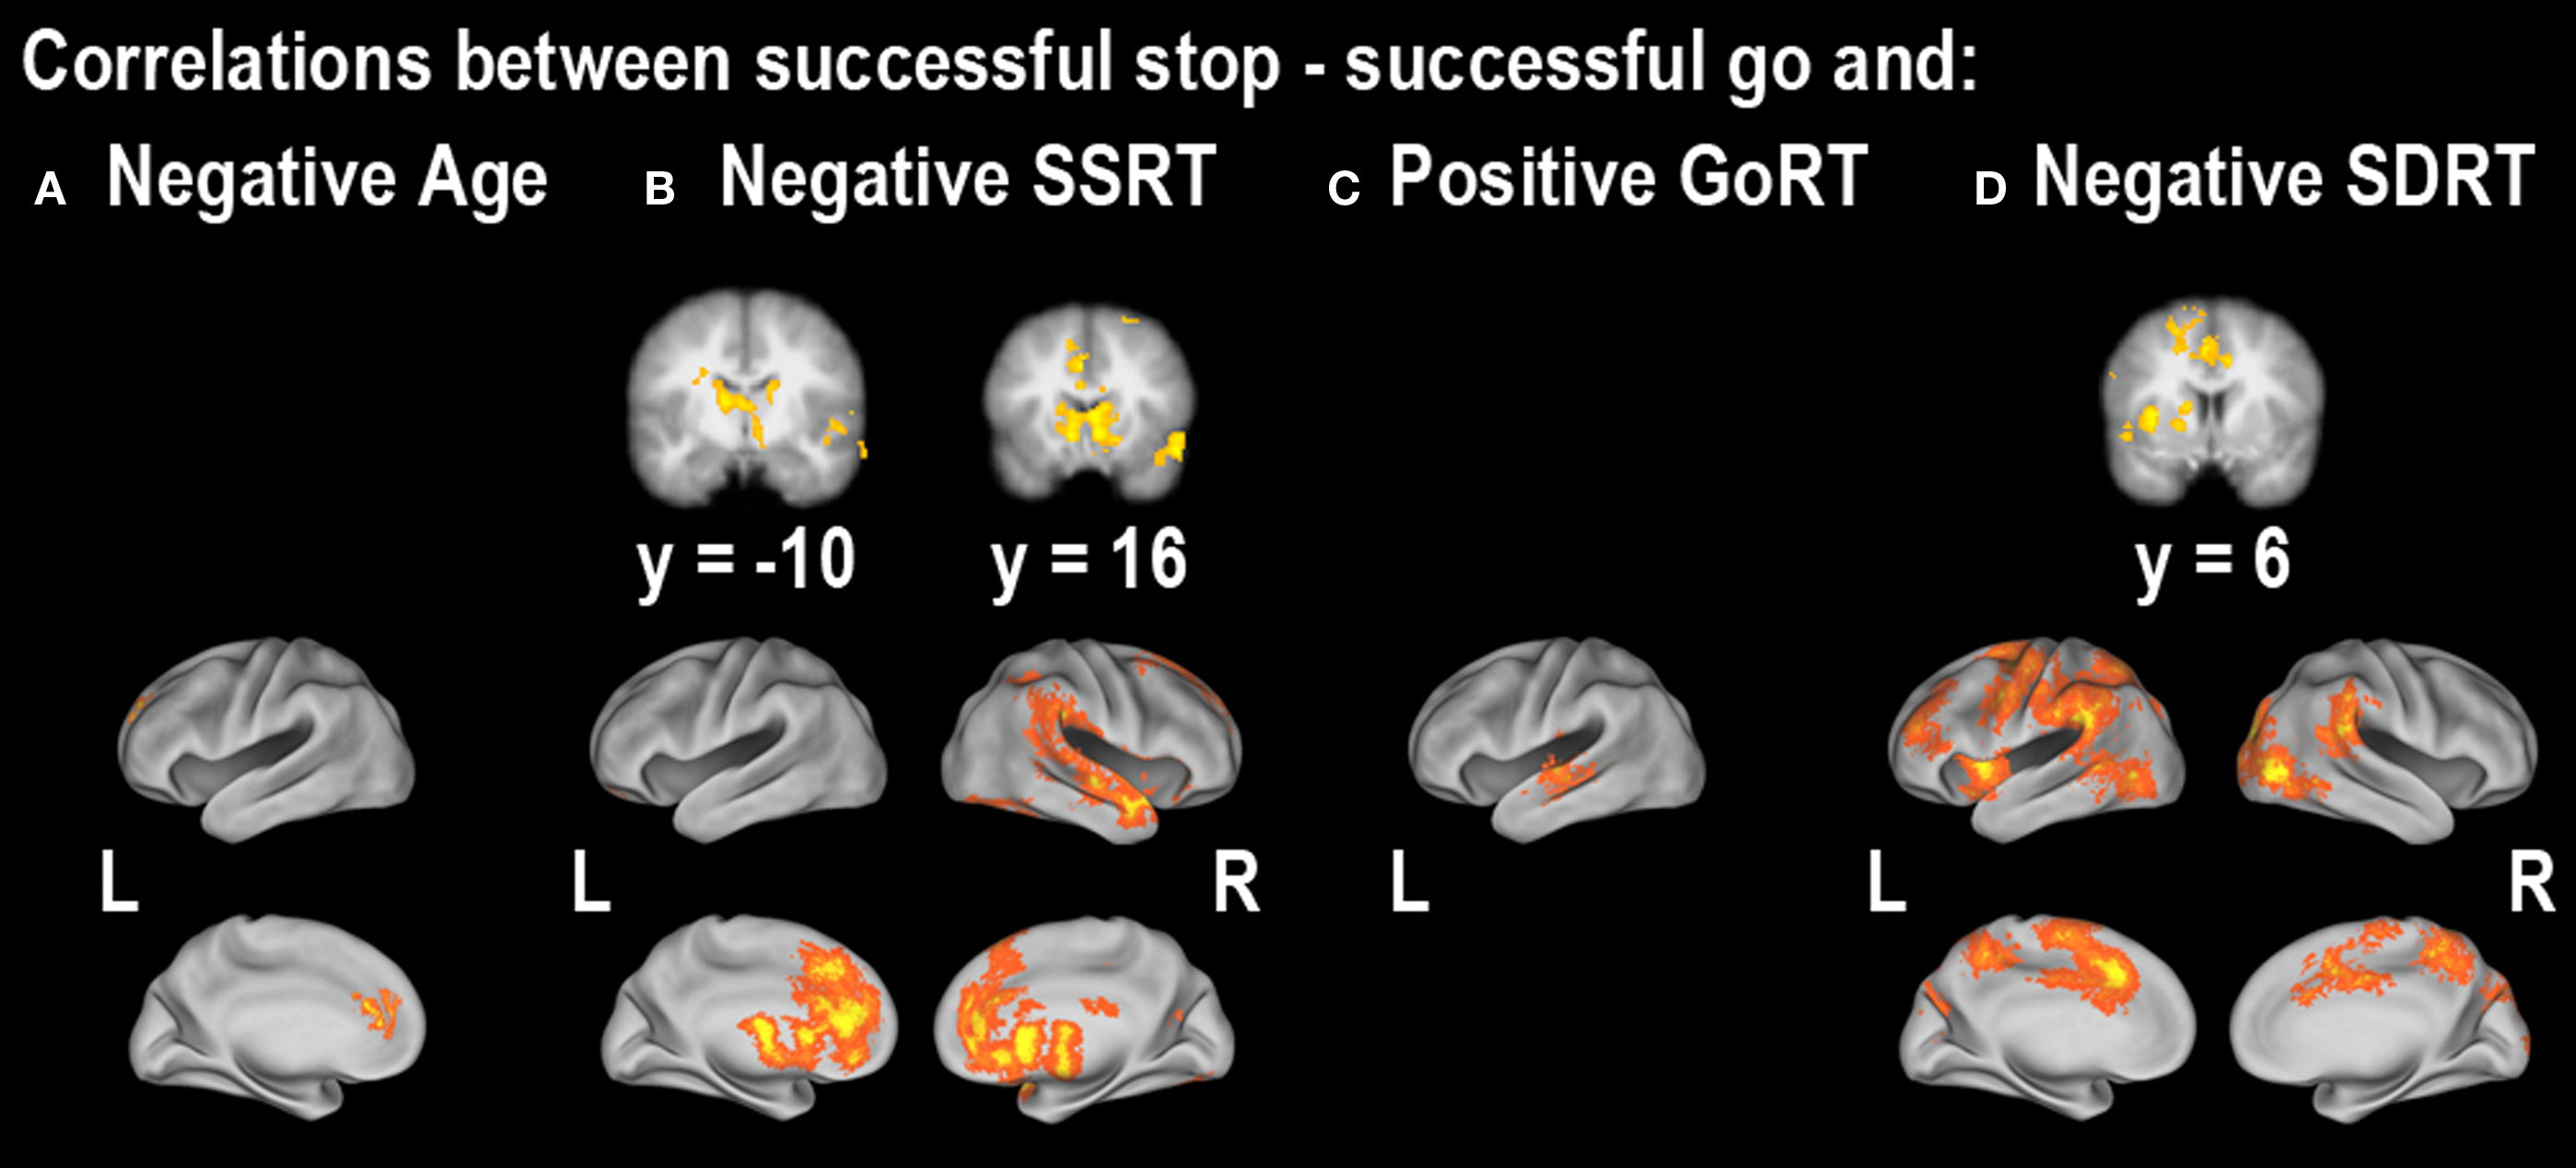
Figure 5. Regions showing correlations between successful stopping vs. successful going and (A) age, (B) SSRT, (C) median Go response time (GoRT) and (D) the standard deviation of Go response time (SDRT). All correlations were corrected at the whole-brain level at z > 2.3, p < 0.05. For cluster details, see Table 4 .
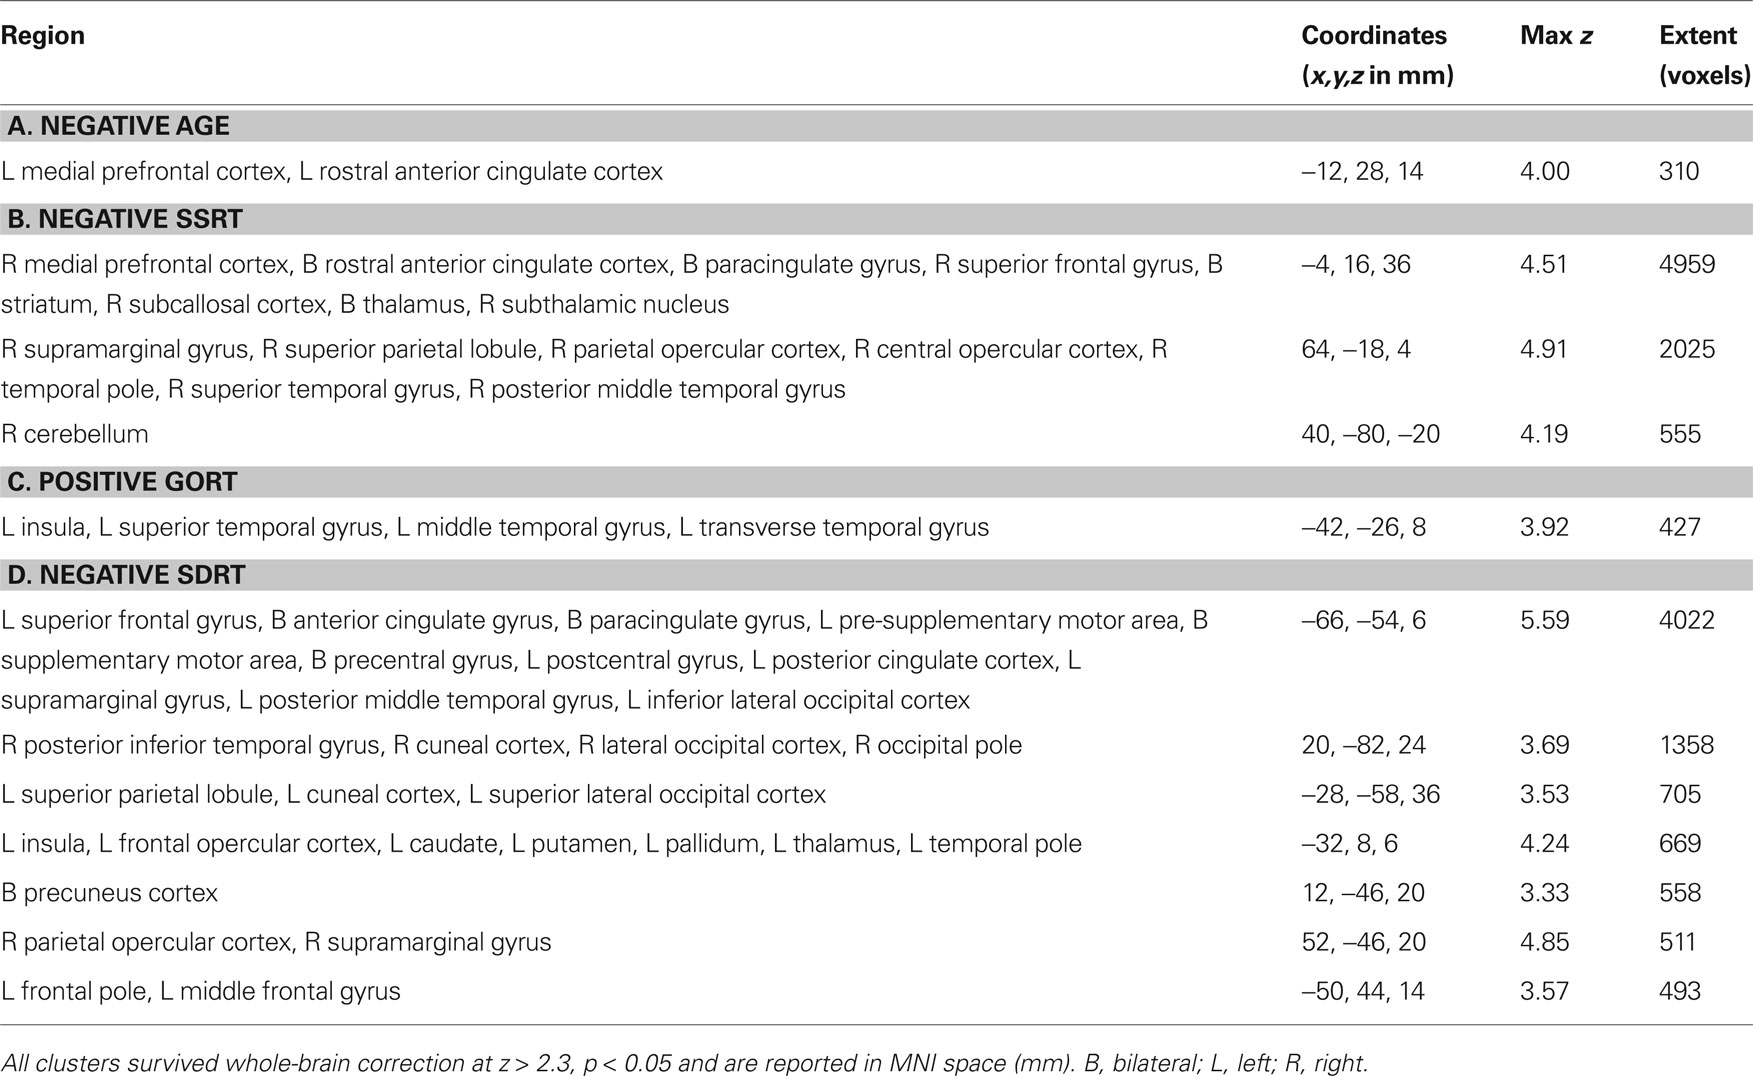
Table 4. Clusters of activity associated with correlations between successful stopping vs. successful going and (A) age, (B) SSRT, (C) median Go response time (GoRT) and (D) the standard deviation of Go response time (SDRT).
Another manner by which to explore successful stopping is to compare successful stopping with unsuccessful stopping (Rubia et al., 2003 , 2007 ; Li et al., 2006 ). We examined this contrast as well and found that a right-lateralized network including the ventral striatum, amygdala, supramarginal gyrus, superior temporal gyrus, and bilateral occipital cortex was significantly active (Figure 3 C; Table 2 C). The limited significant neural activity with this contrast supports our previous findings in which the differences between successful and unsuccessful stopping conditions are weak compared to the differences between Stop and Go conditions (Aron and Poldrack, 2006 ). There were no significant correlations with either age or behavior when comparing successful to unsuccessful stopping.
Predictive Analysis
Each of the contrasts outlined above (successful go – baseline, successful stop – successful go, and successful stop – unsuccessful stop) was entered into the predictive analysis to determine how well each label value could be predicted from fMRI data. We found that none of the label values (age, SSRT, GoRT, and SDRT) could be significantly predicted from successful go – baseline or successful stop – unsuccessful stop (Figures 6 A,C). Instead, predictive accuracy was specific to successful response inhibition (as defined by the contrast successful stop – successful go) and the labels that have been shown in previous literature to be related to response inhibition, namely age and SSRT (Figure 6 B). Significant above-chance prediction of age from fMRI data was obtained using Gaussian process regression with linear [mean r(predicted, actual) = 0.51, p = 0.003] and squared exponential (mean r = 0.38, p = 0.016) kernels, as well as with a linear support vector machine (mean r = 0.47, p = 0.010). Significant above-chance prediction of SSRT from fMRI data was obtained using Gaussian process regression with linear (mean r(predicted, actual) = 0.39, p = 0.028) and squared exponential (mean r = 0.49, p = 0.002) kernels, as well as with a linear support vector machine (mean r = 0.43, p = 0.017). The mean prediction accuracy for the permutation runs for both age and SSRT was very close to zero (ranging between −0.011 and −0.036 across all classifiers and labels), suggesting that there was no systematic bias due to the prediction method.
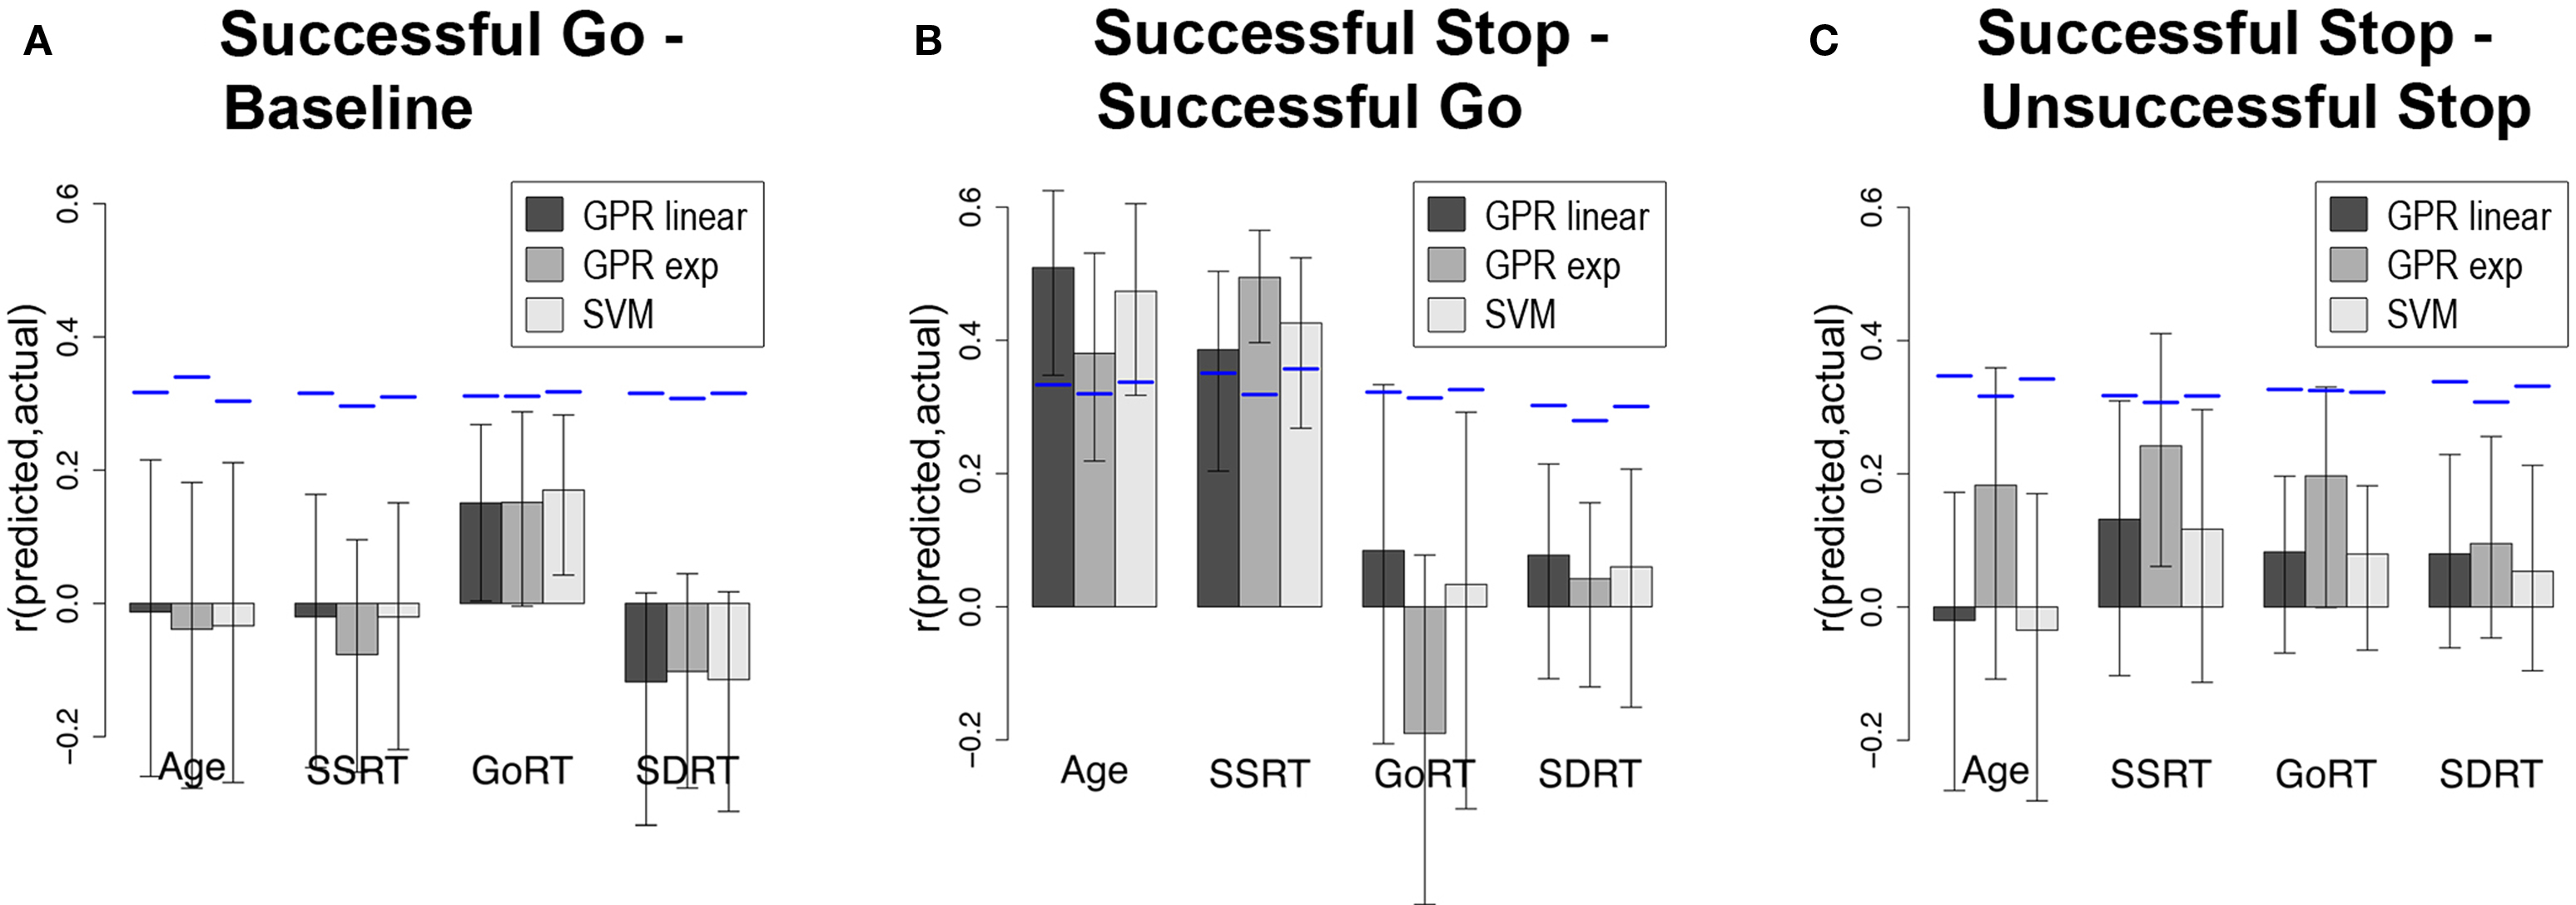
Figure 6. Correlations between actual label values for age, SSRT, GoRT, and SDRT and predicted label values for (A) successful go – baseline, (B) successful stop – successful go and (C) successful stop – unsuccessful stop. Correlations shown for all three methods of prediction: Gaussian process regression with a linear kernel (GPR linear), Gaussian process regression with a squared exponential kernel (GPR exp), and linear support vector machine (SVM) regression. Blue lines depict the 95th percentile of an empirical null distribution, whereas the error bars depict the 95% confidence interval of correlation values across cross-validation samples. Thus, the blue depicts the threshold for statistical significance against the null hypothesis of zero predictability, whereas the error bars depict the stability of the prediction estimates across samples. Note that only predicted age and SSRT label values during successful stop – successful go are significantly related to actual age and SSRT.
Sensitivity maps displaying which neural regions are most predictive of both age and SSRT were obtained for the linear Gaussian process regression (it is not possible to create such maps for the non-linear case; Figures 7 A,B).
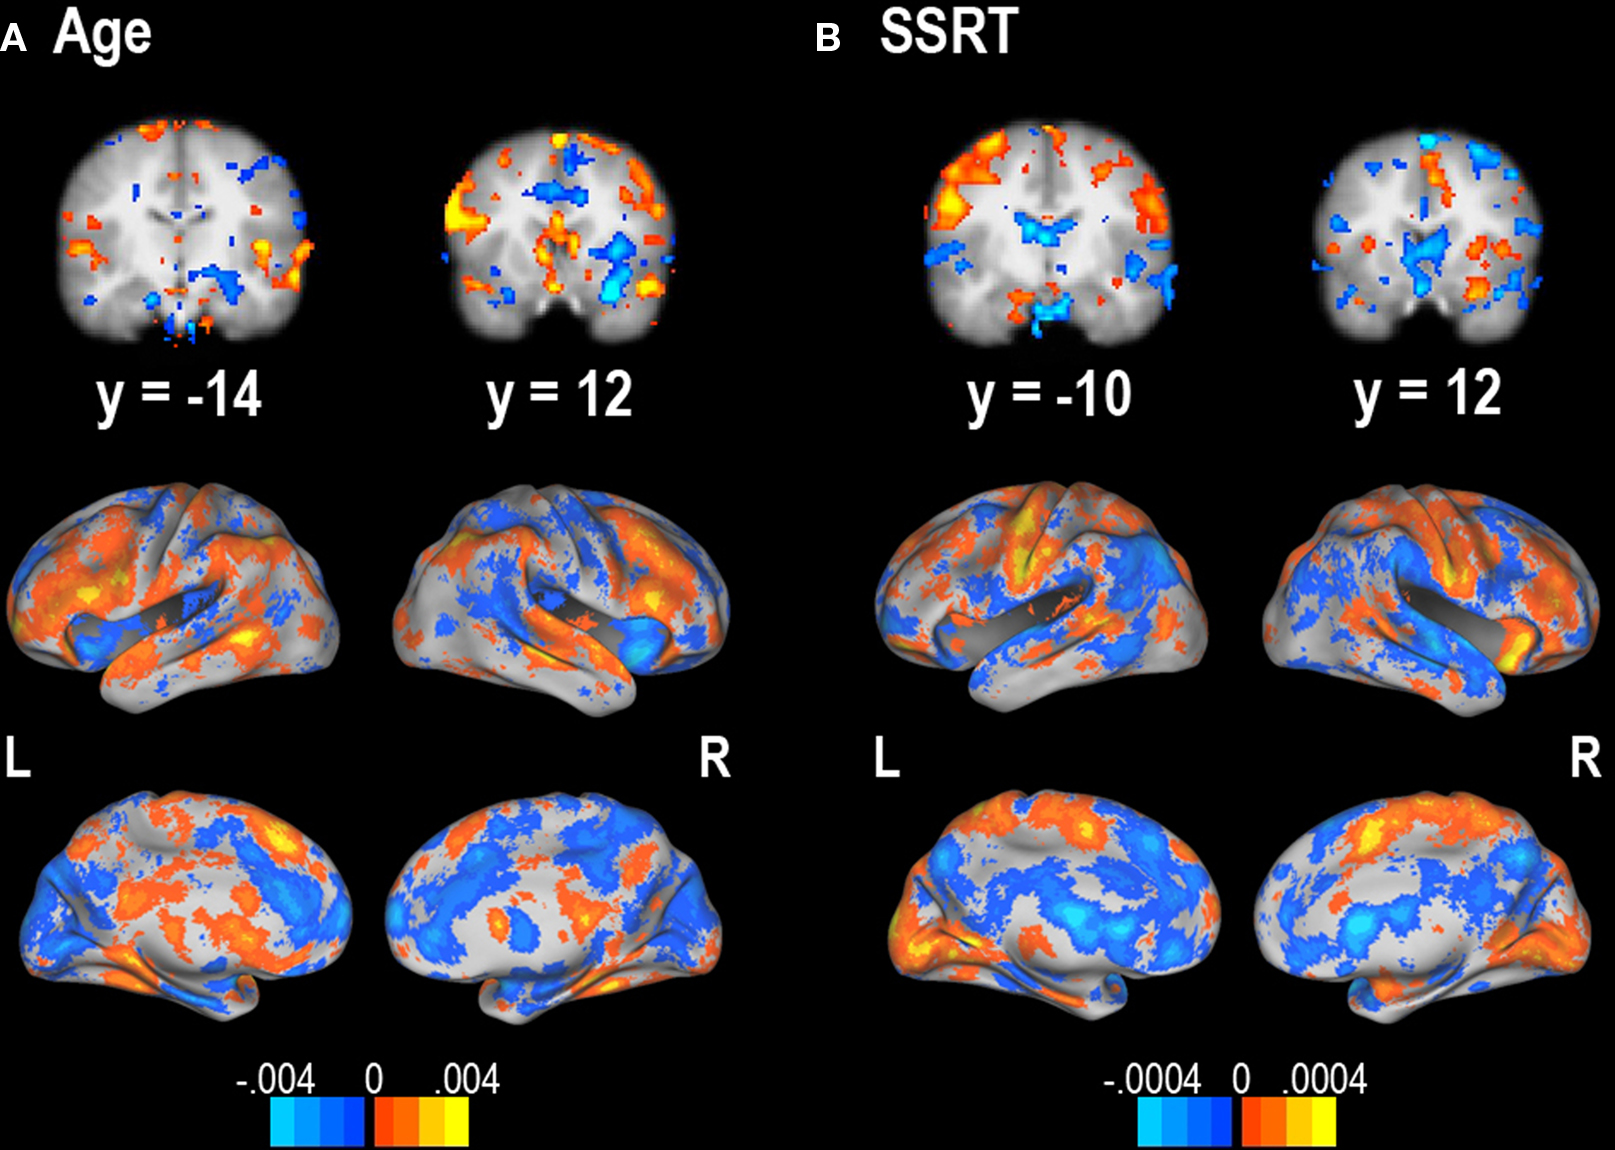
Figure 7. Sensitivity maps for predictability of (A) age and (B) SSRT from successful stop – successful go contrast. Units are regression weights from the linear Gaussian process regression classifier. Orange areas are those that positively predict the label value; blue areas are those that negatively predict the label value. The color bars indicate the scale for each contrast. It is important to note that these regions may reflect the sensitivity of a particular classifier and could potentially change with different classifiers.
Discussion
According to the race model of stop-signal response inhibition (Logan and Cowan, 1984 ), SSRT is a measure of the time needed to engage an inhibitory process. Individual differences in this quantity have long been linked to development (Williams et al., 1999 ) and impulsivity (Logan et al., 1997 ); they have also shown significant impairments in impulse control disorders such as ADHD (Logan et al., 2000 ; Lijffijt et al., 2005 ), substance use (Fillmore and Rush, 2002 ; Monterosso et al., 2005 ), and OCD (Chamberlain et al., 2006 ). However, some of these groups also appear to show increased variability in their performance on the primary (go) task as well (Williams et al., 1999 ; Lijffijt et al., 2005 ), which could inflate the estimated SSRT value. We strove to demonstrate that SSRT, not SDRT, is critically related to successful response inhibition. We found that both SSRT and SDRT were correlated with neural activity during successful inhibition, but only SSRT was predictable from that neural activity. This supports the claim that SSRT is the only behavioral variable critically related to the neural mechanisms of response inhibition. Moreover, we sought to extend previous findings that age and SSRT are related to the neural correlates of successful response inhibition by demonstrating that neural activity is predictive of these variables. Our results supported this claim as well, given that age and SSRT were the only two variables that could be predicted by neural activity, and that they were specifically predicted by neural activity during successful response inhibition, but not successful response execution.
Using a standard GLM analysis, we found much of the variability in neural activity in regions typically involved in successful response inhibition performance, such as the anterior cingulate gyrus, superior frontal gyrus, striatum and STN, was uniquely correlated with SSRT, while a widespread network of regions not specific to response inhibition were correlated with SDRT, including much of the left prefrontal cortex and primary sensory and motor areas. One region, a portion of the rostral anterior cingulate gyrus, showed activity related to age. Additionally, only one region, which included the superior, middle, and transverse temporal gyri, showed activity related to GoRT. During successful Go task performance, only response time behavior was related to neural activity (both GoRT and SDRT).
While the GLM analysis was useful in determining where neural activity was related to age or performance, we could not use those results as an indication of how neural activity may predict those variables. Thus, we implemented three methods of predictive analysis (Gaussian process regression with a linear kernel, Gaussian process regression with a squared exponential kernel, and support vector regression) to determine which aspects of the stop-signal task caused neural activity that was predictive of age or behavioral performance across individuals.
We found that neural activity during successful response inhibition as defined by contrasting successful stopping vs. successful going was predictive of age and SSRT, but not GoRT or SDRT. This was the case even though there were significant correlations between SDRT and activation during successful inhibition in our standard GLM analysis. This discrepancy between significant correlations and unsuccessful prediction may reflect the fact that the correlations were driven by a small number of observations. It also highlights the need to be careful regarding the conflation of correlation and prediction, as is common in the neuroimaging literature.
Additionally, we found that neural activity during successful Go task performance was not predictive of age or any behavioral variables. Taken together, these results imply that individual differences in SSRT are specifically related to response inhibition processes as opposed to response execution processes. Further evidence for a linkage between developmental changes in SSRT and changes in inhibitory processing was seen in that similar neural regions were predictive of both age and SSRT, including regions known to be utilized during successful motor inhibition, such as the right IFG, the striatum and the right STN. Lastly, individual differences in SSRT were related to inhibitory processes and not variability of Go task performance.
It is important to note that any conclusions from the present results must be qualified by the fact that only a small portion of the possible space of statistical learning methods was chosen. In particular, though we examined a range of statistical machines (linear and non-linear support vector machines and linear Gaussian processes), it could be the case that other methods would be more sensitive to specific effects. In addition, we did not employ any feature selection but rather included whole-brain data in the analyses. Finally, additional parameter optimization could have potentially improved predictive performance. However, the presence of significant results across multiple methods suggests that the significant prediction observed here is at least somewhat robust to methodological choices.
The current findings support and extend much previous developmental and response inhibition research. It has been demonstrated that cortical and subcortical neural regions involved in response inhibition are not fully developed structurally (Giedd et al., 1999 ; Sowell et al., 1999 ) or functionally (Casey et al., 2000 ) until adulthood. More specific to response inhibition, previous studies have demonstrated that adults have greater activity in the right IFG, a brain region known to be critical for successful response inhibition (Bunge et al., 2002 ; Durston et al., 2002 ; Rubia et al., 2007 ), and that response inhibition ability increases with increasing age (Casey et al., 1997 ; Williams et al., 1999 ; Durston et al., 2002 ). Even in fully developed, healthy adults, right IFG activity has been shown to be related to response inhibition ability (Aron and Poldrack, 2006 ). Therefore, the current study extends these correlational findings by demonstrating that neural activity during successful response inhibition in the right IFG, the striatum and the right STN is predictive of age and SSRT. It is important, however, to qualify that even though we extended the results of previous research from correlational to predictive, without a direct manipulation of neural functioning (i.e., a lesion or TMS), we cannot make strong claims about the causal relationship between regional brain function and behavior.
A debate in developmental neuroscience centers around how researchers can tease apart age-related neural differences from performance-related differences, especially when performance improves with age, as occurs in the stop-signal task (Durston and Casey, 2006 ). The results from our predictive analysis indicate that patterns of neural activity during successful response inhibition predicted both age and SSRT equally well in our participants. This implies that in a task where age and performance are inextricably linked, a combination of age effects and performance effects underlies neural activity. Future research could further enhance our knowledge of the relationship between age and SSRT by more specifically exploring whether age influences SSRT directly or if the two variables are related via a separate, mediating factor. A combination of predictive analyses and formal modeling of the causal relationships between these and other variables may help to elucidate this relationship.
Conflict of Interest Statement
The authors declare that the research was conducted in the absence of any commercial or financial relationships that could be construed as a potential conflict of interest.
Acknowledgments
This research was supported by the US Office of Naval Research (N00014-07-1-0116), National Institute of Mental Health (5R24 MH072697), the National Institute of Mental Health Intramural Research program, and the National Institute of Drug Abuse (5F31 DA024534-02).
Footnotes
References
Aron, A. R., Behrens, T. E., Smith, S., Frank, M. J., and Poldrack, R. A. (2007). Triangulating a cognitive control network using diffusion-weighted magnetic resonance imaging (MRI) and functional MRI. J. Neurosci. 27, 3743–3752.
Aron, A. R., Fletcher, P. C., Bullmore, E. T., Sahakian, B. J., and Robbins, T. W. (2003). Stop-signal inhibition disrupted by damage to right inferior frontal gyrus in humans. Nat. Neurosci. 6, 115–116.
Aron, A. R., and Poldrack, R. A. (2006). Cortical and subcortical contributions to stop signal response inhibition: role of the subthalamic nucleus. J. Neurosci. 26, 2424–2433.
Band, G. P., van der Molen, M. W., and Logan, G. D. (2003). Horse-race model simulations of the stop-signal procedure. Acta Psychol. 112, 105–142.
Bellgrove, M. A., Hester, R., and Garavan, H. (2004). The functional neuroanatomical correlates of response variability: evidence from a response inhibition task. Neuropsychologia 42, 1910–1916.
Bunge, S. A., Dudukovic, N. M., Thomason, M. E., Vaidya, C. J., and Gabrieli, J. D. E. (2002). Immature frontal lobe contributions to cognitive control in children: evidence from fMRI. Neuron 33, 301–311.
Casey, B. J., Giedd, J. N., and Thomas, K. M. (2000). Structural and functional brain development and its relation to cognitive development. Biol. Psychiatry 54, 241–257.
Casey, B. J., Trainor, R. J., Orendi, J. L., Schubert, A. B., Nystrom, L. E., Giedd, J. N., Castellanos, F. X., Haxby, J. V., Noll, D. C., Cohen, J. D., Forman, S. D., Dahl, R. E., and Rapoport, J. L. (1997). A developmental functional MRI study of prefrontal activation during performance of a go-no-go task. J. Cogn. Neurosci. 9, 835–847.
Chamberlain, S. R., Fineberg, N. A., Blackwell, A. D., Robbins, T. W., and Sahakian, B. J. (2006). Motor inhibition and cognitive flexibility in obsessive-compulsive disorder and trichotillomania. Am. J. Psychiatry 163, 1282–1284.
Chambers, C. D., Bellgrove, M. A., Gould, I. C., English, T., Garavan, H., McNaught, E., Kamke, M., and Mattingley, J. B. (2007). Dissociable mechanisms of cognitive control in prefrontal and premotor cortex. J. Neurophysiol. 98, 3638–3647.
Chambers, C. D., Bellgrove, M. A., Stokes, M. G., Henderson, T. R., Garavan, H., Robertson, I. H., Morris, A. P., and Mattingley, J. B. (2006). Executive “brake failure” following deactivation of human frontal lobe. J. Cogn. Neurosci. 18, 444–455.
Chang, C.-C., and Lin, C.-J. (2001). LIBSVM: a library for support vector machines. Software available at http://www.csie.ntu.edu.tw/ cjlin/libsvm .
Chen, C.-Y., Muggleton, N. G., Tzeng, O. J. L., Hung, D. L., and Juan, C.-H. (2009). Control of prepotent responses by the superior medial frontal cortex. Neuroimage 44, 537–545.
Durston, S., and Casey, B. J. (2006). What have we learned about cognitive development from neuroimaging? Neuropsychologia 44, 2149–2157.
Durston, S., Thomas, K. M., Yang, Y., Ulug, A. M., Zimmerman, R. D., and Casey, B. J. (2002). A neural basis for the development of inhibitory control. Dev. Sci. 5, F9–F16.
Fillmore, M. T., and Rush, C. R. (2002). Impaired inhibitory control of behavior in chronic cocaine users. Drug Alcohol Depend. 66, 265–273.
Floden, D., and Stuss, D. T. (2006). Inhibitory control is slowed in patients with right superior medial frontal damage. J. Cogn. Neurosci. 18, 1843–1849.
Giedd, J. N., Blumenthal, J., Jeffries, N. O., Castellanos, F. X., Liu, H., Zijdenbos, A., Paus, T., Evans, A. C., and Rapoport, J. L. (1999). Brain development during childhood and adolescence: a longitudinal MRI study. Nat. Neurosci. 2, 861–863.
Hanke, M., Halchenko, Y. O., Sederberg, P. B., Hanson, S. J., Haxby, J. V., and Pollmann, S. (2009). PyMVPA: A python toolbox for multivariate pattern analysis of fMRI data. Neuroinformatics 7, 37–53.
Hastie, T., Tibshirani, R., and Friedman, J. (2001). The elements of statistical learning: data mining, inference, and prediction. New York, NY: Springer Publishing Company, Inc.
Haynes, J.-D., and Rees, G. (2006). Decoding mental states from brain activity in humans. Nat. Rev. Neurosci. 7, 523–534.
Kohavi, R. (1995). “A study of cross-validation and bootstrap for accuracy estimation and model selection,” in International Joint Conference on Artificial Intelligence, (San Francisco, CA: Morgan Kaufmann Publishers) 1137–1143.
Leibenluft, E., Rich, B. A., Vinton, D. T., Nelson, E. E., Fromm, S. J., Berghorst, L. H., Joshi, P., Robb, A., Schachar, R. J., Dickstein, D. P., McClure, E. B., and Pine, D. S. (2007). Neural circuitry engaged during unsuccessful motor inhibition in pediatric bipolar disorder. Am. J. Psychiatry 164, 52–60.
Li, C.-S. R., Huang, C., Constable, R. T., and Sinha, R. (2006). Imaging response inhibition in a stop-signal task: neural correlates independent of signal monitoring and post-response processing. J. Neurosci. 26, 186–192.
Lijffijt, M., Kenemans, J. L., Verbaten, M. N., and van Engeland, H. (2005). A meta-analytic review of stopping performance in attention-deficit/hyperactivity disorder: deficient inhibitory motor control? J. Abnorm. Psychol. 114, 216–222.
Logan, G. D. (1994). “On the ability to inhibit thought and action: a users’ guide to the stop signal paradigm,” in Inhibitory Processes in Attention, Memory, and Language, eds D. Dagenbach and T. H. Carr, (San Diego, CA: Academic Press) 189–240.
Logan, G. D., and Cowan, W. B. (1984). On the ability to inhibit thought and action: a theory of an act of control. Psychol. Rev. 91, 295–327.
Logan, G. D., Schachar, R. J., and Tannock, R. (1997). Impulsivity and inhibitory control. Psychol. Sci. 8, 60–64.
Logan, G. D., Schachar, R. J., and Tannock, R. (2000). Executive control problems in childhood psychopathology: stop signal studies of attention deficit hyperactivity disorder. In Control of Cognitive Processes: Attention and Performance Vol. XVIII, eds S. Monsell and J. Driver, (Cambridge, MA: MIT Press), 653–677.
Miller, M. B., Van Horn, J. D., Wolford, G. L., Handy, T. C., Valsangkar-Smyth, M., Inati, S., Grafton, S., and Gazzaniga, M. S. (2002). Extensive individual differences in brain activations associated with episodic retrieval are reliable over time. J. Cogn. Neurosci. 14, 1200–1214.
Monterosso, J. R., Aron, A. R., Cordova, X., Xu, J., and London, E. D. (2005). Deficits in response inhibition associated with chronic methamphetamine abuse. Drug Alcohol Depend. 79, 273–277.
O’Toole, A. J., Jiang, F., Abdi, H., Pénard, N., Dunlop, J. P., and Parent, M. A. (2007). Theoretical, statistical, and practical perspectives on pattern-based classification approaches to the analysis of functional neuroimaging data. J. Cogn. Neurosci. 19, 1735–1752.
Picton, T. W., Stuss, D. T., Alexander, M. P., Shallice, T., Binns, M. A., and Gillingham, S. (2007). Effects of focal frontal lesions on response inhibition. Cereb. Cortex 17, 826–838.
Poldrack, R. A., Halchenko, Y. O., and Hanson, S. J. (2009). Decoding the large-scale structure of brain function by classifying mental states across individuals. J. Am. Psychol. Soc. 20, 1364–1372.
Rasmussen, C. E., and Williams, C. K. I. (2006). Gaussian Processes for Machine Learning. Cambridge, MA: MIT Press.
Rubia, K., Smith, A. B., Brammer, M. J., and Taylor, E. (2003). Right inferior prefrontal cortex mediates response inhibition while mesial prefrontal cortex is responsible for error detection. Neuroimage 20, 351–358.
Rubia, K., Smith, A. B., Taylor, E., and Brammer, M. (2007). Linear age-correlated functional development of right inferior fronto-striato-cerebellar networks during response inhibition and anterior cingulate during error-related processes. Hum. Brain Mapp. 28, 1163–1177.
Scholkopf, B., and Smola, A. J. (2000). Learning with Kernels: Support Vector Machines, Regularization, Optimization, and Beyond (Adaptive Computation and Machine Learning). Cambridge, MA: MIT Press.
Sowell, E. R., Thompson, P. M., Holmes, C. J., Jernigan, T. L., and Toga, A. W. (1999). In vivo evidence for post-adolescent brain maturation in frontal and striatal regions. Nat. Neurosci. 2, 859–861.
Tohka, J., Foerde, K., Aron, A. R., Tom, S. M., Toga, A. W., and Poldrack, R. A. (2008). Automatic independent component labeling for artifact removal in fMRI. Neuroimage 39, 1227–1245.
van den Wildenberg, W. P. M., van Boxtel, G. J. M., van der Molen, M. W., Bosch, D. A., Speelman, J. D., and Brunia, C. H. M. (2006). Stimulation of the subthalamic region facilitates the selection and inhibition of motor responses in Parkinson’s disease. J. Cogn. Neurosci. 18, 626–636.
Van Essen, D. C. (2005). A population-average, landmark- and surface-based (PALS) atlas of human cerebral cortex. Neuroimage 28, 635–662.
Williams, B. R., Ponesse, J. S., Schachar, R. J., Logan, G. D., and Tannock, R. (1999). Development of inhibitory control across the life span. Dev. Psychol. 35, 205–213.
Keywords: development, predictive analysis, fMRI, response inhibition, stop-signal
Citation: Cohen JR, Asarnow RF, Sabb FW, Bilder RM, Bookheimer SY, Knowlton BJ and Poldrack RA (2010) Decoding developmental differences and individual variability in response inhibition through predictive analyses across individuals. Front. Hum. Neurosci. 4:47. doi: 10.3389/fnhum.2010.00047
Received: 20 December 2009;
Paper pending published: 03 February 2010;
Accepted: 05 May 2010;
Published online: 02 July 2010
Edited by:
Silvia A. Bunge, University of California Berkeley, USAReviewed by:
John-Dylan Haynes, Bernstein Center for Computational Neuroscience, GermanyLuiz Pessoa, Indiana University, USA
Copyright: © 2010 Cohen, Asarnow, Sabb, Bilder, Bookheimer, Knowlton and Poldrack. This is an open-access article subject to an exclusive license agreement between the authors and the Frontiers Research Foundation, which permits unrestricted use, distribution, and reproduction in any medium, provided the original authors and source are credited.
*Correspondence: Jessica R. Cohen, Department of Psychology, University of California Los Angeles, 1285 Franz Hall Box 951563, Los Angeles, CA 90095, USA. e-mail: jrcohen@psych.ucla.edu