Emergence of Physiological Oscillation Frequencies in a Computer Model of Neocortex
- 1 SUNY Downstate/NYU-Poly Joint Biomedical Engineering Program, Brooklyn, NY, USA
- 2 Neural and Behavioral Science Program, SUNY Downstate, Brooklyn, NY, USA
- 3 Center for Neural Science, New York University, New York, NY, USA
- 4 Department of Physiology and Pharmacology, SUNY Downstate, Brooklyn, NY, USA
- 5 Department of Neurology, SUNY Downstate, Brooklyn, NY, USA
- 6 Kings County Hospital, Brooklyn, NY, USA
Coordination of neocortical oscillations has been hypothesized to underlie the “binding” essential to cognitive function. However, the mechanisms that generate neocortical oscillations in physiological frequency bands remain unknown. We hypothesized that interlaminar relations in neocortex would provide multiple intermediate loops that would play particular roles in generating oscillations, adding different dynamics to the network. We simulated networks from sensory neocortex using nine columns of event-driven rule-based neurons wired according to anatomical data and driven with random white-noise synaptic inputs. We tuned the network to achieve realistic cell firing rates and to avoid population spikes. A physiological frequency spectrum appeared as an emergent property, displaying dominant frequencies that were not present in the inputs or in the intrinsic or activated frequencies of any of the cell groups. We monitored spectral changes while using minimal dynamical perturbation as a methodology through gradual introduction of hubs into individual layers. We found that hubs in layer 2/3 excitatory cells had the greatest influence on overall network activity, suggesting that this subpopulation was a primary generator of theta/beta strength in the network. Similarly, layer 2/3 interneurons appeared largely responsible for gamma activation through preferential attenuation of the rest of the spectrum. The network showed evidence of frequency homeostasis: increased activation of supragranular layers increased firing rates in the network without altering the spectral profile, and alteration in synaptic delays did not significantly shift spectral peaks. Direct comparison of the power spectra with experimentally recorded local field potentials from prefrontal cortex of awake rat showed substantial similarities, including comparable patterns of cross-frequency coupling.
Introduction
Coordination of neocortical oscillations has been hypothesized to underlie the “binding” essential to cognitive function (Treisman, 1996; Engel and Singer, 2001; Singer, 2001; Wu et al., 2007; Fenton et al., 2010; Kelemen and Fenton, 2010). There is also evidence that neocortical oscillations contribute to working memory, and that alterations of brain oscillations are associated with diseases producing psychiatric disease (Spencer et al., 2003, 2004; Raghavachari et al., 2006; Uhlhaas and Singer, 2006; Uhlhaas et al., 2006; Düzel et al., 2010; Lisman, 2010). Recent experimental evidence suggests that human neocortex can generate theta locally (Raghavachari et al., 2006; Tsujimoto et al., 2006). At present, the mechanisms that generate neocortical oscillations in physiological frequency bands remain unknown, likely involving both intrinsic cortical properties and projections from other centers (Bazhenov et al., 2002). Understanding is complicated by the fact that neocortex is an area of great circuit complexity, which receives projections from multiple subcortical areas, including hippocampus, a potent generator of theta activity (Stewart and Fox, 1990; Hasselmo, 2006; Sirota et al., 2008; Cutsuridis and Hasselmo, 2010).
It is widely believed that neocortical circuits are arranged in columns and that these columns may be elemental information processing units (Mountcastle, 1997; Petersen and Sakmann, 2001). Although the columnar hypothesis remains controversial and lacks anatomical verification (Buxhoeveden and Casanova, 2002; Rockland and Ichinohe, 2004; Costa and Martin, 2010), it is at worst a convenient approximation. We therefore used a columnar organization in these studies. The columnar hypothesis suggests that individual columns can process and store information internally, and then send and receive information amongst themselves. Both intercolumnar and interlaminar connectivity provide a complex of circuitry with multiple levels of embedded and interlaced recurrent connections that may play complementary roles in information processing (Douglas et al., 1989; Nelson, 2002; Hill and Tononi, 2005; Sporns et al., 2005; Izhikevich and Edelman, 2008). These many levels of recurrence add to the difficulty in unraveling the dynamical contributions of layering and of cortical and regional organization.
The genesis of the electroencephalographic signal, first demonstrated over 80 years ago, remains little understood. We performed simulations of a group of nine neocortical columns from sensory cortex in order to determine the cellular, laminar and columnar relations that produce these characteristic oscillations. Our central hypothesis was that the characteristic spectral pattern would emerge from interrelations of the elements at multiple scales: cell types with differing intrinsic dynamics, connections via certain delays, complex topology involving interactions both within and between multiple layers, local intracolumnar and more remote intercolumnar connections. Due to the multiple nested and interlocking feedback loops, straightforward definition of a single oscillatory origin is impossible. In order to assess dynamical credit-assignment, we used minimal dynamical perturbation as a methodology for selectively altering individual ingredients in the dynamical system without pushing the system into a substantially different dynamical pattern. We minimally altered the neocortical topology by incrementally adding one hub (a cell with many more inputs/outputs than average) at a time to selected layers. This allowed us to demonstrate that layer 2/3 was critical for producing the specific spectral pattern characteristic of neocortex. Spectral power from our model’s population activity was found to be similar to spectral power from local field potential recordings from rat medial prefrontal cortex, both in profile and cross-frequency coupling.
Materials and Methods
Simulations
Simulations were run using NEURON (Hines and Carnevale, 2001; Carnevale and Hines, 2006). The cell model was an extension of an integrate-and-fire unit and was simulated in an event-driven fashion, since cell state variables were only calculated at input events. Complexity was added using rules with various dynamical features found in real neurons: adaptation, bursting, depolarization blockade, and voltage-sensitive NMDA conductance (Lytton and Stewart, 2005, 2006; Lytton and Omurtag, 2007; Lytton et al., 2008b). Briefly, each cell had a membrane voltage level state variable (Vm) and a resting membrane potential (VRMP), which was the baseline value for Vm in the absence of external inputs. After synaptic input events, if Vm crossed spiking threshold (VTH), the cell would emit an action potential and enter an absolute refractory period, lasting τrefrac ms, during which it could not fire. Refractory periods were set to prevent a maximum firing frequency from being exceeded. After an action potential, an after-hyperpolarization voltage state variable was set (Vahp) and then subtracted from Vm. Then Vahp decayed exponentially with time-constant (τahp) to 0. To simulate voltage blockade a cell could not fire if Vm surpassed Vblock. Relative-refractory period was simulated after an action potential by increasing the threshold, VTH, by WRR. (Vblock − VTH) (to scale the increase in VTH by a fraction of the voltage range where the cell could fire), where WRR was a unitless weight parameter. VTH then decayed exponentially to its baseline value with time-constant τRR.
Baseline wiring and number of cells per layer were based on published models and anatomical studies, which necessarily come from different species and different areas and are sometimes inferred rather than explicitly stated. We used data from cat visual cortex (Thomson et al., 2002; Binzegger et al., 2004), rat visual cortex (Song et al., 2005), and rat barrel cortex (Lefort et al., 2009) for intracolumnar connectivity information. We used mouse somatosensory cortex data for intercolumnar projections, which showed lateral inhibition as well as excitation between layers 2/3 and 5 of neighboring columns (Adesnik and Scanziani, 2010). In addition, we used data from previously published neocortical column models to ensure that our model was consistent with data used by others (Traub et al., 2005; Heinzle et al., 2007). Unfortunately, exact numbers are not available for all connections. Instead estimates are available from a number of techniques including light and electron microscopy, dual to quadruple intracellular recordings, laser scanning photostimulation, and others. Often these methods do not entirely agree, partially due to the difference in techniques but also due to the studies being done in different species and in different neocortical areas. Due to incomplete and conflicting information, a number of choices had to be made based on judgment. This approach of integrating multiple data sources and using best approximations to real parameters has generally been used in other large-scale neocortical models (Traub et al., 2005; Izhikevich and Edelman, 2008).
In our model, there were 13 cell types, arranged in 4 layers: 2/3, 4, 5, and 6. Interneurons were parameterized as fast-spiking (FS) or low-threshold spiking (LTS) interneurons. FS and LTS interneurons utilized somatic and dendritic GABAA synapses, respectively. The following cell types were included: E2, I2, I2L, E4, I4, I4L, E5a, E5b, I5, I5L, E6, I6, and I6L. E (I) represent excitatory (inhibitory) cells, and the number following the cell type represents the layer, i.e., E2 represents pyramidal cells in layers 2/3. I6 represents FS interneurons in layer 6, and I6L represents LTS interneurons in layer 6. E5a and E5b are two subtypes of pyramidal neurons present in layer 5, with different connectivity patterns (Steriade, 2004; Brown and Hestrin, 2009; Groh et al., 2010). Parameters and counts for the cell types are listed in Table 1.
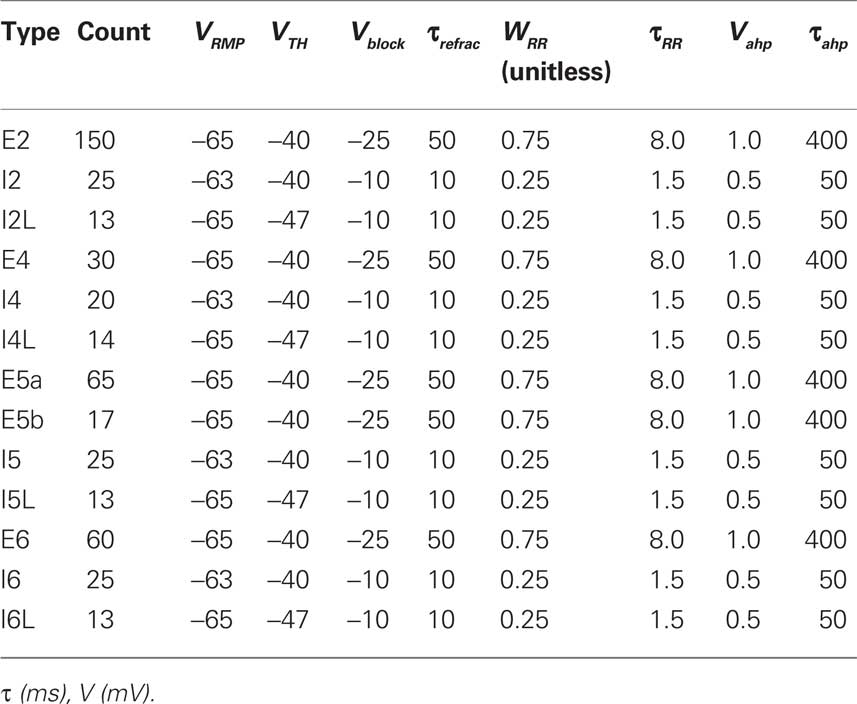
Table 1. Cell parameters and counts (within column).
Intracolumnar synapses utilized our previously developed just-in-time synapses, optimized for large networks supporting high-frequency synaptic events (Lytton et al., 2008a). Intercolumnar synapses used NEURON’s NetCon synapses (Lytton, 1996), included to permit future parallelization of single columns per node via the message passing interface (MPI). Each cell had a voltage state variable associated with a synapse type, Vsyn, one for each of excitatory AMPA, NMDA, and two inhibitory GABAA s, which simulated GABAA at soma (fast time-constant) and GABAA at dendrite (slower time-constant). Synaptic inputs were simulated by step-wise changes in Vsyn and then added to the cell’s Vm level. To allow for dependence on Vm, synaptic inputs changed Vsyn by δV = wsyn.(1 − Vm/Esyn), where wsyn is the synaptic weight and Esyn is the reversal potential, relative to VRMP. Esyn took the following values (in mV): AMPA 65, NMDA 90, GABAA −15. wsyn was positive for excitatory synapses and negative for inhibitory synapses. NMDA synapses also had an additional voltage-dependent scaling factor based on Jahr and Stevens(1990a,b). For all synapses, after synaptic input events, Vsyn decayed exponentially toward 0 with time-constant τsyn. τsyn took the following values (in milliseconds): AMPA 20, NMDA 300, somatic GABAA 10, dendritic GABAA 20. Synaptic weights were constant between a given set of populations. Dendritic synapses (AMPA, NMDA, dendritic GABAA) utilized delays chosen from a uniform distribution ranging from 3 to 5 ms, while somatic synapses (somatic GABAA) had delays ranging from 1.8 to 2.2 ms.
The network consisted of nine cortical columns (from sensory neocortex) with each column connected to all other columns. We refer to simulations with interconnected columns as multicolumnar simulations. Each of the nine cortical columns had 470 cells, for a total of 4230 cells. The number of synapses for a particular cell was chosen from a normal distribution using average connection densities between different classes of cells. Intra- and intercolumnar connectivity information is shown in Tables 2 and 3, respectively. Each cell’s spatial location is determined by its column and cell type. Together, these determine the cell’s probability of connecting to other cells.
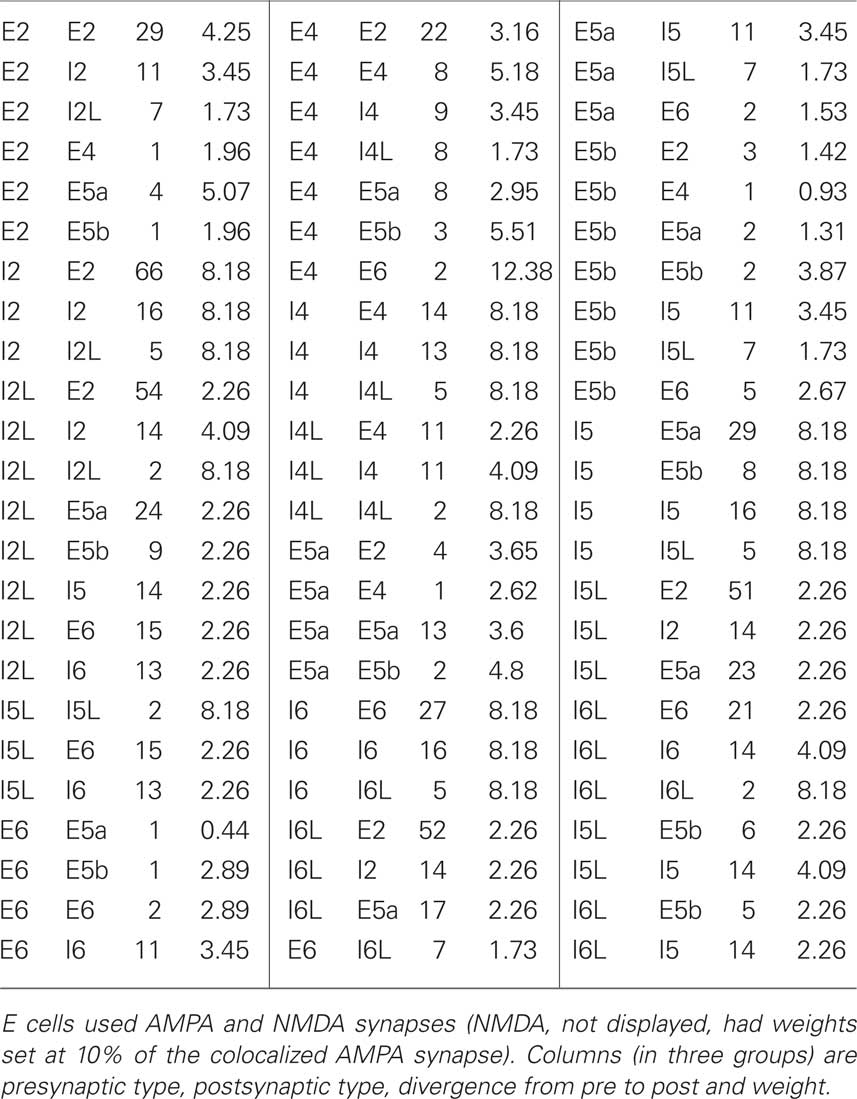
Table 2. Intracolumnar connectivity parameters are listed below.
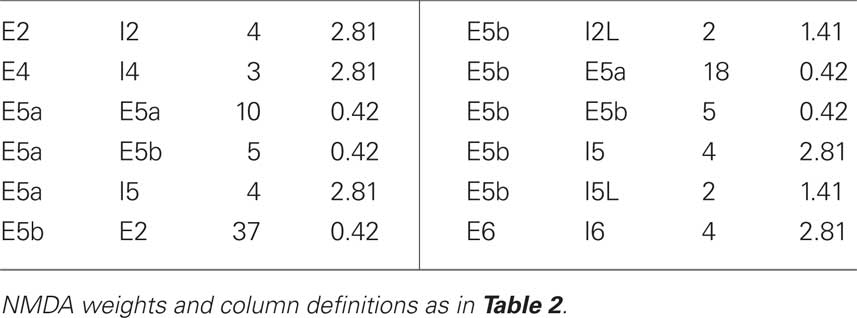
Table 3. Intercolumnar connectivity parameters.
Biological connection densities across and within cell type groupings are believed to cover the wide range of 1–50% in different areas (Thomson et al., 2002; Song et al., 2005; Orman et al., 2008). A typical number of synapses for a baseline simulation was 831,967 out of 17,888,670 (full number of possible connections: n2 − n for a fully connected network without self-connections), for an overall density of 4.65%, consistent with densities found in the literature. Within a column, the average number of synapses was 8390, 5767, 7449, and 3810 for E → E (excitatory → excitatory), E → I (excitatory → inhibitory), I → E, and I → I synapses, respectively. Between columns, the average number of synapses was 1974 and 1331, for E → E and E → I connections, respectively.
Descriptions of the dynamics emerging from structural layouts of neural tissue must be seen in the context of the vertical wiring layout between different layers and the horizontal layout across areas and columns. Although both wiring and component specifications remain incompletely understood, there is growing knowledge on which we base our model, depicted in Figure 1 (Douglas et al., 1989; Thomson and Bannister, 2003; Binzegger et al., 2004; Douglas and Martin, 2004, 2007a,b; Markram et al., 2004; Traub et al., 2005; Thomson and Lamy, 2007; Izhikevich and Edelman, 2008; Weiler et al., 2008; Brown and Hestrin, 2009; Lefort et al., 2009; Adesnik and Scanziani, 2010; Anderson et al., 2010; Groh et al., 2010; Neymotin et al., 2010).
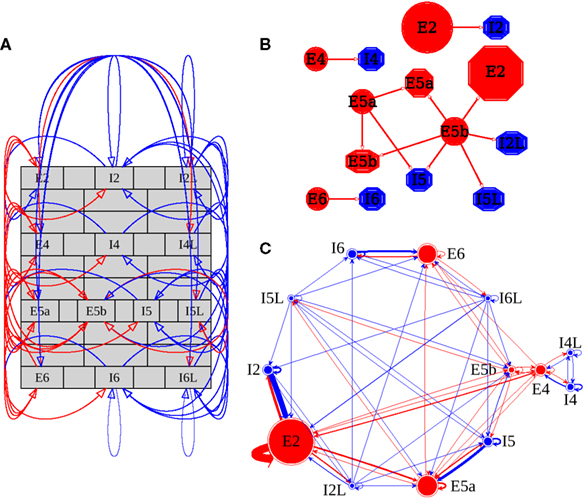
Figure 1. Network structure and wiring. Directed wiring is red for excitatory and blue for inhibitory connections. Cell types are E (excitatory) or I (inhibitory), followed by layer number (2 represents 2/3) and an additional letter for cell subsets: L = low-threshold spiking cells; Layer 5 has two E cell subpopulations: 5a, 5b. (A) Intracolumnar wiring. (B) Graph-theoretic representation of intercolumnar wiring. Circles (octagons) represent pre- (post-) synaptic types. Circle size ∝ # cells in population (E red, I blue). Wiring among the nine columns was all-to-all. (C) Graph-theoretic representation of intracolumnar wiring. Circle size ∝ # cells in population (E red, I blue) Line thickness ∝ connection strength (divergence multiplied by average synaptic weight). [(A,B,C) drawn with Graphviz software system; Gansner and North, 2000].
Figure 1A shows the cell types in the various layers, with connectivity depicted by red arrows for excitatory and blue for inhibitory connections. Intergroup connectivity density within the column is moderate (43%; 72 out of 169 possible connections for the 13 cell groups). Total E → E connections were 88%; E → I connections 25%; I → E connections 45%; I → I connections 34%. All populations have self-connections (note that these are not connections from a cell to itself but from cells in a group to different cells in the same group).
Figure 1B shows a graph-theoretic visualization of the intercolumnar group-to-group wiring between neocortical columns. There are again 169 possible connections, but the connection probability is 7% (12/169), far lower than within column. Although all projection pathways are excitatory, most project onto inhibitory cells and thereby produce feed-forward inhibition, largely laterally to the same layer across columns. An additional major lateral inhibitory projection goes from E5b → I2L. E5, the main output layer, is also the source of intercolumnar feed-forward excitatory connections, including E5b → E2 and connections from both E cell groups in layer 5.
Figure 1C shows a graph-theoretic schematic of intracolumnar connectivity. Each population is arranged in a circular layout in order to minimize the number of edge crossings (Six and Tollis, 1999a,b; Gansner and North, 2000). This has the effect of placing the nodes that are more densely connected closer to each other. The size of the circles shows the number of cells in that population and the width of the arrows indicates the strength of a projection (consisting of the product of the connection density and the average synaptic weights). The red circles are larger than the blue circles, indicating that the majority of neurons are excitatory. E2, the circle representing layer 2/3 pyramidal cells, is the largest, foreshadowing its large role in determining network dynamics. Additionally, the E2 → E2 connecting edge is very thick, indicating the strong recurrent connectivity within E2. E2 also strongly feeds into the I2 inhibitory population and gets strong feedback inhibition from there. E2 activity is thereby modulated through strong self-coupling via both excitation and inhibition.
The thick edge from E2 → E5a reflects the strength of this major intracolumnar, inter-layer excitatory pathway. E5a also has relatively strong recurrence, and feeds strongly onto E5b, reinforcing output layer 5’s activity. In most of the populations, inhibitory feedback loops are prominent, but with the E → I projection generally weaker than the I → E back-projection. We suspect that the stronger I → E might reflect the dual role of inhibitory cells as part of both feedback and feed-forward inhibition.
The graph visualization of network structure suggested that E2, I2, and E5 would have particularly large influence on the dynamics of the system. We tested this in the simulations.
Development of Hubbed Networks
To increase the efficacy of a chosen subpopulation, we added hubs to that subpopulation. Hubs are individual cells with a larger number of inputs and outputs than the average cell of the given type. Wiring changes were performed by first randomly selecting 1–10 cells from a group to be hubs. To preserve the overall number of synapses in the network, we randomly moved existing synapses from other cells and set the new hubs as their target or as their source. We avoided unconnected cells, holes, in the network by preventing wiring changes that resulted in a cell having no inputs, or no outputs. We set the hub cells to have 3× the post-rewiring average convergence and divergence of the non-hub cells of the same type. For excitatory cell hubs, the number of inputs and outputs to and from interneurons was not altered. This allowed these hubs to control excitation in the network, without changing inhibition. For inhibitory cell hubs, we increased the number of excitatory inputs from and inhibitory outputs to excitatory cells, allowing this type of hub to more effectively inhibit.
Data Analysis
Simulation spike trains were organized into multiunit activity (MUA) vectors, defined for a cell population within a column, as the number of spikes in the population over a time interval (bin). Bin sizes were set to 5 ms (200 Hz sampling rate). We evaluated bin sizes ranging from 0.1 to 5 ms and found similar results. We also generated simulated local field potential (sLFP) for easier visual comparison with experimental data. The sLFP is a summed and filtered result of synaptic activity that produces dipoles. With our limited, “point-neuron” model, sLFPs were approximated by summing excitatory-inhibitory synaptic input differences across excitatory cells and adding a small component of spike activity. The following expression was used for the synaptic contribution from each excitatory cell to the sLFP at each time step: Vcell = VAMPA + VNMDA − VGABAAsoma−VGABAA dend. Organization of simulations and analysis of output data was done with Neural Query System (Lytton, 2006; Lytton and Stewart, 2007). Spectral analyses used mean-subtracted vectors and were performed using Matlab’s implementation of the multitaper spectral power estimation method and FFT (pmtm() and FFT() functions; The MathWorks, Natick, MA, USA 2009b). The resulting power spectra were smoothed using a moving average filter for easier visualization and comparison of multiple power spectra. Similar peaks were visible in the unsmoothed spectra as well.
To measure regularity of individual spike trains, we used the local variation of interspike intervals method, defined as:
(Shinomoto et al., 2005), where Ti represents the ith interspike interval, and n is the number of intervals. Lv is 0 for interspike intervals formed from regular spike trains with a fixed interval between spikes and Lv is 1 for irregular spike trains with interspike intervals that are independently exponentially distributed, such as those generated by a Poisson process. Higher values tend to suggest clustered or burst firing.
Electrophysiology
All procedures received IACUC approval and were in accordance with institutional and NIH guidelines. Recordings were part of an experiment on the effect of hippocampal lesions using injections of ibotenic acid. The single recording used for this paper was from a control animal that had a saline injection. Briefly, timed-pregnant Long-Evans rats were obtained at 13–14 days of gestation from Charles River Laboratories (Wilmington, MA). On postnatal day 7 (P7), pups weight 14–18 g were anesthetized by hypothermia. A puncture hole was made bilaterally on the skull for injection sites (relative to bregma AP: 3.0 mm, ML: ±3.5 mm), and 0.3 μl of saline was infused bilaterally into the ventral hippocampal formation (relative to the skull surface DV: 5.0 mm) at 0.15 μl/min. The pups were warmed and then returned to their mothers. Since only saline was injected, this animal was considered a control animal which had no significant brain lesion. On P21, animals were weaned. At P60, the rats were implanted and recorded for local field potentials (LFP, procedure adapted from Olypher et al., 2006). The LFP recordings used in this paper were made bilaterally from the medial prefrontal cortex AP: +3.0 mm, ML: ±1.0 mm, DV: 4.0 mm (only left side recording used). Electrodes were referred to a reference electrode implanted in the cerebellar white matter. The rat was recorded in its homecage for 30 min. The signal was digitized (24-bits, 48 kHz; Axona Ltd, St. Albans, U.K.) and transmitted galvanically along a counter-balanced cable. The digital signals were received by a set of dedicated digital signal processors, bandpass filtered (1–500 Hz), amplified digitally, and then down-sampled (2000 Hz). Comparisons with simulation were done using normalized spectral data since simulation spectra were based on MUAs of arbitrary amplitude.
Results
This study involved over 1200 20 s simulations, using five different random wirings and five different input streams, as well as many briefer simulations used during tuning. Results shown were consistent across the variations in input streams and random wirings. Each simulation had nine columns, connected in some cases and not in others. Simulations were run on Linux on a 2.7 GHz quad-core Intel XEON CPU. A 20-s simulation ran in 2–4 min, depending on the simulation type. The full model is available on ModelDB (https://senselab.med.yale.edu/ModelDB/ShowModel.asp?model=138379).
Emergent Rhythms
To maintain activity throughout the simulation, each synapse was independently provided with background inputs: sub-threshold stimulation from external, independent, Poisson-random inputs at rates of 240–360, 40–60, and 100–150 Hz, for AMPA, NMDA, and GABAA synapses respectively. The frequency spectra of the interspike intervals of the background inputs were relatively flat, indicating white-noise spectra. Interspike interval local variation (ISI Lv, see Materials and Methods) of each input was near 1, further verifying that intervals between inputs were exponentially distributed (Shinomoto et al., 2005). In addition to external inputs, synapses received inputs from other cells in the model. Initially, with the cells of the network not connected, the weights of the background inputs were adjusted to provide low levels of activity. The cells were then connected up and the networks hand-tuned through adjustment of E → E, E → I, I → E, and I → I gains till physiologically realistic firing rates were obtained: E cells firing 0.5–3 Hz and I cells 1.5–10 Hz (Table 4). In the resulting network, all excitatory postsynaptic potentials remained sub-threshold, hence cell firing would only occur through integration of several inputs.

Table 4. Average firing rates (Hz) for the different cell types at baseline.
A network with strong E → E connectivity is at risk of runaway excitation that will produce epileptiform activity, either immediately self-limiting (interictal spike), or continuing (seizure). In order to avoid these pathologies, we did further E/I balancing so that there were no multilayer population spikes seen in the raster or simulated local field potentials (sLFPs), as shown in Figure 2. In addition, inhibitory weights onto E cells were set so as to prevent oversynchronization and stereotyped firing. In this way, we avoided the positive feedback latch-up seen with increased synaptic strength and increased excitatory firing rates (Lytton and Omurtag, 2007).
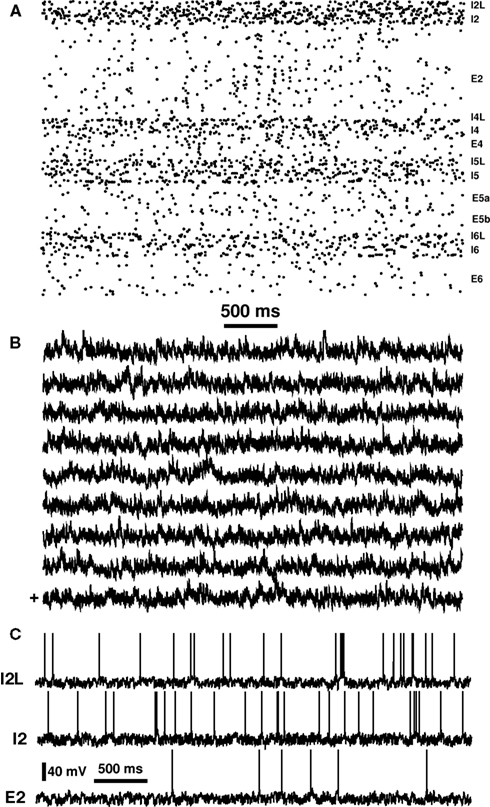
Figure 2. Basic activity of network. (A) Raster plot taken from a single column. Dots represent spikes from each cell, arrayed from bottom (Layer 6) to top (Layer 2/3) with cell populations labeled at right. (B) sLFPs from nine columns. “+” (lowest trace) indicates sLFP corresponding to raster in part (A). (C) Single cell voltage traces from low-threshold spiking interneuron (I2L), fast-spiking interneuron (I2), and pyramidal neuron (E2) in Layer 2/3.
The network produced a complex repertoire of activity patterns, including periods of low and high synchrony between neurons. In Figure 2, this alteration can be appreciated both in the raster, with its diffuse vertical stripes alternating with periods of asynchrony, and in the amplitude alterations of the sLFP. Additionally, individual cells fired with irregular patterns (Figure 2C). Note that the E2 pyramidal cell, like other excitatory cells, fired at a significantly lower rate than the inhibitory cells. We quantified the irregularity of single cell firing by using the local variation (Lv) measure used physiologically (Shinomoto et al., 2005). The background spike driving, being Poisson, is very tightly clustered around Lv = 1. Activity of the cells had a lower mean (Lv = 0.9; differs p < 0.001 by Student’s T-test) indicating more regular firing on average, and a much broader range of values (SD 0.32 compared to 0.01). This indicates that some cells were showing regular firing (Lv ≪ 1) while others were fairly bursty (Lv ≫ 1), despite there being no intrinsic bursting mechanism for the cells in this network. Increasing the strength of E → E coupling led to increased regularity of firing, with Lv decreasing from 0.9 to 0.7 (50% E → E weight increase) and to 0.3 (75% increase). This greater single cell firing regularity was associated with oversynchrony and fairly regular recurrence of population spikes. A somewhat more subtle form of synchronization pathology was the occurrence of synchronization across columns. A slight correlation between the sLFPs from different columns can be see in Figure 2B. We tuned intercolumnar excitatory connection strength to bring baseline correlations down to ∼0.09 (Pearson correlation of sLFPs). Note that there was no correlation when columns were unconnected, since each was driven with independent noise.
We tuned the networks using only two criteria, realistic firing rates and absence of pathological activity. When connecting the cells, all networks showed emergent activity with MUA frequency peaks close to physiologically relevant frequency bands (Figure 3). We used MUA rather than sLFP for spectral analysis since MUA is a representation of population output while sLFP is a representation of input to a population. MUA was formed by binning spikes with bin size 5 ms (200 Hz sampling rate); further decreasing bin size incrementally down to 0.1 ms did not change the spectra. Simulations with disconnected cells showed a fairly flat spectrum inherited from the white-noise driving (Figure 3A black traces). Strong theta/alpha (our model is not species specific, and one man’s alpha is another rat’s theta), emerged in the excitatory cells of the connected network with a prominent peak in E cell MUA near 7 Hz (Figure 3A, left, red). I cell MUA of connected cells showed a broad high gamma peak between 40 and 80 Hz (Figure 3A, right, red), consistent with evidence that interneurons generate gamma oscillations physiologically (Lytton and Sejnowski, 1991; Traub et al., 1996; Wang and Buzsaki, 1996; Tamás et al., 2000; Bartos et al., 2007; Tukker et al., 2007; Cardin et al., 2009; Sohal et al., 2009). This gamma peak was the result of selective attenuation of low-frequency oscillations due to synchrony within the I cell populations produced by the faster-firing I cells. The I2 population reflected the 7 Hz E2 peak when looked at in isolation (not shown), but this peak was lower than that of the E2 population. Both the E and I peaks demonstrated that individual subnetworks filtered out some frequency bands while augmenting or resonating to others. Note that all the emergent frequencies were considerably higher than the firing frequencies of the constituent cells. This demonstrated that these frequencies were produced by coordination within and across populations. Different cells fired on different cycles of the dominant frequencies, consistent with physiological data (Fries et al., 2007).
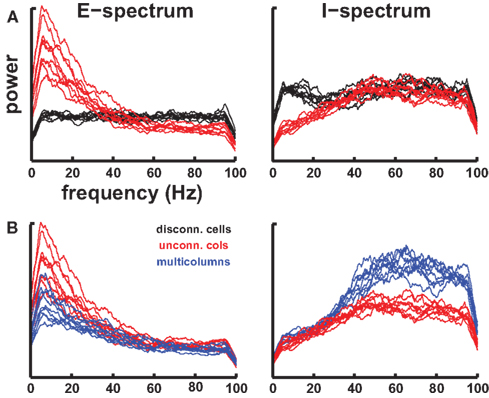
Figure 3. Spectral peak emerges from cell-cell interactions in network. Each trace shows spectrum from one of the nine columns in a given network. (A) Disconnected cells (black) vs connected cells (red). Flat spectrum for excitatory (E; left) and inhibitory (I; right) subsets directly reflected white-noise inputs with the cells disconnected. Connected cells in individual unconnected columns produced large theta peak in E cells and broad gamma peak in I cells. There is wide variation among the nine columns but peaks are largely aligned. Apparent falloff on both sides of spectrum is a smoothing artifact. (B) Unconnected columns [red identical to those in (A)] vs connected columns (blue). Connecting columns augments I population gamma (lateral activation of inhibitory cells) and dampens E population across the spectrum (feed-forward inhibition).
In Figure 3A we showed the emergence of specific frequencies when cells were connected within the column. In Figure 3B we show the alteration in spectrum when the columns were connected to one another. The theta peak in E cell MUA near ∼7 Hz was dampened (Figure 3B left, blue). Dampening was also seen in the gamma band out to about 35 Hz. By contrast, I cell MUA was augmented when columns were connected consistent with the strong intercolumnar excitatory projections onto inhibitory cells (Figure 3B right, blue). This then provides the feed-forward inhibition that reduced the power in the E cell spectrum.
Rewiring to Determine Dynamical Causality
Dynamical system evaluation offers a chicken and egg problem: given the existence of multiple loops, and loops within loops, there is no clear way to elucidate who drives whom. Those who drive are driven in turn. If we remove a subpopulation from a network (an ablation experiment) in an effort to determine whether this subpopulation was the major driver, we are left with a radically different network, that will show very different dynamics.
Our approach to this conundrum was to use a minimal dynamical perturbation: gently alter the network and determine how dynamics gradually changed. We slowly increased the efficacy of particular subpopulations through the addition of intracolumnar hubs. In a directed network (directed graph) such as this one, hubs are nodes that both receive projections from, and in turn project to, a large number of other nodes (as in an airline hub). In this case, the hubs were individual cells with 3× the post-rewiring average of convergence and divergence of non-hub cells of the same type. Connections remained individually sub-threshold, but large convergence means that these cells fired more. To preserve the overall number of synapses in the network (connection density), we randomly moved existing synapses from other cells and set the new hubs as their target or as their source. We avoided unconnected cells by preventing changes that would result in a cell having 0 inputs or 0 outputs.
Using individual (unconnected) columns, we increased the number of hubs in each excitatory population independently and calculated the E MUA spectral power from the remaining subset of cells. Power greatly increased above baseline with addition of hubs to E2 but not with addition of hubs to other populations (Figure 4). This increase was evident both in the E MUA power and the I MUA power (not shown), across frequencies. E2 cell parameters did not differ from those of other E cell types, so the change was due to the position of the E2 population in the overall network. The increase was particularly prominent in the theta/alpha and low beta bands (note different y-axis scales). Detectable increases in oscillatory power took place with as few as 5 of the 150 E2 cells being wired as hubs.
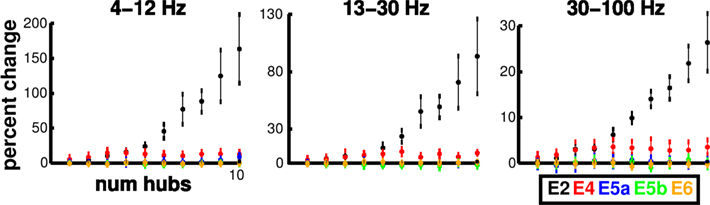
Figure 4. Addition of hubs to E2 produces substantial power increases in unconnected columns. Changes in power in E MUA subnetwork with increased number of E hubs in particular subpopulations in theta/alpha (4–12 Hz), beta (13–30 Hz), and gamma (30–100 Hz) frequency bands (subnetwork excludes the subpopulation being affected). Each point is mean (n = 9) ± SEM.
Local Structural Changes Produced Dynamical Changes
In the 10-E2-hubs columns (multi-hub columns), individual E2 hubs had average excitatory convergence of 95 and divergence of 91, approximately 3× the 31 average for the non-hub cells in the network. E2 hub cells were activated by more cells so showed average firing rates of 2.68, compared to 1.01 Hz for non-hub E2 cells. The E2 hubs also increased the average firing rates of other populations (in Hz): overall E2 1.124; I2 2.988; I2L 4.83; E4 0.804; E5a 0.914; E5b 0.659; I5 1.46; I5L 3.48 (compare to Table 4). The increased rate of non-hub cells was due to the excitatory positive feedback resulting from enhanced bidirectional connectivity between the hubs and their targets/sources. As a result, when a hub cell fired, a much larger number of cells in the network had their probability of firing increased after synaptic delay. Since the hub received a higher number of feedback projections from its targets than the average cell, it was also much more likely to fire within a short interval of its targets firing, potentially receiving disynaptic activation from itself. This positive feedback resulted in enhanced synchrony among hubs and between hubs and targets.
Individual columns of unconnected networks showed population spikes (Figure 5), where population spikes were defined as the co-firing of ≥35% of all E cells during a 20-ms interval (Neymotin et al., 2008). As seen from the raster plot, these extend across pyramidal cells of Layers 2/3 and 5. The population spikes are also apparent in the sLFP (Figure 5B). Individual columns had an average of 1.6 population spikes per minute. The number of spikes was negligible for columns without E2 hubs.
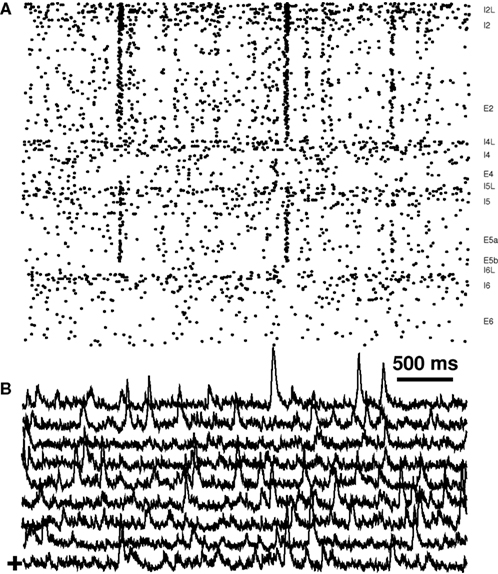
Figure 5. Population spikes are prominent in unconnected columns of 10 E2 hub network. (A) Single column raster. (B) sLFP from nine columns. “+” (lowest trace) is sLFP corresponding to raster in part (A).
We then connected the columns as before (Figure 6). Therefore, the E2 hubs remained as strictly intracolumnar hubs and did not have any increased probability of projecting laterally to neighboring columns. However, E2 is a major lateral-projection source, so some of these E2 hubs would project from the column. As before, connecting the columns produced feed-forward inhibition. This reduced the overall hyperexcitability that was seen with the unconnected columns. Hence E2 firing rates were augmented less in comparison to the isolated columns. Rates of the other excitatory cells groups were also relatively depressed. Due to increased feed-forward inhibition from lateral connections, hub-induced population spikes were also reduced to only 0.25/min.
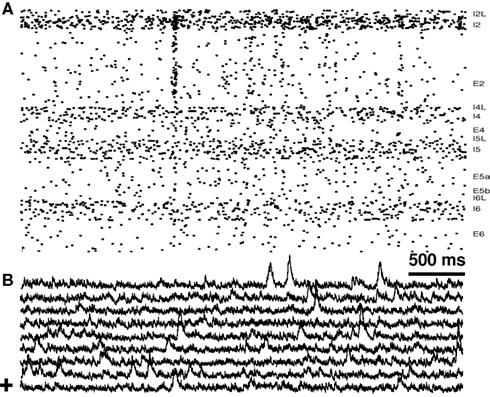
Figure 6. Feed-forward inhibition across columns reduces population spikes. Multicolumnar network with 10 E2 hubs/column. (A) Raster from one column; (B) sLFP of all nine columns. “+” (lowest trace) indicates sLFP corresponding to raster in part (A).
I2 Hubs Sculpt Out Additional High Gamma
We hypothesized that the I2 interneurons played a prominent role in determining gamma activation in the network. We tested the effects of increases in I2 hub density in the individual unconnected columns. I2 hubs were created with respect to excitatory cells: convergence from and divergence to excitatory cells was increased 3× relative to other I2 cells. As with the E2 case, the I2 cells had greatest influence over the spectrum compared to I cells in other layers. However, where the E2 hubs had created increases in spectral strength, I2 hubs caused prominent reductions in theta and beta power (Figure 7). These reductions were consistent with the expected dampening effect of inhibitory interneurons. Interestingly, dampening was far less in the gamma band, where maximum reduction was <3%. Hence the presence of the I2 hubs produced an overall shift of frequencies toward gamma through selective dampening, sculpting the response by selective frequency removal. This selective dampening is consistent with the effects of low-frequency attenuation of I MUA oscillations seen when connecting the cells (Figure 3A right).
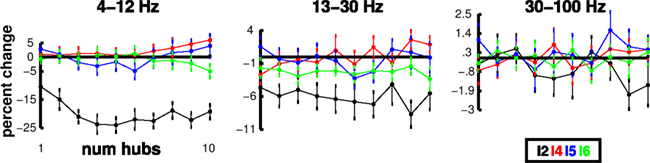
Figure 7. Spectral sculpting by selective frequency dampening. Individual column E MUA power reductions as a function of number of I2 hubs in different frequency bands. Note different y-axes; each point mean (n = 9) ± SEM.
Additional dynamical effects were also noted in this 10-I2-hub network. I2 hub rates were 2.93 ± 0.04 Hz, compared to 1.24 ± 0.02 Hz for non-hub I2 cells. E2 firing rates decreased slightly to 0.70 Hz, down from 0.76 Hz without I2 hubs. Note that the dampening effects became complex since I hubs reduced activation of E cells which then fed back to produce reduced I cell activation, mostly in the non-hub cells. At the same time, inhibition from hubs to other I cells caused further suppression of interneuronal activity.
Frequency Homeostasis
We looked at the effect of driving on the network by increasing the strength of the random inputs onto the E2 subpopulation (Figure 8). This would correspond to activation due to the back-projections from higher cortical areas, postulated to accompany increased attentional focus (Bollimunta et al., 2008). Firing rates increased substantially with this manipulation: nearly doubling to 1.1 Hz for the E2 cells, more than doubling for I2 cells to 10.19 Hz; and increasing 18, 9, 16% for E5a (0.8 Hz), E5b (0.76 Hz), and I5 (3.31 Hz) populations (compare to Table 4). Small increases were also seen in most other cell subpopulations. Remarkably, these large changes in individual cell firing rates did not produce substantial changes in the E cell spectral profile. Spectral power increased across all frequencies for the E cell population with no appreciable shift in peak, demonstrating that the network compensated in order to maintain spectral consistency. This compensation, a form of homeostasis, appeared to involve feedback from the I cell population which did show substantial shifts, with greatly increased strength in the theta and high gamma bands.
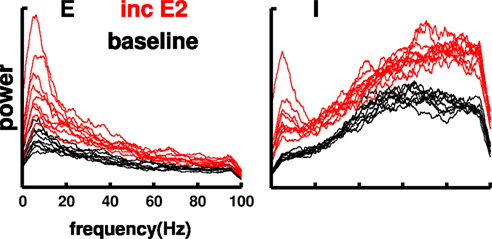
Figure 8. Frequency homeostasis: no appreciable shift in E MUA peak with increased external inputs to E2 cells. E and I MUA power spectra in individual columns of multicolumnar network (black: baseline; red: 10% increase in AMPA weight).
We also assessed the effects of changes in synaptic delays (Figure 9). We ran 75 20-s simulations increasing and decreasing mean values of synaptic delays by 50% relative to baseline: dendritic delays centered at 2, 4 (baseline simulation), 6 ms; somatic delays at 1, 2 (baseline), 3 ms. Increasing the delays to 150% reduced MUA spectral power and produced a significant shift in the theta peak down to 6.1 Hz, which could be partially explained by sharpening of the peak at the left side. The power reduction was explained by noting a slight but significant (p < 0.001) increase in the firing rate of I cells from 4.29 to 4.38 Hz. The added I cell activity may also be responsible for the shift in gamma toward higher frequencies. Firing rates of E cells across the three sets of simulations did not change significantly. Similarly, excitatory MUA spectral power was increased in the 50% delay simulations, with some decrease in I cell firing rate. The relative alterations in population frequency are small compared to the 50% change in synaptic delays, further demonstrating frequency homeostasis.
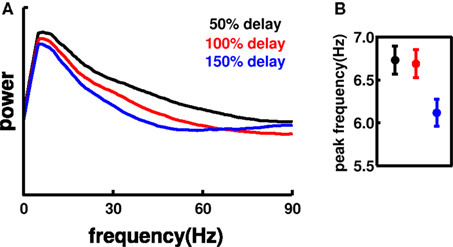
Figure 9. Effects of altered synaptic delays. (A) Average E MUA power for the different delays. Spectral power decreases and shifts slightly left with increased delay. (B) Peak frequency (± SEM) of E MUA spectral power.
Coordination Across Columns
Shared spectrum across columns has been hypothesized to allow for various forms of phase locking that permits intercolumnar and interareal communication and coordination (von der Malsburg and Schneider, 1986; Gray and Singer, 1989; Engel et al., 1991; von der Malsburg, 1995). These experiments are largely done using LFP recordings. Therefore we looked at pairwise correlations between our simulated LFPs across connected columns of multiple multicolumnar networks of each simulation type (Figure 10). As expected, all network types showed substantial increases in correlations compared to the random correlations seen in the unconnected network. There was a significant further increase in correlations in the 10-E2-hub models, with an average of 0.117 compared to 0.089 (p < 0.001). This was due to the added excitation spreading first within, and then across, columns, as a result of the hub activity.
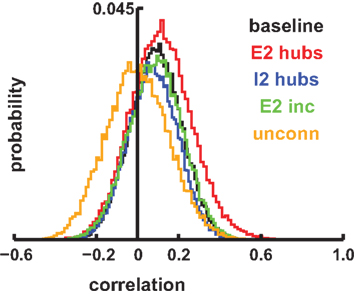
Figure 10. Intercolumnar Pearson correlation histograms from simulation sLFPs using 500 ms windows. Twenty-five random networks were assessed for each simulation type (connected columns). “unconn” indicates simulations of unconnected columns used as control.
Comparison to Experimental Data
We compared the spectral power of each of our multicolumn simulations against the pattern of spectral power taken from a 30-min duration LFP recording from left medial prefrontal cortex from an awake rat (Figure 11). Although this was a characteristic spectrum, analysis of spectra from 1-min sections showed considerable variation over this period, with substantial shifts in both amplitude and position of the major frequency bands. Best matches to the spectrum shown were found by minimizing mean-squared error across different scalings of the arbitrarily-scaled simulation power spectra. The best overall match came from an E2inc simulation with a mean-squared error of 1.4·10−4. The power spectra shown lines up with the experimental at the low-frequency peak and at the high-frequency peak in gamma near 60 Hz. Best fit error for the other simulations were 1.6·10−4 for the E2hub simulation, 2.3·10−4 for a baseline simulation, and 2.5·10−4 for a I2hub simulation. Other exemplars of our simulation variants also showed similarity to the experimental spectrum over the full range of frequencies, many showing a small gamma peak similar to that of the experimental spectrum. The distribution of errors for each simulation type is shown in Figure 11B. Overall, the E2hub and E2inc simulations matched the best, with errors of 2.76·10−4 ± 4·10−6 and 2.86·10−4 ± 4·10−6 respectively (mean ± SEM). The added E2 activity levels in these simulations supports the role of E2 in generating physiological oscillatory activity. The baseline, and I2hub simulations had higher errors of 3.71·10−4 ± 4·10−6 and 3.99·10−4 ± 4·10−6, respectively. As noted, biological recordings also show considerable variability among LFP power spectra measured at different times or in different areas, with theta and gamma peaks always recognizable despite shifts and changes in amplitude.
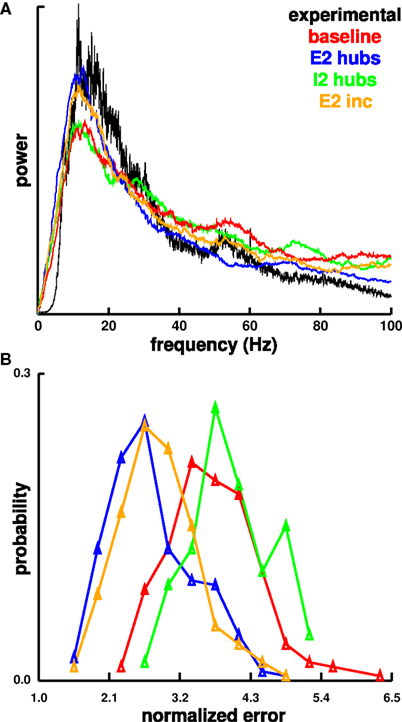
Figure 11. Comparison of power spectrum from 30-min LFP recorded in left medial prefrontal cortex of awake rat to normalized MUA power spectra from the different simulation types. Low-frequency cut-off for the experimental spectrum was due to a 1-Hz high-pass filter. (A) Best matches for each simulation type are displayed. (B) Distribution of normalized errors for the different simulation types are displayed. Units are mean-squared error times 10−4.
Experimentally, theta and gamma show cross-frequency coupling, with activations coincident in time (Palva et al., 2005; Canolty et al., 2006). We were able to capture a similar pattern of relationship in multiple simulations (Figure 12). To quantify the coupling of power changes between pairs of frequencies across time, we used power-fluctuation correlation matrices. This involved calculating pairwise Pearson correlation between the MUA spectrogram’s time-series of power from each pair of frequencies, f1 and f2. The values were then stored in a matrix and plotted in a two-dimensional heat-map with the color at coordinates f1, f2 in the matrix representing the correlation between frequencies f1 and f2. High off-diagonal values indicated that the power of one frequency fluctuated in tandem with another. In Figure 12, the frequencies that show coupling, and those that do not, are similar in both experiment and simulation. Our simulations suggest that this pattern would be expected to emerge from the relation of E2 generation of theta with I2 sculpting of gamma. E2 hubs produced augmented theta directly (Figure 4) and at the same time activated I cells that fired in the gamma range (Figure 8). The I cells, I2 in particular, then dampened activity but preferentially allowed gamma expression (Figure 7).
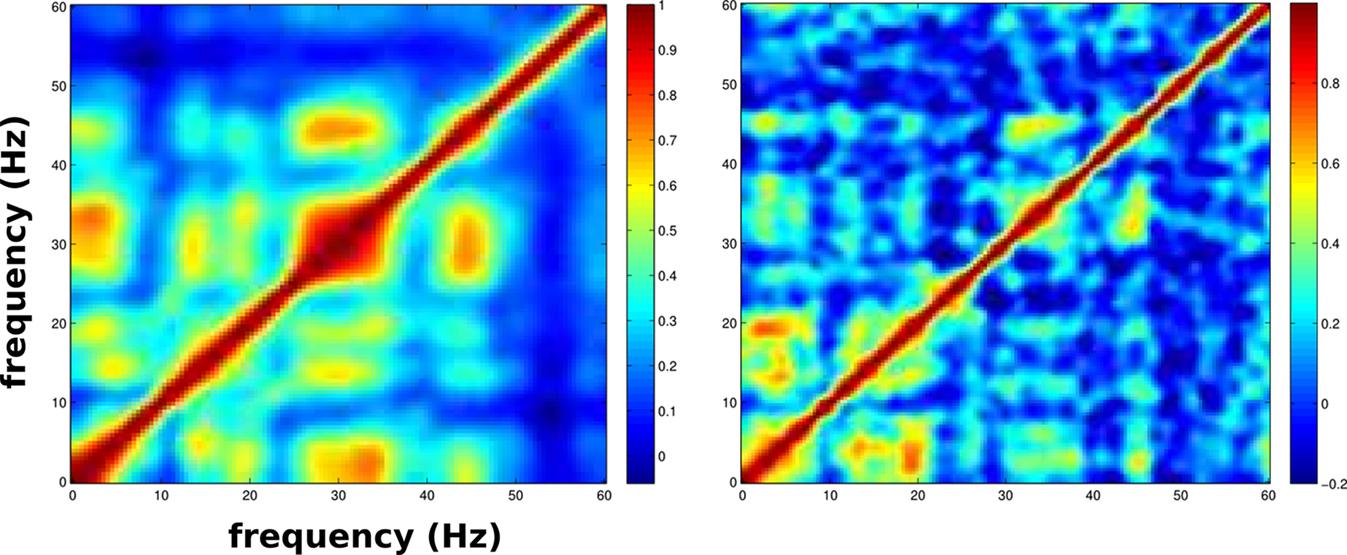
Figure 12. Comparison of power-fluctuation correlation matrices from LFP recorded in left medial prefrontal cortex of awake rat (left) to non-normalized E MUA from baseline simulation (right). Note that color scales are slightly different.
Discussion
We have demonstrated that a surprisingly realistic pattern of firing frequencies and frequency relationships (Figures 11 and 12) emerges from a relatively simple multicolumnar network: highly simplified cells subdivided into 13 cell populations organized using anatomically and physiologically determined intra- and intercolumnar projection densities (Figure 1). Function follows form insofar as layer 2/3, containing the largest subpopulations with the strongest projections, can be identified as a primary driver (for E cells) or sculptor (for I cells) of overall spectral patterns (Figures 4 and 7). Feed-forward inhibition between columns in the full multicolumn network reduces activity, but does not change the form of the spectrum (Figure 3). The network possesses internal homeostatic mechanisms: the spectral form remains intact when stressed by forcing the network with added activation (Figure 8) and altered synaptic delays (Figure 9). Finally, the network produces a set of intercolumnar correlation relationships that could provide the basis for the neocortical phase relations putatively used in cognitive binding (Figure 10).
We make a number of testable predictions from the model:
1 Layers of high recurrent connectivity and population density, E2/3 in our current networks, will play the role of a control layer. Such a layer will largely determine network dynamics, drive other layers, and set the spectral profile. We suggest that different Brodmann areas may have different dominant layers: some primarily supragranular as here, others infragranular. This would be testable by combinations of unit and field recording in different neocortical layers.
2 Hub cells will be present in these control layers. This increases the control layer’s synchronization of network dynamics. Experimentally, hub existence and prevalence would be testable with paired/multiple simultaneous single cell recording in slice. Further simulation would allow us to test hub influence using causal measures such as Granger causality and transfer entropy (Neymotin et al., 2011).
3 Frequency homeostasis: spectral profile is resilient to changes in network activation level as well as to variation in delay. Activation of cortex testable with modulating inputs indirectly in vivo using attention modulation behavioral experimental paradigms (Bollimunta et al., 2008). Delay alteration might be testable in vitro using temperature changes.
4 Fast-spiking interneurons enhance the proportion of gamma power by selectively dampening low-frequency activity. Testable using optogenetics to selectively alter firing rates of different interneuron classes (Cardin et al., 2009).
5 Excitatory populations produce low-frequency oscillations in vivo and drive interneuron production of gamma. The feedback between these populations allows for intrinsic network dynamics to create the commonly observed phase relationship of gamma and theta oscillations. Testable using optogenetics to selectively alter firing rates of different cell classes (Cardin et al., 2009).
Graphical Rendering of Neuronal Circuits and Dynamics
Neuronal circuits are extremely complex, and not well represented by simply categorizing as feed-forward or recurrent as done by artificial neural network theory (Lytton, 2002). Understanding of emergent dynamics will require multiple depictions of various aspects of cell typology, of wiring, and of dynamics at different scales. Graphical depiction techniques may be drawn from neuroanatomy, from graph theory, and from other domains. These are multiscale models, so that different depiction scales are necessary in order to make predictions at the various levels of organization (Sejnowski et al., 1988). In our explorations of circuitry, we found that a graph-theoretic schematic provided the best clues to the major dynamical features (Figures 1B,C), but necessarily obscured the underlying cortical structure that we depicted in Figure 1A. In our exploration of dynamics, we found that rasters, MUAs, sLFPs and correlation plots were all useful for seeing different scales and different aspects of the dynamics.
The graph-theoretic schematic that we used for anatomy provided visual indicators of population proportions (nodes) and of the strength and type of connections (edges). Network features that stood out in this depiction played an important role in shaping dynamics. Important aspects of neocortical architecture that were revealed included the centrality of layer 2/3 pyramidal cells, the descending excitatory pathway from layer 2/3 to 5, and negative feedback patterns featuring stronger I → E compared to E → I projections. Additional schematics (not shown) suggested a dominant lateral inhibitory effect between columns. The graph visualizations led us to our initial hypotheses and simulation experiments which focused on tests for the role of E2 and I2.
Similar graphical techniques may be particularly beneficial when detailed simulations are not feasible, and can help play a linkage role in the development of multiscale models. Working backward, it is also valuable to use these visualization techniques on experimental (or simulation) dynamical data to infer functional connectivity, as is routinely done for functional magnetic resonance imaging data. Assessing graphs of functional connectivity at different time-periods may also allow for measuring similarity of correlation structure across time in an intuitive manner.
Spectrum as an Emergent Property
We set up our network from what is known from neurophysiology and neuroanatomy. We then had to tune the network by adjusting weights in order to set approximate known firing rates of the cells in the different cell subpopulations. This tuning is typically required for simulations, in part because the numbers of cells and convergence of inputs are so much less than those found in the brain (Izhikevich and Edelman, 2008). Part of this tuning involves the provision of continuous ongoing random synaptic inputs (white-noise). These white-noise inputs are meant to very imperfectly represent the incoming activations and excitations from other parts of the brain, which may not have a white-noise spectral profile under more realistic conditions (Kerr et al., 2011).
Tuning our network required adjustment of local properties utilizing only global parameters: the strength of external excitation, and four tuning factors for weight of connection between excitatory and inhibitory populations: E → E, E → I, I → E and I → I connections. Cell properties themselves remained unchanged. The local property that was the main tuning target was firing rates for all cell types, keeping them within the bounds of propriety. Some further tuning was then done for a global property: weights were reduced in order to avoid any appearance of impropriety at the network level: hypersynchrony and epileptiform activity. After tuning based on these two criteria, physiologically realistic power spectra and cross-frequency coupling appeared as an emergent property through the cooperativity of the individual neuronal elements in the system. The general spectral form revealed was similar to that of rat brain in terms of both direct comparison (Figure 11) and frequency interrelationships (Figure 12). These results suggest that our model may have captured aspects of neocortical dynamics.
In order to evaluate how readily a comparable broad spectrum arose from other models, we surveyed several neocortical and thalamocortical models from the literature. Many papers, including those describing our prior models, do not show power spectra (Lytton and Omurtag, 2007; Lytton et al., 2008b; Neymotin et al., 2011). Generally this is because most models are focused on some particular phenomenon that does not require exploration of this facet of model behavior. Some others, that do concern themselves with frequencies, model the sleep state, or a slice, and produce spectra not similar to the whole-brain awake state. As an example, a neocortical slice simulation by Traub et al. models kainate-induced gamma oscillations and shows a single peak at 30 Hz (Figure 2 of Traub et al., 2005). However, this same paper has a model with a much broader spectrum (Figure 11A of Traub et al., 2005) that is comparable to in vivo activity. That spectrum has additional high-frequency peaks due to modeling of epileptiform activity. Another complex model is that of Izhikevich and Edelman(Izhikevich and Edelman, 2008). Although they do not show spectra, they noted that areas show local fast (40–50 Hz) traveling gamma rhythms, and note that other areas (of this very large whole-brain model) are dominated by 20 Hz beta. However, they state that the overall model was dominated by 1–3 Hz delta rhythms with intermixed alpha (Figure 5 of Izhikevich and Edelman, 2008), rhythms that, as they point out, do not typically co-occur at high power in vivo.
Most other neocortical models are far simpler than the two just described. Despite its simplicity, a model of mu (10 Hz motor) rhythm by Jones et al. shows a fairly realistic awake spectrum (Figure 7 of Jones et al., 2009). The absence here of high gamma frequencies is justified, since the experimental data being modeled also lacks activity in that band. Other simplified multineuronal models generally show tight frequency peaks. A generalized cortical network by Rulkov et al. shows a tight peak at 45–50 Hz (Figure 13 of Rulkov et al., 2004), as does a generalized network model by Brunel and Wang (Figures 1 and 6 of Brunel and Wang, 2003). A model by Karameh et al. has a more complex power spectrum, but still shows a relatively simple spectral structure with three separate peaks at 8, 15, and 24 Hz (Figure 11 of Karameh et al., 2006). By contrast, simplified “lumped” models, based on differential equations representing brain regions rather than individual brain cells, may readily demonstrate far more complex spectral fidelity (e.g., Figure 9 of von Albada et al., 2010).
From this brief survey, we conclude that simple models produce simple spectra, generally narrowly focused on a single frequency. Broad spectra are likely to emerge from complex multilayer networks. However, we note that different simulations produced different spectral patterns that sometimes involved physiologically disjoint frequencies or abrupt frequency cut-offs.
Assessing Causality in a Complex Dynamical System
In highly interconnected, high-dimensional dynamical systems, such as neuronal networks, bidirectional and nested loops are omnipresent, making it extremely difficult to ascertain which elements are causally responsible for each other’s activity pattern (Douglas and Martin, 2007b). Traditional methods for determining causality in non-linear dynamics, such as phase plane analysis, are not useful when applied directly to such high-dimensional networks, requiring an initial dimensional reduction which is of itself a major research project and which necessarily eliminates much of the dynamics. Other methods that have been developed to assess causality include transfer entropy (Schreiber, 2000; Gourevitch and Eggermont, 2007; Neymotin et al., 2011; Quinn et al., 2011), Granger causality (Roebroeck et al., 2005; Chen et al., 2006; Seth, 2008), Bayesian dynamical modeling (Baldi et al., 1998; Rajapakse and Zhou, 2007; Eldawlatly et al., 2008), and combinations of modeling and optimization (Makarov et al., 2005). Although these methods are useful in many scenarios, a unique benefit of simulation is that it allows the experimenter to have full control of the system. This allows the use of a more direct method to ascertain dynamic causality, by performing perturbations to a system and observing the effects (Paus, 2005; Chen et al., 2008; Daunizeau et al., 2009). However, a caveat is in order. If the perturbation is too drastic, then one is likely to enter a new dynamical regime rather than accurately probing the dynamics of the current regime. An example of an overly drastic intervention would be any perturbation producing a parameter change that crosses a bifurcation boundary, since this will create a new dynamical pattern that was not there before.
One of the most extreme, yet most commonly used, such perturbations is the ablation experiment. In this type of experiment, one proceeds around the system removing one component at a time until some oscillation or activity pattern of interest, pattern A, disappears. Let’s say that removal of component Q abolishes pattern A. One then declares victory: component Q is the producer, cause, or primary driver of pattern A. However, what if the remaining network, network minus Q, has moved into an entirely different pattern, pattern B? Should we now define component Q as driver of pattern A, or as suppressor of pattern B? An anecdote from the era of vacuum tubes bears repeating. Removing a particular vacuum tube from the radio “motherboard” would transform the white-noise static of the untuned radio to a high amplitude, narrow-band signal (a howl). That evidence did not justify calling the particular tube the “static-generator unit,” nor the “howl-suppressor unit.”
To evaluate dynamics, we avoided drastic network changes by using only minimal dynamical perturbation as a methodology. We chose hub formation as a subtle perturbation that could be applied gradually to the system, starting at a low level which would have no detectable effect. Gradual addition of hubs could then be done without changing the number of elements or changing the total number of connections, thereby maintaining the basic structural attributes of the system. With addition of hubs, the influence of the hubbed subpopulation gradually increased as activity spread more effectively. For example, addition of hubs in the E2 subpopulation had no observable effect until a threshold was reached at about five hubs (3.3% of population). Above this point, the addition of additional hubs progressively augmented power in all bands tested (Figure 4). Note that though the number of hubs were changed identically in all subpopulations, the proportion of hubs at any given number was lowest in the case of E2 due to the larger size of this subpopulation. In our inhibitory subpopulation experiments, the addition of even one hub produced alterations in power, suggesting that we should have set our hub’s convergence and divergence level smaller in order to get less effect with one hub. Despite this, we were able to demonstrate a clear distinction between hub addition in the I2 subpopulation and hub addition in the other inhibitory subpopulations (Figure 7).
Experimental Evidence for Hubs in the Brain
Graph-theoretic hubs have been implicated in the spread of epidemics, synchronization, and enhanced communication in complex networks across a wide variety of fields and spatiotemporal scales (Strogatz, 2001; Wang and Chen, 2003). Examination of the connectivity distribution of a nematode’s neurons revealed that it obeyed a power-law distribution with rarely occurring, but highly connected hub cells present (Barabási and Albert, 1999; Strogatz, 2001). The role of hubs in synchronizing neuronal network activity was shown in a series of experimental and simulation studies of dentate gyrus (Dyhrfjeld-Johnsen et al., 2007; Morgan and Soltesz, 2008). In these studies, it was shown that granule cell hubs played a contributing role in epileptogenesis even when only a few hub cells were added. This is similar to the higher frequency of population spikes observed in our model when several E2 hub cells were present. These studies also showed that efficacious hubs had increases in both incoming and outgoing connections: hubs with only increased incoming connections produced much less hyperexcitability, while hubs with only increased outgoing connections produced no hyperexcitability. The existence of these hubs was explained by noting that some few cells had both large dendritic and large axonal arborizations.
Recent experimental work demonstrated that in neocortical networks, layer 5 pyramidal neurons showed non-random connectivity suggestive of hubs: a low probability of high-connection strength between pairs of neurons (Song et al., 2005). This study found a large asymmetry in the strength of synapses: 17% of the synaptic connections were shown to contribute half of the total synaptic strength, suggesting that some neurons may be significantly more effective in causing cells to fire than others. In addition, there was a correlation between the strength of incoming and outgoing connections. From these observations, the authors suggested the existence of pyramidal hub neurons in the neocortex.
Interneuron hubs have been demonstrated in developing hippocampus (Bonifazi et al., 2009). Functional and effective connectivity analysis was performed and revealed a power-law distribution. The hubs were found to have much larger axonal arborizations than the average cell in the network, accounting for large divergence. Dynamically, the hubs were able to synchronize network activity, either when stimulated or spontaneously, producing population spikes. Similarly, we observed the synchronizing effects of hubs in our simulations.
At the larger spatial scale of networks of brain regions, hubs have been found to play an important role in functional integration (Hagmann et al., 2008). Analysis of networks of brain areas with diffusion-weighted MRI also revealed the presence of hubs (Iturria-Medina et al., 2008). Other recent work in fMRI-based functional networks has demonstrated the presence of hubs in regions of unimodal or multimodal association cortex, suggesting these types of hubs can integrate different forms of information effectively (Achard and Bullmore, 2007).
The Centrality of Layer 2/3 in this Network
In our simulations, the E2 subpopulation, the excitatory cells in layer 2/3, appeared to provide a primary oscillatory drive to the network, particularly in the theta/alpha band. In addition, E2 appeared to strongly drive the I2 cells to produce gamma, sculpted out of the network through differential damping. E2 hubs were able to synchronize the intracolumnar activity via the mechanism of positive feedback between convergent and divergent cells. Activity spread first within, and then between columns. Our simulations comparing unconnected and connected columns demonstrated that columns may communicate by modulating the excitation within their neighboring columns via feed-forward activation of both E and I cells.
Layer 2/3 is implicated in the generation of theta oscillations in entorhinal cortex (Ylinen et al., 1995; Sirota and Buzsaki, 2005), and motor cortex (Weiler et al., 2008). Additionally, layer 2/3 has been suggested to be a major driver and determinant of activity in a number of studies of sensory cortex (Fransen and Lansner, 1998; Lundqvist et al., 2010). By contrast, a classical physiological study, Silva et al., does not support this model (Silva et al., 1991). This in vitro study evaluated smaller and smaller fragments of sensorimotor neocortical slice and found that only layer 5 could produce activity in isolation. Clearly, this is a form of the type of ablation experiment criticized above. Additionally, slicing will injure cells, and injured cells may be prone to hyperexcitability.
However, rather than describe this as an either/or situation, we would note that there are considerable anatomical differences across cortical regions, as originally described by Brodmann. These feature different thicknesses of layers, numbers of cells in each subpopulation, and apparently different connectivity densities. These anatomical differences are likely to be associated with dynamical differences, including alterations in spectral profile. Additionally, there is physiological evidence to suggest that the direction of driving differs from one area to another. In the awake, behaving animal study of Bollimunta et al. (2008), Granger causality inferred infragranular (layer 5/6) to supragranular (layer 2/3) driving in sensory areas (V2, V4), but supragranular to infragranular driving in area IT (inferotemporal cortex). This suggested the possibility of dynamical differences between lower-level sensory areas (V2, V4) and higher cortical association areas (IT). Based on this distinction, we would propose our model as a model for higher centers. We will then need to produce variant models for primary sensory cortex, and for motor cortex. As with most areas of biology, there will be no single cortical model (hence, alas, no direct model falsification) but rather complex multiscale combinations of model variants.
Network Stabilization: Frequency Homeostasis
Homeostasis, the maintenance of stability under varying environmental conditions, is a feature of any biological system. In the brain, one form of homeostasis entails maintenance of baseline activity patterns across varying levels of inputs and neuromodulators, avoiding seizures despite maintenance of the high levels of correlation needed for intracortical communication. We call this frequency homeostasis, the maintenance of the correct spectrum of frequencies and frequency interrelationships despite alternation of drive. This has been demonstrated physiologically (Bollimunta et al., 2008; Rajagovindan and Ding, 2011). In our simulations, we saw that adding power to the primary driving center, layer 2/3, a major perturbation that produced increased frequencies in most cell groups, caused the alpha/theta peak to grow but not shift substantially (Figure 8). This pattern of added driving might be produced in vivo by attentional focus provided through strong feedback from higher cortical centers to a lower center, an influence that arrives primarily in supragranular layers (Quilodran et al., 2008). We hypothesize that this homeostatic effect in the simulation would be provided by a balance between I cell domination of the high-end of the spectrum and E cell domination of the low-end of the spectrum. The increased high-band inhibition counteracted the tendency of the existing peak to start spilling over into higher frequency bands, preserving the overall shape of the spectral power profile. An additional homeostatic mechanism was shown with the preservation of population frequencies despite alterations in the delays between neurons (Figure 9).
The beginning of a failure of homeostasis is shown in Figures 5 and 6 – the occurrence of population spikes, harbinger of seizure activity. Notably, the strong feed-forward inhibition between columns served to reduce the number of population spikes considerably, partly suppressing population spikes and restoring something of a normal appearance to the sLFPs (Figure 6). Additional homeostatic processes remain to be explored and explained. For example, we expect that the spectral relationship shown in Figure 12 will also be resistant to increased activation. It will also be important to check the effects of activation by way of other pathways, most notably via sensory activation through layer 4.
Cognitive Implications
Brains receive information from different sensory modalities as well as internal sources and integrate them into coherent representations (Treisman, 1996). One hypothesis for how the brain solves this problem is via the synchronized activation of distributed neuronal ensembles (von der Malsburg and Schneider, 1986; Engel and Singer, 2001; Singer, 2001; Wu et al., 2007). Additionally, synchronization across brain areas has been suggested as a prerequisite for optimal information transfer between them (Buehlmann and Deco, 2010). Oscillations have been suggested as a mechanism for fine temporal tuning of neural firing times which could provide coding and learning via spike timing (Canolty et al., 2006; Fries et al., 2007; Clopath et al., 2010). Specifically, gamma and theta oscillations have been suggested as partners in a multiplexing mechanism via subsets of cells that fire on a particular gamma subcycle superimposed on a theta cycle (Lisman and Idiart, 1995). Human neocortical theta has also been implicated in working memory tasks (Raghavachari et al., 2001; Jensen and Tesche, 2002). Co-occurrence of theta and gamma, demonstrated in the present study in both experiment and simulation (Figure 12), would provide a substrate for these types of mechanisms.
While fairly high levels of synchronization are required for cognition, pathological increase in synchronization may lead to seizures (Osterhage et al., 2007; Schindler et al., 2007; Lytton, 2008; Lehnertz et al., 2009; Neymotin et al., 2010). This suggests a tradeoff: synchronization between components is required for information processing, but too much leads to pathology. Frequency homeostasis might then be important to maintain conditions required for a cognition that relies on tuned brain oscillations (von der Malsburg and Schneider, 1986; Gray and Singer, 1989; von der Malsburg, 1995; Kopell et al., 2000; Spencer et al., 2003; Buzsaki and Draguhn, 2004; Uhlhaas et al., 2006).
In our model, E2 cells had the strongest recurrent connectivity and had excitatory projections laterally via E5, as well as strong lateral inhibitory projections. We therefore hypothesize that layer 2/3, together with layer 5, will be primarily responsible for the intercolumnar coordination we demonstrate in Figure 10. When we added hubs to E2, we produced population spikes in the isolated columns, an epileptiform indicator (Figure 5). These hubs were strongly suppressed by lateral inhibition in the connected network but were still apparent (Figure 6). The enhanced synchrony due to hubs also increased correlation across columns, possibly allowing for enhanced information transfer, but equally possibly associated with excessive coordination that would actually reduce information transfer (Olypher et al., 2006).
Our simulations modeled both the generation and the coupling of oscillations in the theta and gamma bands, and also suggest a possible mechanism for this coupling. Theta oscillations emerged primarily from E cell activity. This activity then provided drive to the interneurons, which then produced gamma oscillations. Feedback of this activity onto E cells then sends a gamma timing signal into the E population. Interestingly our columnar sLFPs showed fluctuations of synchrony. We hypothesize that states of low intercolumnar synchrony may be characterized by intracolumnar computation, and states of high intercolumnar synchrony may be periods when the columns communicate. We speculate that synchrony fluctuation may allow for isolating periods of local and global coordination.
Conflict of Interest Statement
The authors declare that the research was conducted in the absence of any commercial or financial relationships that could be construed as a potential conflict of interest.
Acknowledgments
Supported by: DARPA grant N66001-10-C-2008, National Institute of Mental Health (R01MH084038); National Institute of Neurological Disorders and Stroke (R42NS064474). The authors would like to thank the reviewers for their insightful comments and for help in improving the manuscript, Mingzhou Ding, Gordon M. G. Shepherd, Ben Suter, Kimberle Jacobs for assistance with the neocortical model, Ahmet Omurtag for discussions on data analysis, Larry Eberle for computer support and administration, and Cliff Kerr for helpful comments on the manuscript.
References
Achard, S., and Bullmore, E. (2007). Efficiency and cost of economical brain functional networks. PLoS Comput. Biol. 3, e17. doi: 10.1371/journal.pcbi.0030017
Adesnik, H., and Scanziani, M. (2010). Lateral competition for cortical space by layer-specific horizontal circuits. Nature 464, 1155–1160.
Anderson, C. T., Sheets, P. L., Kiritani, T., and Shepherd, G. M. G. (2010). Sublayer-specific microcircuits of corticospinal and corticostriatal neurons in motor cortex. Nat. Neurosci. 13, 739–744.
Baldi, P., Vanier, M. C., and Bower, J. M. (1998). On the use of bayesian methods for evaluating compartmental neural models. J. Comput. Neurosci. 5, 285–314.
Barabási, A. L., and Albert, R. (1999). Emergence of scaling in random networks. Science 286, 509–512.
Bartos, M., Vida, I., and Jonas, P. (2007). Synaptic mechanisms of synchronized gamma oscillations in inhibitory interneuron networks. Nat. Rev. Neurosci. 8, 45–56.
Bazhenov, M., Timofeev, I., Steriade, M., and Sejnowski, T. J. (2002). Model of thalamocortical slow-wave sleep oscillations and transitions to activated states. J. Neurosci. 22, 8691–8704.
Binzegger, T., Douglas, R. J., and Martin, K. A. (2004). A quantitative map of the circuit of cat primary visual cortex. J. Neurosci. 24, 8441–8453.
Bollimunta, A., Chen, Y., Schroeder, C. E., and Ding, M. (2008). Neuronal mechanisms of cortical alpha oscillations in awake-behaving macaques. J. Neurosci. 28, 9976–9988.
Bonifazi, P., Goldin, M., Picardo, M. A., Jorquera, I., Cattani, A., Bianconi, G., Represa, A., Ben-Ari, Y., and Cossart, R. (2009). GABAergic hub neurons orchestrate synchrony in developing hippocampal networks. Science 326, 1419–1424.
Brown, S. P., and Hestrin, S. (2009). Intracortical circuits of pyramidal neurons reflect their long-range axonal targets. Nature 457, 1133–1136.
Brunel, N., and Wang, X. J. (2003). What determines the frequency of fast network oscillations with irregular neural discharges? I. Synaptic dynamics and excitation-inhibition balance. J. Neurophysiol. 90, 415–430.
Buehlmann, A., and Deco, G. (2010). Optimal information transfer in the cortex through synchronization. PLoS Comput. Biol. 6, 334–337. doi: 10.1371/journal.pcbi.1000934
Buxhoeveden, D. P., and Casanova, M. F. (2002). The minicolumn hypothesis in neuroscience. Brain 125, 935–951.
Buzsaki, G., and Draguhn, A. (2004). Neuronal oscillations in cortical networks. Science 304, 1926–1929.
Canolty, R. T., Edwards, E., Dalal, S. S., Soltani, M., Nagarajan, S. S., Kirsch, H. E., Berger, M. S., Barbaro, N. M., and Knight, R. T. (2006). High gamma power is phase-locked to theta oscillations in human neocortex. Science 313, 1626–1628.
Cardin, J. A., Carlén, M., Meletis, K., Knoblich, U., Zhang, F., Deisseroth, K., Tsai, L. H., and Moore, C. I. (2009). Driving fast-spiking cells induces gamma rhythm and controls sensory responses. Nature 459, 663–667.
Chen, C. C., Kiebel, S. J., and Friston, K. J. (2008). Dynamic causal modelling of induced responses. Neuroimage 41, 1293–1312.
Chen, Y., Bressler, S. L., Knuth, K. H., Truccolo, W. A., and Ding, M. (2006). Stochastic modeling of neurobiological time series: power, coherence, Granger causality, and separation of evoked responses from ongoing activity. Chaos 16, 026113.
Clopath, C., Büsing, L., Vasilaki, E., and Gerstner, W. (2010). Connectivity reflects coding: a model of voltage-based STDP with homeostasis. Nat. Neurosci. 13, 344–352.
Costa, N. M., and Martin, K. A. (2010). Whose cortical column would that be. Front. Neuroanat. 4:16. doi: 10.3389/fnana.2010.00016
Cutsuridis, V., and Hasselmo, M. (2010). “Dynamics and function of a CA1 model of the hippocampus during theta and ripples,” in Artificial Neural Networks–ICANN 2010, Thessaloniki, 230–240.
Daunizeau, J., David, O., and Stephan, K. E. (2009). Dynamic causal modelling: a critical review of the biophysical and statistical foundations. Neuroimage. doi: 10.1016/j.neuroimage.2009.11.062
Douglas, R. J., and Martin, K. A. (2007a). Mapping the matrix: the ways of neocortex. Neuron 56, 226–238.
Douglas, R. J., and Martin, K. A. C. (2007b). Recurrent neuronal circuits in the neocortex. Curr. Biol. 17, 496.
Douglas, R. J., and Martin, K. A. C. (2004). Neuronal circuits of the neocortex. Annu. Rev. Neurosci. 27, 419–451.
Douglas, R. J., Martin, K. A. C., and Whitteridge, D. (1989). A canonical microcircuit for neocortex. Neural. Comput. 1, 480–488.
Düzel, E., Penny, W. D., and Burgess, N. (2010). Brain oscillations and memory. Curr. Opin. Neurobiol. 20, 143–149.
Dyhrfjeld-Johnsen, J., Santhakumar, V., Morgan, R. J., Huerta, R., Tsimring, L., and Soltesz, I. (2007). Topological determinants of epileptogenesis in large-scale structural and functional models of the dentate gyrus derived from experimental data. J. Neurophysiol. 97, 1566–1587.
Eldawlatly, S., Zhou, Y., Jin, R., and Oweiss, K. (2008). “Reconstructing functional neuronal circuits using dynamic bayesian networks,” in Engineering in Medicine and Biology Society, 2008. EMBS 2008. 30th Annual International Conference of the IEEE, Vancouver, 5531–5534.
Engel, A., Konig, P., Kreiter, A., Gray, C., and Singer, W. (1991). “Temporal coding by coherent oscillations as a potential solution to the binding problem: physiological evidence,” in Nonlinear Dynamics and Neural Networks, ed. H. G. Schuster (VCH Verlagsgesellschaft, Weinheim), 149–163.
Engel, A. K., and Singer, W. (2001). Temporal binding and the neural correlates of sensory awareness. Trends Cogn. Sci. (Regul. Ed.) 5, 16–25.
Fenton, A. A., Lytton, W. W., Barry, J. M., Lenck-Santini, P. P., Zinyuk, L. E., Kubík, S., Bures, J., Poucet, B., Muller, R. U., and Olypher, A. V. (2010). Attention-like modulation of hippocampus place cell discharge. J. Neurosci. 30, 4613–4625.
Fransen, E., and Lansner, A. (1998). A model of cortical associative memory based on a horizontal network of connected columns. Network 9, 235–264.
Gansner, E. R., and North, S. C. (2000). An open graph visualization system and its applications to software engineering. Softw. Pract. Exp. 30, 1203–1233.
Gourevitch, B., and Eggermont, J. J. (2007). Evaluating information transfer between auditory cortical neurons. J. Neurophysiol. 97, 2533–2543.
Gray, C., and Singer, W. (1989). Stimulus-specific neuronal oscillations in orientation columns of cat visual cortex. Proc. Natl. Acad. Sci. U.S.A. 86, 1698–1702.
Groh, A., Meyer, H. S., Schmidt, E. F., Heintz, N., Sakmann, B., and Krieger, P. (2010). Cell-type specific properties of pyramidal neurons in neocortex underlying a layout that is modifiable depending on the cortical area. Cereb. Cortex 20, 826–836.
Hagmann, P., Cammoun, L., Gigandet, X., Meuli, R., Honey, C. J., Wedeen, V. J., and Sporns, O. (2008). Mapping the structural core of human cerebral cortex. PLoS Biol. 6, e159. doi: 10.1371/journal.pbio.0060159
Hasselmo, M. E. (2006). The role of acetylcholine in learning and memory. Curr. Opin. Neurobiol. 16, 710–715.
Heinzle, J., Hepp, K., and Martin, K. A. (2007). A microcircuit model of the frontal eye fields. J. Neurosci. 27, 9341–9353.
Hill, S., and Tononi, G. (2005). Modeling sleep and wakefulness in the thalamocortical system. J. Neurophysiol. 93, 1671–1698.
Hines, M. L., and Carnevale, N. T. (2001). NEURON: a tool for neuroscientists. Neuroscientist 7, 123–135.
Iturria-Medina, Y., Sotero, R. C., Canales-Rodriguez, E. J., Aleman-Gomez, Y., and Melie-Garcia, L. (2008). Studying the human brain anatomical network via diffusion-weighted mri and graph theory. Neuroimage 40, 1064–1076.
Izhikevich, E. M., and Edelman, G. M. (2008). Large-scale model of mammalian thalamocortical systems. Proc. Natl. Acad. Sci. U.S.A. 105, 3593–3598.
Jahr, C. E., and Stevens, C. F. (1990a). Voltage dependence of NMDA-activated macroscopic conductances predicted by single-channel kinetics. J. Neurosci. 10, 3178–3182.
Jahr, C. E., and Stevens, C. F. (1990b). A quantitative description of NMDA receptor-channel kinetic behavior. J. Neurosci. 10, 1830.
Jensen, O., and Tesche, C. D. (2002). Frontal theta activity in humans increases with memory load in a working memory task. Eur. J. Neurosci. 15, 1395–1399.
Jones, S. R., Pritchett, D. L., Sikora, M. A., Stufflebeam, S. M., Hamalainen, M., and Moore, C. I. (2009). Quantitative analysis and biophysically realistic neural modeling of the MEG mu rhythm: rhythmogenesis and modulation of sensory-evoked responses. J. Neurophysiol. 102, 3554–3572.
Karameh, F. N., Dahleh, M. A., Brown, E. N., and Massaquoi, S. G. (2006). Modeling the contribution of lamina 5 neuronal and network dynamics to low frequency EEG phenomena. Biol. Cybern. 95, 289–310.
Kelemen, E., and Fenton, A. A. (2010). Dynamic grouping of hippocampal neural activity during cognitive control of two spatial frames. PLoS Biol. 8, e1000403. doi: 10.1371/journal.pbio.1000403
Kerr, C. C., Neymotin, S. A., Chadderdon, G. L., Fietkiewicz, C. T., Francis, J. T., and Lytton, W. W. (2011). “Electrostimulation as a prosthesis for repair of information flow in a computer model of neocortex,” Submitted to IEEE Transactions on Neural Systems and Rehabilitation Engineering, Submitted March 28, Sydney.
Kopell, N., Ermentrout, G. B., Whittington, M. A., and Traub, R. D. (2000). Gamma rhythms and beta rhythms have different synchronization properties. Proc. Natl. Acad. Sci. U.S.A. 97, 1867–1872.
Lefort, S., Tomm, C., Floyd-Sarria, J. C., and Petersen, C. C. (2009). The excitatory neuronal network of the C2 barrel column in mouse primary somatosensory cortex. Neuron 61, 301–316.
Lehnertz, K., Bialonski, S., Horstmann, M. T., Krug, D., Rothkegel, A., Staniek, M., and Wagner, T. (2009). Synchronization phenomena in human epileptic brain networks. J. Neurosci. Methods 183, 42–48.
Lisman, J. (2010). Working memory: the importance of theta and gamma oscillations. Curr. Biol. 20, R490–R492.
Lisman, J. E., and Idiart, M. A. P. (1995). Storage of 7 ± 2 short-term memories in oscillatory subcycles. Science 267, 1512–1515.
Lundqvist, M., Compte, A., and Lansner, A. (2010). Bistable, irregular firing and population oscillations in a modular attractor memory network. PLoS Comput. Biol. 6, e1000803. doi: 10.1371/journal.pcbi.1000803
Lytton, W. W. (1996). Optimizing synaptic conductance calculation for network simulations. Neural. Comput. 8, 501–509.
Lytton, W. W. (2006). Neural query system: data-mining from within the NEURON simulator. Neuroinformatics 4, 163–176.
Lytton, W. W., and Omurtag, A. (2007). Tonic-clonic transitions in computer simulation. J. Clin. Neurophysiol. 24, 175–181.
Lytton, W. W., Omurtag, A., Neymotin, S. A., and Hines, M. L. (2008a). Just-in-time connectivity for large spiking networks. Neural. Comput. 20, 2745–2756.
Lytton, W. W., Neymotin, S. A., and Hines, M. L. (2008b). The virtual slice setup. J. Neurosci. Methods 171, 309–315.
Lytton, W. W., and Sejnowski, T. J. (1991). Simulations of cortical pyramidal neurons synchronized by inhibitory interneurons. J. Neurophysiol. 66, 1059–1079.
Lytton, W. W., and Stewart, M. (2005). A rule-based firing model for neural networks. Int. J. Bioelectromagn. 7, 47–50.
Lytton, W. W., and Stewart, M. (2006). Rule-based firing for network simulations. Neurocomputing 69, 1160–1164.
Lytton, W. W., and Stewart, M. (2007). Data mining through simulation. Methods Mol. Biol. 401, 155–166.
Makarov, V. A., Panetsos, F., and Feo, O. (2005). A method for determining neural connectivity and inferring the underlying network dynamics using extracellular spike recordings. J. Neurosci. Methods 144, 265–279.
Markram, H., Toledo-Rodriguez, M., Wang, Y., Gupta, A., Silberberg, G., and Wu, C. (2004). Interneurons of the neocortical inhibitory system. Nat. Rev. Neurosci. 5, 793–807.
Morgan, R. J., and Soltesz, I. (2008). Nonrandom connectivity of the epileptic dentate gyrus predicts a major role for neuronal hubs in seizures. Proc. Natl. Acad. Sci. U.S.A. 105, 6179–6184.
Neymotin, S., Uhlrich, D. J., Manning, K. A., and Lytton, W. W. (2008). Data mining of time-domain features from neural extracellular field data. Comput. Intell. Biomed. Bioinforma. 151, 119–140.
Neymotin, S. A., Jacobs, K. M., Fenton, A. A., and Lytton, W. W. (2011). Synaptic information transfer in computer models of neocortical columns. J. Comput. Neurosci. 30, 69–84.
Neymotin, S. A., Lee, H., Fenton, A. A., and Lytton, W. W. (2010). Interictal EEG discoordination in a rat seizure model. J. Clin. Neurophysiol. 27, 438–444.
Olypher, A. V., Klement, D., and Fenton, A. A. (2006). Cognitive disorganization in hippocampus: a physiological model of the disorganization in psychosis. J. Neurosci. 26, 158–168.
Orman, R., Von, Gizycki, H., Lytton, W. W., and Stewart, M. (2008). Local axon collaterals of area CA1 support spread of epileptiform discharges within CA1, but propagation is unidirectional. Hippocampus 18, 1021–1033.
Osterhage, H., Mormann, F., Staniek, M., and Lehnertz, K. (2007). Measuring synchronization in the epileptic brain: a comparison of different approaches. Int. J. Bifurcat. Chaos 17, 3539.
Palva, J. M., Palva, S., and Kaila, K. (2005). Phase synchrony among neuronal oscillations in the human cortex. J. Neurosci. 25, 3962–3972.
Paus, T. (2005). Inferring causality in brain images: a perturbation approach. Philos. Trans. R. Soc. Lond. B Biol. Sci. 360, 1109–1114.
Petersen, C. C. H., and Sakmann, B. (2001). Functionally independent columns of rat somatosensory barrel cortex revealed with voltage-sensitive dye imaging. J. Neurosci. 21, 8435–8446.
Quilodran, R., Gariel, M. A., Markov, N. T., Falchier, A., Vezoli, J., Sallet, J., Anderson, J. C., Dehay, C., Douglas, R. J., Martin, K. A. C., Barone, P., Knoblauch, K., and Kennedy, H. (2008). Strong loops in the neocortex. Soc. Neurosci. Abstr. 853.4.
Quinn, C., Coleman, T. P., Kiyavash, N., and Hatsopoulos, N. G. (2011). Estimating the directed information to infer causal relationships in ensemble neural spike train recordings. J. Comput. Neurosci. 30, 17–44.
Raghavachari, S., Kahana, M. J., Rizzuto, D. S., Caplan, J. B., Kirschen, M. P., Bourgeois, B., Madsen, J. R., and Lisman, J. E. (2001). Gating of human theta oscillations by a working memory task. J. Neurosci. 21, 3175–3183.
Raghavachari, S., Lisman, J. E., Tully, M., Madsen, J. R., Bromfield, E. B., and Kahana, M. J. (2006). Theta oscillations in human cortex during a working-memory task: evidence for local generators. J. Neurophysiol. 95, 1630–1638.
Rajagovindan, R., and Ding, M. (2011). From prestimulus alpha oscillation to visual-evoked response: an inverted-U function and its attentional modulation. J. Cogn. Neurosci. 23, 1379–1394.
Rajapakse, J. C., and Zhou, J. (2007). Learning effective brain connectivity with dynamic bayesian networks. Neuroimage 37, 749–760.
Rockland, K. S., and Ichinohe, N. (2004). Some thoughts on cortical minicolumns. Exp. Brain Res. 158, 265–277.
Roebroeck, A., Formisano, E., and Goebel, R. (2005). Mapping directed influence over the brain using granger causality and fMRI. Neuroimage 25, 230–242.
Rulkov, N. F., Timofeev, I., and Bazhenov, M. (2004). Oscillations in large-scale cortical networks: map-based model. J. Comput. Neurosci. 17, 203–223.
Schindler, K., Leung, H., Elger, C. E., and Lehnertz, K. (2007). Assessing seizure dynamics by analysing the correlation structure of multichannel intracranial EEG. Brain 130, 65.
Sejnowski, T. J., Koch, C., and Churchland, P. S. (1988). Computational neuroscience. Science 241, 1299–1306.
Shinomoto, S., Miyazaki, Y., Tamura, H., and Fujita, I. (2005). Regional and laminar differences in in vivo firing patterns of primate cortical neurons. J. Neurophysiol. 94, 567–575.
Silva, L. R., Amitai, Y., and Connors, B. W. (1991). Intrinsic oscillations of neocortex generated by layer 5 pyramidal neurons. Science 251, 432–435.
Singer, W. (2001). Consciousness and the binding problem. Cajal and consciousness: scientific approaches to consciousness on the centennial of Ramon y Cajal’s textura. Ann. N. Y. Acad. Sci. 929, 123–146.
Sirota, A., and Buzsaki, G. (2005). Interaction between neocortical and hippocampal networks via slow oscillations. Thalamus Relat. Syst. 3, 245–259.
Sirota, A., Montgomery, S., Fujisawa, S., Isomura, Y., Zugaro, M., and Buzsáki, G. (2008). Entrainment of neocortical neurons and gamma oscillations by the hippocampal theta rhythm. Neuron 60, 683–697.
Six, J., and Tollis, I. (1999a). Circular drawings of biconnected graphs. Algorithm Eng. Exp. 1619, 662.
Six, J., and Tollis, I. (1999b). “A framework for circular drawings of networks,” in Graph Drawing (Berlin: Springer-Verlag), 1731, 107–116.
Sohal, V. S., Zhang, F., Yizhar, O., and Deisseroth, K. (2009). Parvalbumin neurons and gamma rhythms enhance cortical circuit performance. Nature 459, 698–702.
Song, S., Sjostrom, P. J., Reigl, M., Nelson, S., and Chklovskii, D. B. (2005). Highly nonrandom features of synaptic connectivity in local cortical circuits. PLoS Biol. 3, e68. doi: 10.1371/journal.pbio.0030068
Spencer, K. M., Nestor, P. G., Niznikiewicz, M. A., Salisbury, D. F., Shenton, M. E., and Carley, R. W. (2003). Abnormal neural synchrony in schizophrenia. J. Neurosci. 23, 7407–7411.
Spencer, K. M., Nestor, P. G., Perlmutter, R., Niznikiewicz, M. A., Klump, M. C., Frumin, M., Shenton, M. E., and Carley, R. W. (2004). Neural synchrony indexes disordered perception and cognition in schizophrenia. Proc. Natl. Acad. Sci. U.S.A. 101, 17288–17293.
Sporns, O., Tononi, G., and Kotter, R. (2005). The human connectome: a structural description of the human brain. PLoS Comput. Biol. 1, e42. doi: 10.1371/journal.pcbi.0010042
Steriade, M. (2004). Neocortical cell classes are flexible entities. Nat. Rev. Neurosci. 5, 121–134.
Stewart, M., and Fox, S. E. (1990). Do septal neurons pace the hippocampal theta rhythm. Trends Neurosci. 13, 163–168.
Tamás, G., Buhl, E. H., Lörincz, A., and Somogyi, P. (2000). Proximally targeted GABAergic synapses and gap junctions synchronize cortical interneurons. Nat. Neurosci. 3, 366–371.
Thomson, A. M., and Bannister, A. P. (2003). Interlaminar connections in the neocortex. Cereb. Cortex 13, 5–14.
Thomson, A. M., and Lamy, C. (2007). Functional maps of neocortical local circuitry. Front. Neurosci. 1:19. doi: 10.3389.neuro.01/1.1.002.2007
Thomson, A. M., West, D. C., Wang, Y., and Bannister, A. P. (2002). Synaptic connections and small circuits involving excitatory and inhibitory neurons in layers 2-5 of adult rat and cat neocortex: triple intracellular recordings and biocytin labelling in vitro. Cereb. Cortex 12, 936–953.
Traub, R. D., Contreras, D., Cunningham, M. O., Murray, H., Le Beau, F. E. N., Roopun, A., Bibbig, A., Wilent, W. B., Higley, M. J., and Whittington, M. A. (2005). Single-column thalamocortical network model exhibiting gamma oscillations, sleep spindles, and epileptogenic bursts. J. Neurophysiol. 93, 2194–2232.
Traub, R. D., Whittington, M. A., Colling, S. B., Buzsaki, G., and Jefferys, J. G. (1996). Analysis of gamma rhythms in the rat hippocampus in vitro and in vivo. J. Physiol. (Lond.) 493(Pt 2), 471–484.
Tsujimoto, T., Shimazu, H., and Isomura, Y. (2006). Direct recording of theta oscillations in primate prefrontal and anterior cingulate cortices. J. Neurophysiol. 95, 2987–3000.
Tukker, J. J., Fuentealba, P., Hartwich, K., Somogyi, P., and Klausberger, T. (2007). Cell type-specific tuning of hippocampal interneuron firing during gamma oscillations in vivo. J. Neurosci. 27, 8184–8189.
Uhlhaas, P. J., Linden, D. E., Singer, W., Haenschel, C., Lindner, M., Maurer, K., and Rodriguez, E. (2006). Dysfunctional long-range coordination of neural activity during gestalt perception in schizophrenia. J. Neurosci. 26, 8168–8175.
Uhlhaas, P. J., and Singer, W. (2006). Neural synchrony in brain disorders: relevance for cognitive dysfunctions and pathophysiology. Neuron 52, 155–168.
von Albada, S. J., Kerr, C. C., Chiang, A. K., Rennie, C. J., and Robinson, P. A. (2010). Neurophysiological changes with age probed by inverse modeling of EEG spectra. Clin. Neurophysiol. 121, 21–38.
von der Malsburg, C., and Schneider, W. (1986). A neural cocktail-party processor. Biol. Cybern. 54, 29–40.
Wang, X. F., and Chen, G. (2003). Complex networks: small-world, scale-free and beyond. IEEE Circuits Syst. Mag. 3, 6–20.
Wang, X. J., and Buzsaki, G. (1996). Gamma oscillation by synaptic inhibition in a hippocampal interneuronal network model. J. Neurosci. 16, 6402–6413.
Weiler, N., Wood, L., Yu, J., Solla, S. A., and Shepherd, G. M. (2008). Top-down laminar organization of the excitatory network in motor cortex. Nat. Neurosci. 11, 360–366.
Wu, X., Chen, X., Li, Z., Han, S., and Zhang, D. (2007). Binding of verbal and spatial information in human working memory involves large-scale neural synchronization at theta frequency. Neuroimage 35, 1654–1662.
Keywords: neocortex, oscillations, hubs, homeostasis, simulations, columns, neuronal-networks, synchrony
Citation: Neymotin SA, Lee H, Park E, Fenton AA and Lytton WW (2011) Emergence of physiological oscillation frequencies in a computer model of neocortex. Front. Comput. Neurosci. 5:19. doi: 10.3389/fncom.2011.00019
Received: 19 October 2010;
Accepted: 01 April 2011;
Published online: 19 April 2011.
Edited by:
Ad Aertsen, Albert Ludwigs University, GermanyReviewed by:
Imre Vida, University of Glasgow, UKMichael Schmuker, Freie Universtiät Berlin, Germany
Maxim Bazhenov, University of California, USA
Copyright: © 2011 Neymotin, Lee, Park, Fenton and Lytton. This is an open-access article subject to a non-exclusive license between the authors and Frontiers Media SA, which permits use, distribution and reproduction in other forums, provided the original authors and source are credited and other Frontiers conditions are complied with.
*Correspondence: Samuel A. Neymotin, SUNY Downstate, 450 Clarkson Avenue Box 31, Brooklyn, NY 11203-2098, USA. e-mail: samn@neurosim.downstate.edu