EZcalcium: Open-Source Toolbox for Analysis of Calcium Imaging Data
 Daniel A. Cantu1,2†
  Bo Wang1†
  Michael W. Gongwer1,3
  Cynthia X. He1,3‡
  Anubhuti Goel1‡ Anand Suresh1
  Nazim Kourdougli1
  Erica D. Arroyo1,2 William Zeiger1
  Carlos Portera-Cailliau1,4*
- 1Department of Neurology, David Geffen School of Medicine at UCLA, Los Angeles, CA, United States
- 2Neuroscience Interdepartmental Program, David Geffen School of Medicine at UCLA, Los Angeles, CA, United States
- 3UCLA-Caltech Medical Scientist Training Program, David Geffen School of Medicine at UCLA, Los Angeles, CA, United States
- 4Department of Neurobiology, David Geffen School of Medicine at UCLA, Los Angeles, CA, United States
Fluorescence calcium imaging using a range of microscopy approaches, such as two-photon excitation or head-mounted “miniscopes,” is one of the preferred methods to record neuronal activity and glial signals in various experimental settings, including acute brain slices, brain organoids, and behaving animals. Because changes in the fluorescence intensity of genetically encoded or chemical calcium indicators correlate with action potential firing in neurons, data analysis is based on inferring such spiking from changes in pixel intensity values across time within different regions of interest. However, the algorithms necessary to extract biologically relevant information from these fluorescent signals are complex and require significant expertise in programming to develop robust analysis pipelines. For decades, the only way to perform these analyses was for individual laboratories to write their custom code. These routines were typically not well annotated and lacked intuitive graphical user interfaces (GUIs), which made it difficult for scientists in other laboratories to adopt them. Although the panorama is changing with recent tools like CaImAn, Suite2P, and others, there is still a barrier for many laboratories to adopt these packages, especially for potential users without sophisticated programming skills. As two-photon microscopes are becoming increasingly affordable, the bottleneck is no longer the hardware, but the software used to analyze the calcium data optimally and consistently across different groups. We addressed this unmet need by incorporating recent software solutions, namely NoRMCorre and CaImAn, for motion correction, segmentation, signal extraction, and deconvolution of calcium imaging data into an open-source, easy to use, GUI-based, intuitive and automated data analysis software package, which we named EZcalcium.
Introduction
To understand brain function, neuroscientists are increasingly turning to synthetic and genetically encoded fluorescence indicators (calcium and voltage sensors) for monitoring dynamic fluorescence signals produced by neurons and glia (Lin and Schnitzer, 2016; Yang and Yuste, 2017). In particular, calcium imaging with two-photon microscopy (Svoboda and Yasuda, 2006; Mostany et al., 2015) and micro-endoscopy with miniscopes or fiber photometry (Ghosh et al., 2011; Liberti et al., 2017; Jacob et al., 2018; Aharoni et al., 2019; Zhang et al., 2019) have provided key insights, such as how developing cortical networks undergo drastic transitions (Golshani et al., 2009; Rochefort et al., 2009) or how large neuronal ensembles encode spatial navigation (Dombeck et al., 2010). Calcium imaging offers several distinct advantages over traditional electrode recording techniques (Grewe and Helmchen, 2009; Grienberger and Konnerth, 2012): (1) it can be combined with genetic approaches (e.g., Cre-Lox) to probe neuronal activity in specific sub-populations of neurons (Goel et al., 2018; Yaeger et al., 2019) and glia (Srinivasan et al., 2016), either in specific subcellular compartments (e.g., axon boutons, dendritic spines, glial microdomains; Cichon and Gan, 2015; Broussard et al., 2018) or in specific brain regions or cortical layers (Lacefield et al., 2019); (2) recordings can be carried out over periods of days or even weeks (Chen et al., 2013; He et al., 2018); (3) recordings can be made simultaneously in a large population of hundreds or thousands of neurons in multiple brain regions (e.g., an entire sub-network; Sofroniew et al., 2016); (4) calcium imaging can also be combined with optogenetic manipulations, which makes it possible to perform all-optical probing of circuit function (Packer et al., 2015); (5) recordings can be performed in freely moving animals, providing a key link between circuit activity and behavior (Lin and Schnitzer, 2016); and (6) calcium imaging is less invasive than traditional electrode recordings (e.g., tetrodes, silicon probes). Another advantage the technique offers is the ability to precisely map the relative spatial location of groups of neurons. At the same time, lower costs of lasers and microscope components, including commercial systems, are making it increasingly affordable for laboratories to adopt calcium imaging.
Analyzing data generated by fluorescence calcium imaging, however, is not trivial. While increasing numbers of scientists can now afford to purchase a two-photon microscope to record with the latest genetically encoded fluorescent calcium indicators (Chen et al., 2013), they often lack the expertise to write the required sophisticated software to analyze the dynamic signals. The scientists who adopted two-photon microscopy two decades ago had to write their custom code. Unfortunately, it is often the case that the custom routines developed by one laboratory cannot easily be incorporated by other groups because the data are acquired differently or because the code may appear cryptic to those inexperienced in programming. Although there have been some recent efforts to develop and distribute open-source software packages for extracting and analyzing dynamic fluorescent signals, such as CaImAn, SIMA, and Suite2P (Kaifosh et al., 2014; Pachitariu et al., 2017; Giovannucci et al., 2019), these still require some programming experience in MATLAB or Python. Consequently, the lack of a simple, easy to use resource for analysis of calcium signals limits access to these powerful techniques for mainstream neuroscience laboratories and also affects the replicability of experiments, both of which are vital to scientific progress.
To address this unmet need, we created a new software package for analysis of calcium imaging data that emulates similar tools for analysis of volumetric or functional MRI data or spike sorting in electrophysiology (Chung et al., 2017; Yger et al., 2018). Our goal was to automate all of the core aspects of calcium imaging analysis in a modular design: (1) image registration (motion correction); (2) image segmentation into distinct regions of interest (ROI detection and refinement); and (3) signal extraction and deconvolution (dimension reduction). The entire process can be fully automated (e.g., unbiased ROI selection), allows for batch processing, and is compatible with standard desktop or laptop computers. The code is well-documented with discrete variable and function names to allow users to examine how the code works and make modifications. For example, it allows users to implement new routines or remove existing functionalities. Importantly, the code is wrapped in a set of user-friendly and intuitive graphical user interfaces (GUIs), which permits scientists who are not yet proficient in writing code in MATLAB to quickly and easily work with the interface and modify it as needed. This toolbox, EZcalcium, accepts common standards of data formats and should, therefore, be compatible with a variety of microscope systems. For motion correction, we incorporated NoRMCorre because it achieves excellent results with a variety of recordings (Pnevmatikakis and Giovannucci, 2017). For the segmentation process, we incorporated aspects of CaImAn (Giovannucci et al., 2019), which can detect ROIs dynamically, but we included manual selection capabilities as well. Finally, EZcalcium includes an ROI refinement step that allows the user to inspect the traces and the shape of each ROI and set parameters to automatically or manually remove ROIs. As for signal extraction and analysis, the code uses established constrained non-negative matrix factorization algorithms (Pnevmatikakis et al., 2016) to predict which changes in fluorescence intensity correspond to biological signals (action potentials) and which represent noise. Most importantly, the software is open-source and freely available on GitHub, so that future users can then contribute to the toolbox’s enhancement and expansion.
Method
Equipment
Programming experience is not required to run the toolbox. We recommend MATLAB R2018b (or newer MATLAB) on any operating system for using the EZcalcium toolbox. The toolbox was finalized and tested heavily in R2018b (9.5) and is likely to be the most compatible without modification in that environment. A 64-bit version of MATLAB running on a 64-bit computer is required to process files over 800 MB. The following MATLAB toolboxes are also required when running the source scripts: Image Processing, Parallel Computing, Signal Processing, and Statistics and Machine Learning. The amount of available system RAM necessary for a system depends on the size of the data being processed. Ideally, the amount of system RAM should be at least 3× the file size of raw, uncompressed data. Motion Correction and ROI Detection are the most RAM-intensive steps of the process, and significant slowdowns may occur if the necessary RAM is not available. CPU requirements for the toolbox are minimal, but processing is vastly improved with multiple cores. The toolbox also runs faster when the data to be analyzed are located on a fast, solid-state hard drive, since large amounts of data must be read and, in the case of Motion Correction, also written. Please note that EZcalcium is not designed to process data in real-time. EZcalcium can process data acquired with virtually any imaging software but users must first convert the imaging data to EZcalcium-compatible formats (.tif or .avi).
Software Setup
EZcalcium is freely available to be downloaded from the Portera-Cailliau Lab website1 or its GitHub site2. We provide EZcalcium as a custom MATLAB toolbox, which users can download on the GitHub releases page3. To install EZcalcium manually instead, users will need to download the source code of EZcalcium as well as CaImAn4 and NoRMCorre5. After everything is downloaded and added to the MATLAB path, type the command EZcalcium. A GUI will load that can run all the individual modules. When working in Windows, data saved to directories listed under C:\Users, C:\Program Files, and the directory in which MATLAB is installed are often protected against writing and deletion. Therefore, to process and generate data, it is recommended to use imaging files saved outside of C:\Users, C:\Program Files, and the directory in which MATLAB is installed. Failure to do so may result in an error stating “You do not have write permission.”
Calcium Imaging
We provide examples of typical results from using EZcalcium to analyze two-photon calcium imaging data acquired in drosophila and mice. The mouse data were collected in the Portera-Cailliau lab. Viral vectors expressing GCaMP6s (rAAV-hSyn-GCaMP6s) were injected in the VPM nucleus of the thalamus or primary visual cortex of 2–2.5 month-old mice at the time of the cranial window surgery, as previously described (Goel et al., 2018). Cranial windows were implanted over the barrel cortex (thalamocortical axons in layer 4) or primary visual cortex (layer 2/3 neurons), as described (Holtmaat et al., 2009). After allowing 2–3 weeks for optical expression of the indicator, imaging sessions began using custom-built two-photon microscopes. Imaging was performed either with resonant/galvo mirrors at 30 Hz in awake head-fixed mice allowed to run on a floating polystyrene ball (visual cortex) or with galvo/galvo mirrors at 8 Hz in lightly sedated (chlorprothixene, 2 mg/kg i.p.) mice (axon boutons). These experiments followed US National Institutes of Health guidelines for animal research, under an animal use protocol (ARC #2007-035) approved by the Chancellor’s Animal Research Committee and Office for Animal Research Oversight at the University of California, Los Angeles, CA, USA.
Drosophila two-photon calcium imaging data were obtained from R8 photoreceptors in the proximal medulla of the senseless-FLP fly line (UAS-opGCaMP6s/GMR-FRT-STOP-FRT-Gal4; UAS-opGCaMP6s/UAS-10X-myr::tdTomato), as described (Akin et al., 2019). Images were collected at 1 frame every 15 s using a custom-built two-photon microscope with galvo/galvo mirrors.
Results
Overview
The EZcalcium toolbox is controlled by a set of intuitive and user-friendly GUIs. Once configured for a set of similarly acquired data, preferences can be saved and reused for simple automation of workflow. The toolbox is able to import a variety of imaging data file types (including .tif, .avi, .mat) and supports the export of data in both proprietary (.mat, .xlsx) and open (.csv) file formats.
EZcalcium contains three main modules: Motion Correction, ROI Detection, and ROI Refinement (Figure 1). The Motion Correction module consists of a non-rigid method of template matching, NoRMCorre (Pnevmatikakis and Giovannucci, 2017). The ROI Detection module, which is built off of the CaImAn toolbox (Giovannucci et al., 2019), includes automated ROI detection, signal extraction, and deconvolution of fluorescence calcium signals. The ROI Refinement module enables the user to sort and view ROIs, manually exclude ROIs, and use automated and customized ROI exclusion criteria, including spatial and activity-dependent metrics, to refine the list of ROIs that will be ultimately analyzed.
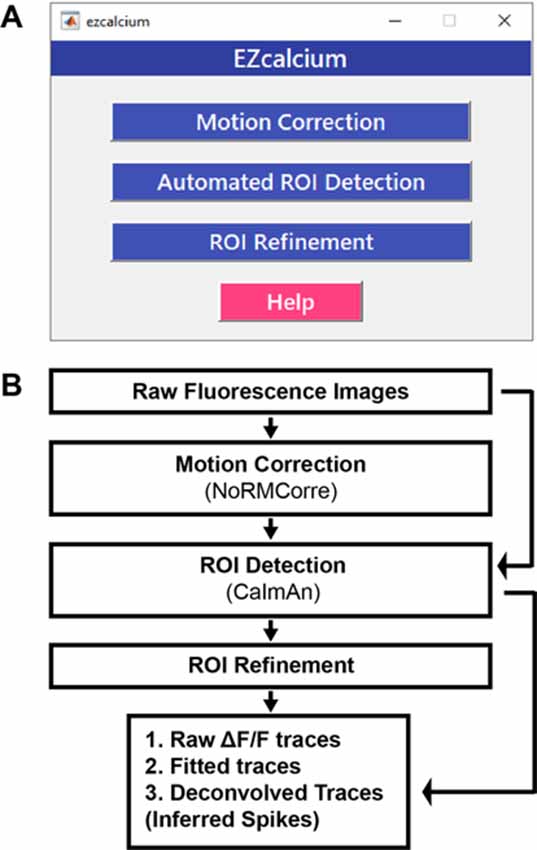
Figure 1. EZcalcium control graphical user interface (GUI) and workflow. (A) Appearance of the main EZcalcium control GUI. Each of the three modules of the toolbox is called by clicking on its respective button. Help buttons are located throughout the toolbox to provide documentation and resources to the user. (B) Workflow of the EZcalcium toolbox.
An important feature of EZcalcium is that batch processing is supported in the most resource-intensive modules (Motion Correction and especially ROI Detection), which allows for a large number of files to be sequentially loaded, processed, and saved. This feature is ideal for processing large data sets (>4 GB) that would best be processed overnight or on a dedicated analysis machine. In the event of a system “crash” or shutdown, as can occur during an automatic operating system update, progress is automatically saved at the end of each successful file processing and can be resumed from the start of the previous incomplete attempt.
The MATLAB source code is freely available for all modules so that users may modify and adapt the code for their purposes2. It is well-documented within the code itself for easy understanding and to facilitate modification. The toolbox is designed to be modular and adaptable for use with dynamic fluorescence data obtained from a wide variety of imaging systems; it should easily translate to other types of dynamic fluorescence imaging, such as voltage sensors and indicators of neurotransmitter release.
We have tested the EZcalcium toolbox on calcium imaging data collected with in vivo two-photon microscopy in neurons expressing GCaMP6s in mouse barrel cortex and primary visual cortex, in the visual system of Drosophila larvae, in boutons of thalamocortical axons in layer 4 in the mouse barrel cortex, and in cortical astrocytes. Examples of such analyses are provided throughout.
Below, we describe each of the three independent modules of EZcalcium (Motion Correction, ROI Detection, and ROI Refinement) and illustrate the result with specific examples from in vivo two-photon calcium imaging experiments done in mice and Drosophila. A more detailed step-by-step walkthrough tutorial is presented in the Supplementary Materials, EZcalcium Procedures.
Motion Correction
Motion correction is often needed when imaging in awake behaving animals, but it can be challenging to use some of the more popular approaches (e.g., TurboReg in ImageJ) for image registration, due to the nature of dynamic fluorescence signals. The main problem is that, as animals move, there is primarily translational drift in x and y directions, which is relatively easy to correct. However, the fluorescence signal intensity of the profile being imaged (cell body, axon bouton) will fluctuate depending on whether the element is active or not, which simple static registration algorithms may mistake for actual translation in the x-y dimension. The most popular alignment algorithms have been those based on template matching strategies, such as the Lucas-Kanade (Greenberg and Kerr, 2009; Mineault et al., 2016) or the Non-Rigid Motion Correction (NoRMcorre) strategy (Pnevmatikakis and Giovannucci, 2017). For EZcalcium we implemented the NoRMcorre motion correction algorithm (Figure 2) because it was significantly faster than Lucas-Kanade and a single iteration was sufficient to achieve satisfactory registration (Pnevmatikakis and Giovannucci, 2017). We found that this motion correction procedure provides excellent results for two-photon microscopy data collected from awake behaving mice (cell bodies or axon boutons) or live Drosophila visual system (Figure 3). The motion-corrected video is saved in .tif format. Of course, it is not strictly necessary to use the Motion Correction module if the videos do not exhibit motion artifacts (e.g., calcium imaging in brain slices or anesthetized animals).
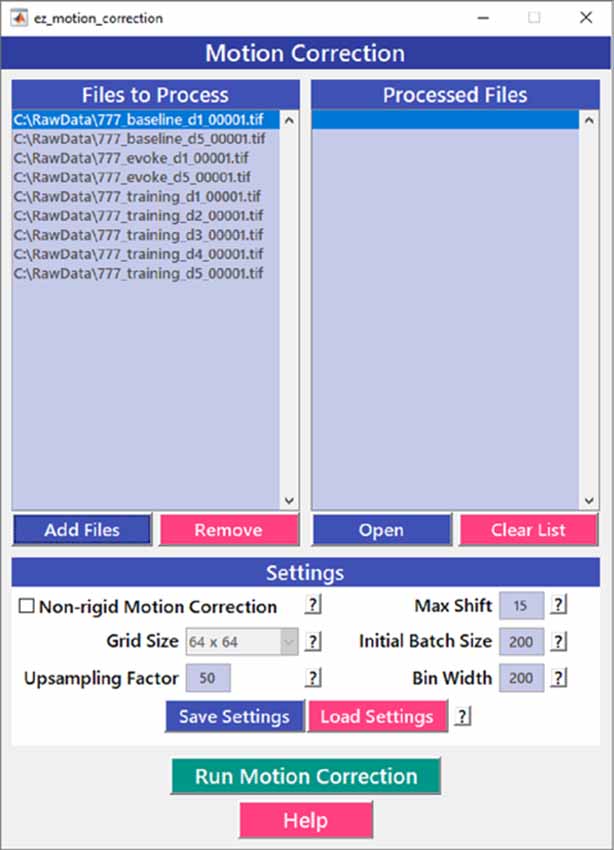
Figure 2. Motion correction GUI. The Motion Correction module utilizes the NoRMcorre algorithm to align the image sequences. It allows for batch processing of multiple videos.
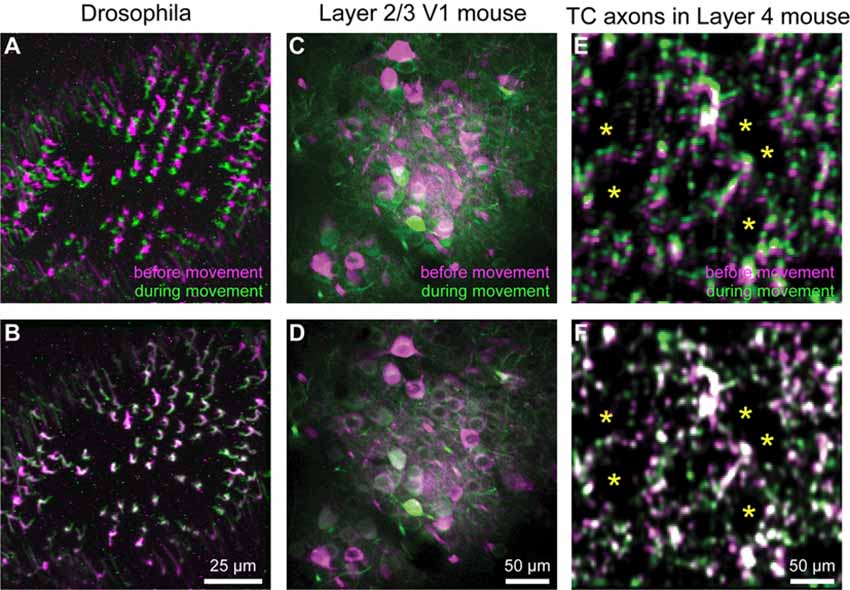
Figure 3. Motion correction results. (A–F) Representative xyt maximum intensity projections before (A,C,E) and after image registration (B,D,F) with EZcalcium for calcium imaging recordings of R8 photoreceptors in the proximal medulla of drosophila larvae (A,B), layer 2/3 neurons in adult mouse visual cortex (C,D) and thalamocortical axon boutons in layer 4 of adult mouse barrel cortex (E,F). Purple and green represent maximum intensity projections of 100–150 frames before and during motion artifact. *In panels (E) and (F) indicate the location of somata of presumed spiny stellate neurons in layer 4 of barrel cortex (their outline is revealed by the presence of fluorescent thalamocortical axon boutons around them).
ROI Detection
After image sequences (“videos”) are motion-corrected, the next step in processing the data is to segment the image into desired ROIs with the ROI Detection module (Figure 4). With the large fields of view typically collected with calcium imaging, manual segmentation of the images into distinct ROIs can be time-consuming and impractical, and potentially introduces human error, such as biased exclusion of ROIs that are smaller or less active. It is also challenging to separate signals from juxtaposed or overlapping ROIs. Automation of ROI segmentation can diminish the effects of bias and significantly reduce the time required to process large data sets. Our ROI Detection module is based on the CaImAn toolbox (Giovannucci et al., 2019) and provides access to most of the basic functionalities provided by CaImAn. Segmentation in EZcalcium with the ROI Detection GUI allows for a manual initial refinement step as an option for adding or removing ROIs by hand (Figures 5A,D). When such manual refinement is not selected, batch processing proceeds in a fully automated fashion. ROI Detection is based on using both temporal and spatial correlations to identify nearby pixels that exhibit similar changes in fluorescence intensity at the same time. It initializes by estimating activity using power spectral density or sparse non-negative matrix factorization (Maruyama et al., 2014). The ROI Detection step generates a MATLAB data file containing extracted fluorescence (ΔF/F) and deconvolved neural activity (spiking) traces using sparse non-negative deconvolution algorithms for each ROI (Vogelstein et al., 2010; Pnevmatikakis et al., 2016; Giovannucci et al., 2019). Representative examples of segmented fields of view of neuron somata in mouse visual cortex, R8 photoreceptors in Drosophila, and axon boutons in mouse barrel cortex are provided (Figure 5).
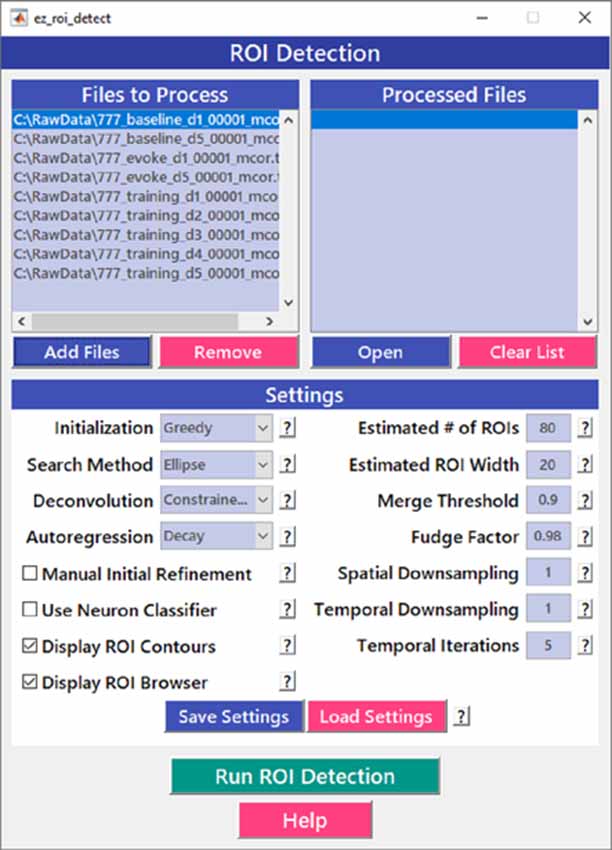
Figure 4. Region of interest (ROI) detection GUI. The automated Region of interest (ROI) Detection module is used to segment the image files into individual ROIs. It minimizes the impact of human bias in ROI selection and allows for batch processing of multiple videos. ROIs that are not automatically detected can be manually added.
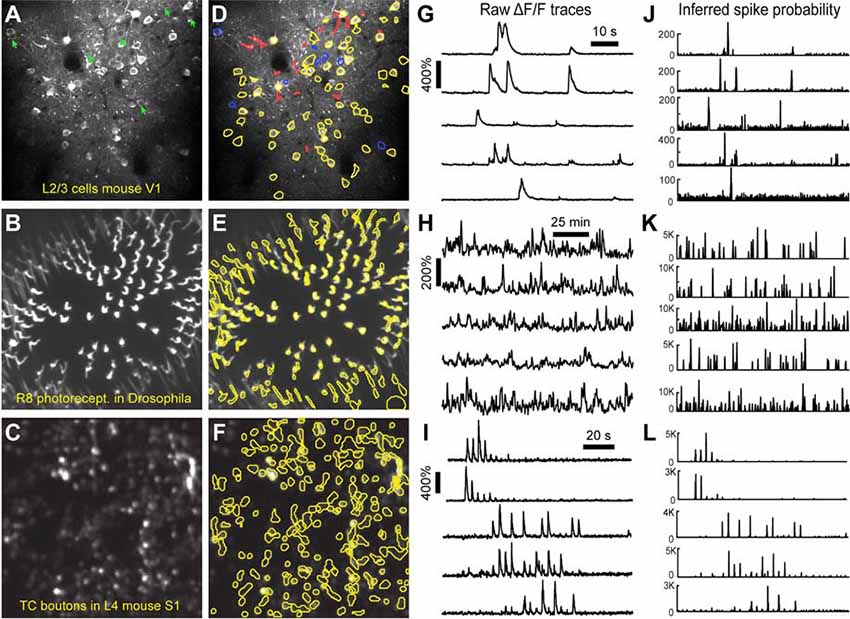
Figure 5. ROI detection results. (A–C) Representative examples of a field of view from two-photon calcium imaging of layer 2/3 neurons in the visual cortex of adult awake mice (A), R8 photoreceptors in the proximal medulla of drosophila larvae (B), and thalamocortical axon boutons in layer 4 of barrel cortex in adult anesthetized mice (C). Green arrows point to inactive cells that were not automatically detected and could not be manually added. (D–F) Same fields of view after automated ROI detection. Red contours indicate ROIs that might be removed during the ROI Refinement module due to their shape. Blue contours indicate ROIs that were selected manually. Yellow and red contours are ROIs that were selected automatically. (G–I) ΔF/F traces of representative ROIs from the same experiments as in (D–F). The traces in (G,H) show spontaneous activity, whereas traces in (I) represent whisker-evoked activity (20 stimulations for 1 s at 10 Hz, with 3 s long interstimulus interval). (J–L) Inferred probability of spiking after deconvolution for the same ROIs as in (D–F).
Multiple temporal iterations can be used to improve accuracy and to detect ROIs of complex shapes, which could be relevant for irregular profiles such as those of glia, invertebrate neurons, or dendritic spines. After processing a single video file, the user can find measurements of actual ROI size in the next module, ROI Refinement (see below), which can then be used to improve the performance of further ROI detection.
ROI Refinement
Automated ROI detection algorithms are still not perfect, and users may find it necessary to manually inspect shapes and individual traces of detected ROIs to reject false positive ROIs. The ROI Refinement GUI in EZcalcium (Figure 6) automates the exclusion of certain ROIs using user-defined heuristics. By automating this process, operator biases can be minimized. Refinement criteria include characteristics of ROI morphology and activity. The ROI Refinement module also allows the user to readily view the characteristics of all detected ROIs, including a visual map of the location of each ROI, the shape of the isolated ROI, and the extracted fluorescence traces in raw, inferred, and deconvolved formats (Figure 7A). This helps define what criteria should be used for excluding ROIs from further analysis (Figures 7B1,B2,C1,C2). It can also be used to manually exclude ROIs. After the ROI Refinement step is completed, data can be exported into proprietary (.mat, .xlsx) or open file formats (.csv).
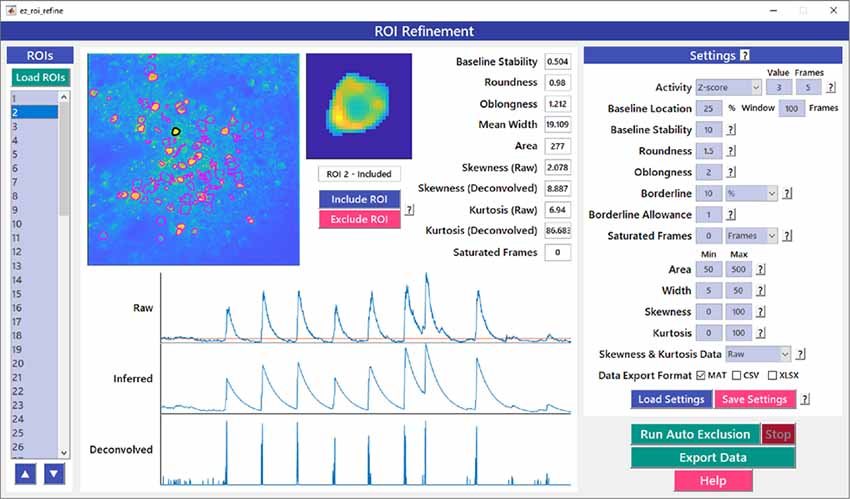
Figure 6. ROI refinement GUI. ROI Refinement is the final step of the EZcalcium workflow and consists of automatically or manually excluding ROIs based on their shape or their traces. Following refinement, data can be exported in a variety of formats.
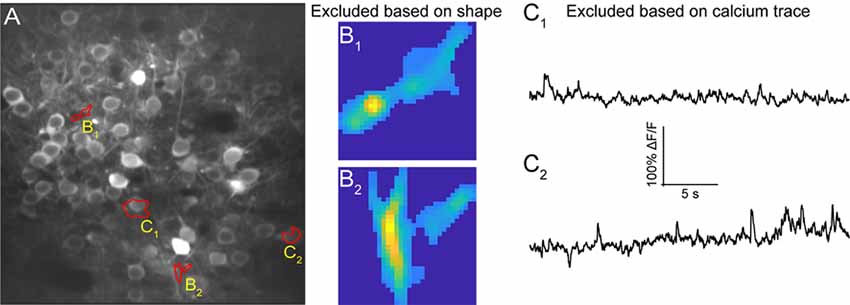
Figure 7. ROI refinement results. (A) Representative field of view from a calcium imaging experiment of layer 2/3 neurons in the visual cortex in an adult mouse (GCaMP6s) showing ROIs that showed unusual shapes or traces. (B1,B2) Representative ROIs to be excluded based on their shape. (C1,C2) Representative ROIs to be excluded based on their calcium traces.
Discussion
Despite its rising popularity in neuroscience, analyzing the rich data generated by fluorescence calcium imaging can be challenging. The goal of this project was to develop an open-source toolbox for analysis of calcium imaging data that could be freely disseminated across the broader scientific community. Aspects of certain modules of the EZcalcium toolbox have already been successfully implemented in several published studies (He et al., 2017, 2018; Goel et al., 2018), and the toolbox is freely available on GitHub2.
Our main priority was to create a toolbox with simple and intuitive GUIs that provide a “push-button” feel for the user. EZcalcium is well documented and includes discreet variable and function names that allow users to examine how the code works and to make modifications. We also wanted EZcalcium to be comprehensive, meaning that it would accomplish the main steps that most users would require, namely, image registration (Motion Correction module), segmentation (ROI Detection), and signal extraction (ROI Refinement). We, therefore, incorporated the latest MATLAB resources for analysis of calcium imaging data (Vogelstein et al., 2010; Pnevmatikakis et al., 2016; Pnevmatikakis and Giovannucci, 2017; Giovannucci et al., 2019). Also, the ROI Refinement module in EZcalcium can be used as a browser to inspect all detected ROIs, and to eliminate false-positive ROIs. We consider this to be a critical step because the automatic ROI Detection step is still prone to false positives and there are advantages to having additional manual control in omitting certain ROIs, after inspecting their raw traces within the GUI.
Compared with existing software packages, EZcalcium may be particularly suitable for investigators who find CaImAn a little less intuitive (because it lacks GUIs), or for those who prefer to use MATLAB rather than Python (e.g., Suite2P) for their customized changes to the code. While the GUI of Suite2P is an attempt to provide an all-in-one program, we think that splitting major steps into different modules is easier for novices to understand the general workflow. We also tried to avoid exposing internal variable names and using technical jargon on the GUI as much as possible, and made an effort to provide easily accessible help buttons on the GUI to make it more user-friendly.
All three fundamental steps in the processing of dynamic fluorescence signals in biology (Motion Correction, ROI Detection, and ROI Refinement) are major components of EZcalcium. Although we designed EZcalcium primarily with two-photon calcium imaging in mind, the toolbox should in principle be compatible with other types of dynamic fluorescence data, such as voltage indicators (Abdelfattah et al., 2019) and fluorescence sensors that probe neurotransmitter release (Marvin et al., 2013). The open-source and modular format allows our toolbox to be readily adapted for specific needs so different users can add new capabilities. For example, while the ROI Detection module in EZcalcium is presently not compatible with microendoscopic calcium imaging data (miniscope), an additional module with Constrained Non-negative Matrix Factorization for endoscopes (CNMF-E; Zhou et al., 2018) could easily be added to our toolbox to segment those data.
Data Availability Statement
The datasets generated for this study are available on request to the corresponding author.
Ethics Statement
The animal study was reviewed and approved by Chancellor’s Animal Research Committee and Office for Animal Research Oversight at the University of California, Los Angeles.
Author Contributions
DC and CP-C designed the framework of the toolbox. DC, BW, and MG wrote the code of the toolbox. BW, CH, AG, AS, NK, EA, and WZ provided experimental data and tested the toolbox. DC, BW, MG, and CP-C wrote the manuscript.
Funding
This research was supported by the UCLA Neural Microcircuits Training Grant (T32-NS058280) and the UCLA Eugene V. Cota-Robles Fellowship to DC, as well as grants W81XWH-17-1-0231 and W81XWH-14-1-0433 (USAMRMC, DOD), a Developmental Disabilities Translational Research Program grant #20160969 (The John Merck Fund), SFARI grants 295438 and 513155CP (Simons Foundation) and NIH NICHD grant R01 HD054453 to CP-C.
Conflict of Interest
The authors declare that the research was conducted in the absence of any commercial or financial relationships that could be construed as a potential conflict of interest.
Acknowledgments
We thank Lauren Wierenga for her help in earlier stages of this project, Bryce Bajar, Orkun Akin, and Larry Zipursky for the Drosophila data, as well as Dean Buonomano and Dario Ringach for feedback on the manuscript. Some aspects of the EZcalcium code were described in Cantu (2019).
Footnotes
- ^ https://porteralab.dgsom.ucla.edu/pages/matlab
- ^ https://github.com/porteralab/EZcalcium
- ^ https://github.com/porteralab/EZcalcium/releases
- ^ https://github.com/porteralab/CaImAn-MATLAB
- ^ https://github.com/porteralab/NoRMCorre
Supplementary Material
The Supplementary Material for this article can be found online at: https://www.frontiersin.org/articles/10.3389/fncir.2020.00025/full#supplementary-material.
References
Abdelfattah, A. S., Kawashima, T., Singh, A., Novak, O., Liu, H., Shuai, Y., et al. (2019). Bright and photostable chemigenetic indicators for extended in vivo voltage imaging. Science 365, 699–704. doi: 10.1126/science.aav6416
Aharoni, D., Khakh, B. S., Silva, A. J., and Golshani, P. (2019). All the light that we can see: a new era in miniaturized microscopy. Nat. Methods 16, 11–13. doi: 10.1038/s41592-018-0266-x
Akin, O., Bajar, B. T., Keles, M. F., Frye, M. A., and Zipursky, S. L. (2019). Cell-type-specific patterned stimulus-independent neuronal activity in the drosophila visual system during synapse formation. Neuron 101, 894.e5–904.e5. doi: 10.1016/j.neuron.2019.01.008
Broussard, G. J., Liang, Y., Fridman, M., Unger, E. K., Meng, G., Xiao, X., et al. (2018). In vivo measurement of afferent activity with axon-specific calcium imaging. Nat. Neurosci. 21, 1272–1280. doi: 10.1038/s41593-018-0211-4
Cantu, D. A. (2019). Analysis of Fluorescent Calcium Signals in the Detection of Neural Circuitry Abnormalities in a Mouse Model of Autism. Ph.D. thesis, Doctor of Philosophy in Neuroscience, Neuroscience Interdepartmental Program, UCLA. Available online at https://escholarship.org/uc/item/48s773xv
Chen, T. W., Wardill, T. J., Sun, Y., Pulver, S. R., Renninger, S. L., Baohan, A., et al. (2013). Ultrasensitive fluorescent proteins for imaging neuronal activity. Nature 499, 295–300. doi: 10.1038/nature12354
Chung, J. E., Magland, J. F., Barnett, A. H., Tolosa, V. M., Tooker, A. C., Lee, K. Y., et al. (2017). A fully automated approach to spike sorting. Neuron 95, 1381.e6–1394.e6. doi: 10.1016/j.neuron.2017.08.030
Cichon, J., and Gan, W. B. (2015). Branch-specific dendritic Ca2+ spikes cause persistent synaptic plasticity. Nature 520, 180–185. doi: 10.1038/nature14251
Dombeck, D. A., Harvey, C. D., Tian, L., Looger, L. L., and Tank, D. W. (2010). Functional imaging of hippocampal place cells at cellular resolution during virtual navigation. Nat. Neurosci. 13, 1433–1440. doi: 10.1038/nn.2648
Ghosh, K. K., Burns, L. D., Cocker, E. D., Nimmerjahn, A., Ziv, Y., Gamal, A. E., et al. (2011). Miniaturized integration of a fluorescence microscope. Nat. Methods 8, 871–878. doi: 10.1038/nmeth.1694
Giovannucci, A., Friedrich, J., Gunn, P., Kalfon, J., Brown, B. L., Koay, S. A., et al. (2019). CaImAn an open source tool for scalable calcium imaging data analysis. Elife 8:e38173. doi: 10.7554/eLife.38173
Goel, A., Cantu, D. A., Guilfoyle, J., Chaudhari, G. R., Newadkar, A., Todisco, B., et al. (2018). Impaired perceptual learning in a mouse model of Fragile X syndrome is mediated by parvalbumin neuron dysfunction and is reversible. Nat. Neurosci. 21, 1404–1411. doi: 10.1038/s41593-018-0231-0
Golshani, P., Gonçalves, J. T., Khoshkhoo, S., Mostany, R., Smirnakis, S., and Portera-Cailliau, C. (2009). Internally mediated developmental desynchronization of neocortical network activity. J. Neurosci. 29, 10890–10899. doi: 10.1523/JNEUROSCI.2012-09.2009
Greenberg, D. S., and Kerr, J. N. (2009). Automated correction of fast motion artifacts for two-photon imaging of awake animals. J. Neurosci. Methods 176, 1–15. doi: 10.1016/j.jneumeth.2008.08.020
Grewe, B. F., and Helmchen, F. (2009). Optical probing of neuronal ensemble activity. Curr. Opin. Neurobiol. 19, 520–529. doi: 10.1016/j.conb.2009.09.003
Grienberger, C., and Konnerth, A. (2012). Imaging calcium in neurons. Neuron 73, 862–885. doi: 10.1016/j.neuron.2012.02.011
He, C. X., Arroyo, E. D., Cantu, D. A., Goel, A., and Portera-Cailliau, C. (2018). A versatile method for viral transfection of calcium indicators in the neonatal mouse brain. Front. Neural Circuits 12:56. doi: 10.3389/fncir.2018.00056
He, C. X., Cantu, D. A., Mantri, S. S., Zeiger, W. A., Goel, A., and Portera-Cailliau, C. (2017). Tactile defensiveness and impaired adaptation of neuronal activity in the Fmr1 knock-out mouse model of autism. J. Neurosci. 37, 6475–6487. doi: 10.1523/JNEUROSCI.0651-17.2017
Holtmaat, A., Bonhoeffer, T., Chow, D. K., Chuckowree, J., De Paola, V., Hofer, S. B., et al. (2009). Long-term, high-resolution imaging in the mouse neocortex through a chronic cranial window. Nat. Protoc. 4, 1128–1144. doi: 10.1038/nprot.2009.89
Jacob, A. D., Ramsaran, A. I., Mocle, A. J., Tran, L. M., Yan, C., Frankland, P. W., et al. (2018). A compact head-mounted endoscope for in vivo calcium imaging in freely behaving mice. Curr. Protoc. Neurosci. 84:e51. doi: 10.1002/cpns.51
Kaifosh, P., Zaremba, J. D., Danielson, N. B., and Losonczy, A. (2014). SIMA: python software for analysis of dynamic fluorescence imaging data. Front. Neuroinform. 8:80. doi: 10.3389/fninf.2014.00080
Lacefield, C. O., Pnevmatikakis, E. A., Paninski, L., and Bruno, R. M. (2019). Reinforcement learning recruits somata and apical dendrites across layers of primary sensory cortex. Cell reports 26, 2000.e2–2008.e2. doi: 10.1016/j.celrep.2019.01.093
Liberti, W. A., Perkins, L. N., Leman, D. P., and Gardner, T. J. (2017). An open source, wireless capable miniature microscope system. J. Neural Eng. 14:045001. doi: 10.1088/1741-2552/aa6806
Lin, M. Z., and Schnitzer, M. J. (2016). Genetically encoded indicators of neuronal activity. Nat. Neurosci. 19, 1142–1153. doi: 10.1038/nn.4359
Maruyama, R., Maeda, K., Moroda, H., Kato, I., Inoue, M., Miyakawa, H., et al. (2014). Detecting cells using non-negative matrix factorization on calcium imaging data. Neural Netw. 55, 11–19. doi: 10.1016/j.neunet.2014.03.007
Marvin, J. S., Borghuis, B. G., Tian, L., Cichon, J., Harnett, M. T., Akerboom, J., et al. (2013). An optimized fluorescent probe for visualizing glutamate neurotransmission. Nat. Methods 10, 162–170. doi: 10.1038/nmeth.2333
Mineault, P. J., Tring, E., Trachtenberg, J. T., and Ringach, D. L. (2016). Enhanced spatial resolution during locomotion and heightened attention in mouse primary visual cortex. J. Neurosci. 36, 6382–6392. doi: 10.1523/JNEUROSCI.0430-16.2016
Mostany, R., Miquelajauregui, A., Shtrahman, M., and Portera-Cailliau, C. (2015). Two-photon excitation microscopy and its applications in neuroscience. Methods Mol. Biol. 1251, 25–42. doi: 10.1007/978-1-4939-2080-8_2
Pachitariu, M., Stringer, C., D’ipoppa, M., Schroder, S., Rossi, L., Dalgleish, H., et al. (2017). Suite2p: beyond 10,000 neurons with standard two-photon microscopy. BioRxiv [Preprint]. doi: 10.1101/061507
Packer, A. M., Russell, L. E., Dalgleish, H. W., and Häusser, M. (2015). Simultaneous all-optical manipulation and recording of neural circuit activity with cellular resolution in vivo. Nat. Methods 12, 140–146. doi: 10.1038/nmeth.3217
Pnevmatikakis, E. A., and Giovannucci, A. (2017). NoRMCorre: an online algorithm for piecewise rigid motion correction of calcium imaging data. J. Neurosci. Methods 291, 83–94. doi: 10.1016/j.jneumeth.2017.07.031
Pnevmatikakis, E. A., Soudry, D., Gao, Y., Machado, T. A., Merel, J., Pfau, D., et al. (2016). Simultaneous denoising, deconvolution, and demixing of calcium imaging data. Neuron 89, 285–299. doi: 10.1016/j.neuron.2015.11.037
Rochefort, N. L., Garaschuk, O., Milos, R. I., Narushima, M., Marandi, N., Pichler, B., et al. (2009). Sparsification of neuronal activity in the visual cortex at eye-opening. Proc. Natl. Acad. Sci. U S A 106, 15049–15054. doi: 10.1073/pnas.0907660106
Sofroniew, N. J., Flickinger, D., King, J., and Svoboda, K. (2016). A large field of view two-photon mesoscope with subcellular resolution for in vivo imaging. Elife 5:e14472. doi: 10.7554/eLife.14472
Srinivasan, R., Lu, T. Y., Chai, H., Xu, J., Huang, B. S., Golshani, P., et al. (2016). New transgenic mouse lines for selectively targeting astrocytes and studying calcium signals in astrocyte processes in situ and in vivo. Neuron 92, 1181–1195. doi: 10.1016/j.neuron.2016.11.030
Svoboda, K., and Yasuda, R. (2006). Principles of two-photon excitation microscopy and its applications to neuroscience. Neuron 50, 823–839. doi: 10.1016/j.neuron.2006.05.019
Vogelstein, J. T., Packer, A. M., Machado, T. A., Sippy, T., Babadi, B., Yuste, R., et al. (2010). Fast nonnegative deconvolution for spike train inference from population calcium imaging. J. Neurophysiol. 104, 3691–3704. doi: 10.1152/jn.01073.2009
Yaeger, C. E., Ringach, D. L., and Trachtenberg, J. T. (2019). Neuromodulatory control of localized dendritic spiking in critical period cortex. Nature 567, 100–104. doi: 10.1038/s41586-019-0963-3
Yang, W., and Yuste, R. (2017). In vivo imaging of neural activity. Nat. Methods 14, 349–359. doi: 10.1038/nmeth.4230
Yger, P., Spampinato, G. L., Esposito, E., Lefebvre, B., Deny, S., Gardella, C., et al. (2018). A spike sorting toolbox for up to thousands of electrodes validated with ground truth recordings in vitro and in vivo. Elife 7:e34518. doi: 10.7554/eLife.34518
Zhang, L., Liang, B., Barbera, G., Hawes, S., Zhang, Y., Stump, K., et al. (2019). Miniscope GRIN lens system for calcium imaging of neuronal activity from deep brain structures in behaving animals. Curr. Protoc. Neurosci. 86:e56. doi: 10.1002/cpns.56
Keywords: 2-photon, CaImAn, deconvolution, neocortex, neural activity, software, two-photon
Citation: Cantu DA, Wang B, Gongwer MW, He CX, Goel A, Suresh A, Kourdougli N, Arroyo ED, Zeiger W and Portera-Cailliau C (2020) EZcalcium: Open-Source Toolbox for Analysis of Calcium Imaging Data. Front. Neural Circuits 14:25. doi: 10.3389/fncir.2020.00025
Received: 20 December 2019; Accepted: 20 April 2020;
Published: 15 May 2020.
Edited by:
David J. Margolis, Rutgers, The State University of New Jersey, United StatesReviewed by:
Alan Fine, Dalhousie University, CanadaJoseph Donovan, Max Planck Institute of Neurobiology (MPIN), Germany
Fumi Kubo, National Institute of Genetics (Japan), Japan
Copyright © 2020 Cantu, Wang, Gongwer, He, Goel, Suresh, Kourdougli, Arroyo, Zeiger and Portera-Cailliau. This is an open-access article distributed under the terms of the Creative Commons Attribution License (CC BY). The use, distribution or reproduction in other forums is permitted, provided the original author(s) and the copyright owner(s) are credited and that the original publication in this journal is cited, in accordance with accepted academic practice. No use, distribution or reproduction is permitted which does not comply with these terms.
*Correspondence: Carlos Portera-Cailliau, cpcailliau@mednet.ucla.edu
† These authors have contributed equally to this work
‡ Present address: Cynthia X. He, Department of Psychiatry, UCSF Weill Institute for Neurosciences, San Francisco, CA, USA Anubhuti Goel, Department of Psychology and Neuroscience Program, UC Riverside, Riverside, CA, USA