Developmental coordination of gene expression between synaptic partners during GABAergic circuit assembly in cerebellar cortex
- 1 Cold Spring Harbor Laboratory, Neuroscience, Cold Spring Harbor, New York, NY, USA
- 2 Cold Spring Harbor Laboratory, Quantitative Biology, Cold Spring Harbor, NY, USA
- 3 Applied Mathematics and Statistics, Stony Brook University, Stony Brook, NY, USA
The assembly of neural circuits involves multiple sequential steps such as the specification of cell-types, their migration to proper brain locations, morphological and physiological differentiation, and the formation and maturation of synaptic connections. This intricate and often prolonged process is guided by elaborate genetic mechanisms that regulate each step. Evidence from numerous systems suggests that each cell-type, once specified, is endowed with a genetic program that unfolds in response to, and is regulated by, extrinsic signals, including cell–cell and synaptic interactions. To a large extent, the execution of this intrinsic program is achieved by the expression of specific sets of genes that support distinct developmental processes. Therefore, a comprehensive analysis of the developmental progression of gene expression in synaptic partners of neurons may provide a basis for exploring the genetic mechanisms regulating circuit assembly. Here we examined the developmental gene expression profiles of well-defined cell-types in a stereotyped microcircuit of the cerebellar cortex. We found that the transcriptomes of Purkinje cell and stellate/basket cells are highly dynamic throughout postnatal development. We revealed “phasic expression” of transcription factors, ion channels, receptors, cell adhesion molecules, gap junction proteins, and identified distinct molecular pathways that might contribute to sequential steps of cerebellar inhibitory circuit formation. We further revealed a correlation between genomic clustering and developmental co-expression of hundreds of transcripts, suggesting the involvement of chromatin level gene regulation during circuit formation.
Introduction
The cerebellum, a primary center for motor coordination, is an excellent system to study neural circuit assembly in the CNS due to its highly stereotyped cytoarchitecture. For example, the cerebellar cortex is organized as a near lattice-like circuit architecture with a protracted period of circuit formation. At the focal position in cerebellar cortex and as its sole output are the Purkinje neurons, which receive multiple sets of excitatory and inhibitory inputs. The glutamatergic parallel fibers synapse onto the slender spines of the distal dendrite, while the climbing fibers prefer the stubby spines of the more proximal dendrite. In addition, the GABAergic basket interneurons target Purkinje cell (PC) soma and axon initial segments (AIS), whereas the stellate interneurons innervate the dendritic shafts. The integration of these excitatory and inhibitory inputs shapes PC outputs, which are transmitted to deep cerebellar nuclei and regulate motor coordination (D’Angelo et al., 2011). While significant progress have been made in understanding the development of excitatory connectivity (i.e., parallel fibers and climbing fibers), the development of inhibitory circuitry remains poorly understood.
All cerebellar neurons derive from progenitors that proliferate in two germinal neuroepithelia: the ventricular zone (VZ) generates GABAergic neurons, whereas the rhombic lip is the origin of glutamatergic neurons. Among VZ-derivatives, GABAergic projection neurons and interneurons are generated according to different strategies. PC are produced at the onset of cerebellar neurogenesis by discrete progenitor pools located in distinct VZ microdomains; they are specified within the VZ and acquire mature phenotypes largely according to cell-autonomous programs. On the other hand, the different classes of inhibitory interneurons, including basket (BkC) and stellate (StC) cells, derive from a single population of precursors that delaminate into the prospective white matter (PWM), where they continue to divide until the end of the first postnatal week (Altman and Bayer, 1997; Leto et al., 2012).
Following their generation in the PWM, basket, and stellate cells migrate toward cerebellar cortex and reach Purkinje cell layer (PCL) by approximately P7 and P10, respectively. During the subsequent weeks, PC, BkC, and StC undergo profound morphological and physiological differentiation while establishing specific synaptic connectivity (Cameron et al., 2009). For example, the PCs elaborate their dendrites with characteristic branching patterns while the BskCs extend their axon branches onto PCs. Each BskC innervates 7–10 PCs at their soma and AIS (Figure 1A). The maturation of BskC axon arbor and pinceau synapses continue into the fourth postnatal week (Ango et al., 2004, 2008). The development of StCs lags behind that of BskCs by a few days. StC axons extend along the Bergmann glia fibers with characteristic trajectories to innervate PC dendrites. Using a candidate gene approach, we have previously demonstrated that members of the L1 family immunoglobulin cell adhesion molecules (IgCAMs), neurofascin, and CHL1, contribute to the subcellular organization of BskC and StC innervation, respectively (Ango et al., 2004, 2008). However, the genetic mechanisms that control the concerted differentiation and synaptic connectivity during inhibitory circuit formation remain poorly understood.
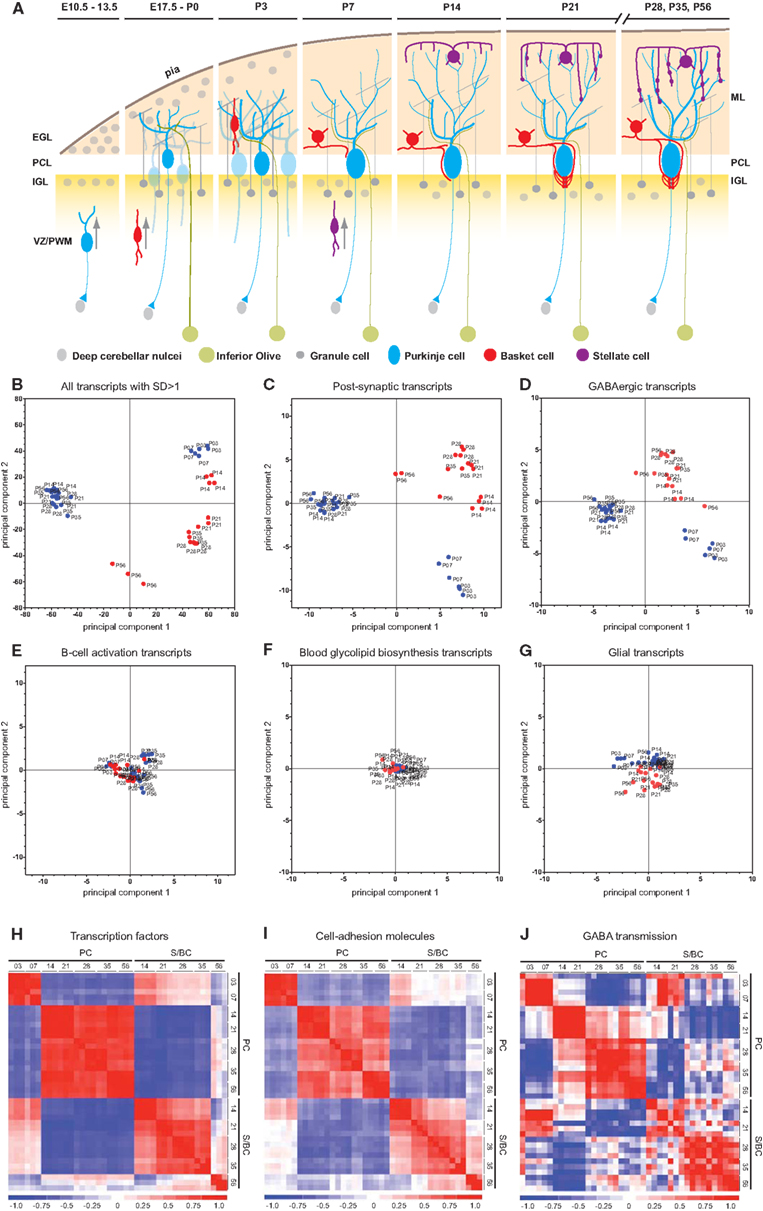
Figure 1. Cell-type and developmental stage-specific gene expression profiles in PC and S/BC. (A) Schematic representation of the anatomical changes during cerebellar development with emphasis on the postnatal stages. (B-D) PCA on all samples. Transcripts that changed significantly (SD > 1 of mean, p < 0.05) across all time points can clearly segregate PCs (blue) and S/BCs (red) (B). PCA based on all postsynaptic protein transcripts (C), encoding membrane proteins such as ion channels, cell adhesion molecules, and cell-surface ligand receptors; GABAergic transcripts (D) can segregate PCs and S/BCs, Non-specific B-cell activation transcripts (E), Blood glycolipid biosynthesis (F), and Glia expressed transcripts (G) fails to segregate the samples according to cell-types. (H–J) Cross-correlation analysis across all samples captures several developmental epochs in each cell-type. Transcription factor transcripts parse the PC into two distinct P3–P7 and P14–P56 epochs. S/BCs are also subdivided into P14–35 and P56 (H). Cell adhesion molecules divides the PC into two broad groups P3–P7 and P14–P56 and further subdivides the later into 3 epochs (P14–P21, P28–P35, and P56). S/BCs are also subdivided into 3 epochs P14–P21, P28–P35, and P56 (I). GABAergic transcripts subdivide the PCs into three epochs P3–P7, P14–P21, and P28–P56. S/BCs are roughly split into 2 classes P14–P21 and P28–P56. GABAergic transcripts comprised of all murine GABA receptors and transporters (J).
To explore the intrinsic genetic program that direct the differentiation and connectivity between PC and BskC/StC(S/BC) cells, here we examined the developmental dynamics of their specific gene expression profiles. We found (i) phasic developmental expression of transcription factors (TFs), ion channels, receptors, cell adhesion molecules (CAMs), gap junction proteins, and novel cell-type specific transcripts, (ii) distinct molecular pathways that may contribute to different developmental stages for these cell-types; (iii) correlation between genomic clustering and developmental co-expression of hundreds of transcripts, suggesting the involvement of chromatin level gene regulation during circuit formation. Our dataset also provides a valuable resource for further studying the molecular and developmental genetic mechanisms underlying cerebellar circuit formation.
Materials and Methods
Manual Sorting
Amplified and labeled mRNA were prepared from 50 to 75 PC or between 125 and 150 S/BC cells that were manually sorted from each developmental stage. While PCs are 40 μm in diameter and lie along the PCL the StC and the BskC are both 8–10 μm in diameter and are distributed in the molecular layer. Although the BskC cell bodies lie relatively closer to the PC it is not always apparent since StC and BskC are not uniformly distinct in layer separation. Also there is no molecular marker that distinguishes Bsk from StC. This prevented us from distinguishing StC from BskC during manual sorting. We had previously demonstrated the sensitivity and accuracy of the manual sorting method and that ∼30 cells were enough to detect rare transcripts (Sugino et al., 2006). The amplified cDNA were hybridized to Affymetrix MOE430.2 chips containing 45,101 probes sets. Each cell-type at each time point had at least three biological replicates from different male mice. The results from each were highly reproducible with average correlation coefficient between each replicate pair for all probe sets being 0.97211 ± 0.01827 (Mean, SD).
RNA Amplification
RNA was isolated using Arcturus PicoPure (Applied biosystems, USA Cat#KIT0202) spin columns according to manufacturers protocol with the additional step of in-column DNase digestion. RNA was converted to cDNA by oligo-dT primers and then amplified by two rounds of linear isothermal amplification steps using the MessageAmpII aRNA amplification kit (Ambion, USA Cat#AM1751) followed by biotin labeling.
Gene Expression
Labeled aRNA were hybridized to Affymetrix mouse 3′ expression array MOE430.2 according to manufacturers fluid handling, hybridization, and scanning protocols. CEL files from each hybridization was converted to normalized expression values using Bioconductor package1 in R2 using GCRMA method. Further differential analysis, Principal Component Analysis (PCA), cross-correlation analysis, and downstream visualization was done in dCHIP software3. Microarray data submitted to GEO; accession GSE37055.
In situ Hybridization
To generate in situ probes Trizol extracted total mouse brain RNA was used to perform RT-PCR using gene specific primers (Superscript III, Invitrogen, USA). RT product was subjected to nested PCR with T3 tagged forward and T7 tagged reverse primers (see primer list in Table A2 in Appendix). In vitro transcription using with T7 and T3 driven RNA polymerase and DIG-labeled rNTPs generate the probes that was run on Bioanalyzer to ensure single RNA product of expected size. T7 produced antisense probes and T3 generated the control sense probes. In situ hybridization was performed at 61°C on 15 μm thick sagittal cryo-sectioned brains from C57B6 male animals. Detection was done using anti-DIG antibody and VectaRed detection reagent (Vector Labs, USA Cat#SK-5100).
Permutation Test
Permutation test was performed on normalized expression values of PC and S/BC cells to find genes that are differentially expressed across different time points. For each probe, a t-statistic Tobs was computed as
Where <xi> is the mean of expression values of replicates at the ith time point, <xj> is the mean of replicates from all other time points except the ith time point, si is the standard deviation of expression values of replicates at the ith time points and sj is the standard deviation of expression values of replicates at other time points ni denotes number of replicates at the ith time point and nj denotes number of replicates at other time points.
Then random permutations were performed across all time points and replicates. In such test, for one probe, at one time point, we calculated Tobs (see above formula), then shuffled the expression values for this probe 10,000 times and calculated the Tm (also use the same formula as calculating Tobs), for m = 1, … M, where M is number of random permutations, here we set M equal to 10,000. Then the permutation p-value was calculated as the following formula.
The above procedures were applied to all probes at each time point to calculate p-values. Raw p-values were adjusted by false discovery rate (FDR) approach to account for multiple hypotheses testing by controlling the proportion of false positive (Storey and Storey, 2002; Storey, 2003). This approach determines a q-value for each test. It controls the number of false discoveries in those test that result in a discovery (i.e., a significant result). In our analysis, any probes with q-values <0.05 were considered as significantly differentially expressed. Then IDs of these probe set were converted to gene symbols.
Principal Component Analysis
Principal Component Analysis projects multivariate data objects onto a lower dimensional space while retaining as much of the original variance as possible. Replicates were averaged to obtain one vector of expression values for each time point in development and regeneration. We used PCA to project the seven PC and five S/BC samples of the development time series, each consisting of 45,101 variables (probe sets), into a two-dimensional plane. PCA operation was performed using dCHIP and the first two principal components are plotted. The class labels are used to color the samples but do not enter the PCA analysis. Each principal component is a linear transformation of the expression values of all genes in a gene list. So in effect PCA maps samples in high N dimension (N is the number of genes) to two dimension, maximizing the space among the samples.
Pathway Enrichment Analysis
Kyoto Encyclopedia of Genes and Genomes (KEGG) pathway enrichment analyses for significant genes at each time point were carried out using the DAVID tool4. Pathways with enrichment p-values <0.05 were considered as significantly enriched. Pathway enrichment analyses were performed separately for genes with the different expression pattern (upregulation or down-regulation). Genes were considered as upregulated at each time point if the mean of expression values of replicates at one time point is larger than the mean of replicates from all other time points, vice versa for down-regulation. The p-values of enriched pathways for both upregulated and down-regulated genes were combined together to form a p-value matrix. Each element of this matrix represented the p-values of an enriched pathway at a certain time point. The transformed p-value matrix was used to construct a heat map using a Pearson correlation metric with hierarchical clustering using R5. Two colors were utilized specifically for pathways containing upregulated and down-regulated genes.
Genomic Co-Localization and Co-Expression
A set of co-regulated genes on the same chromosome in the genome can be defined to be co-localized at a certain genomic loci, though they are not necessarily consecutive. In our analysis, a co-localized gene cluster can be detected computationally if some genes that are significantly differentially expressed at a time point are within three ORF distances of each other and on the same chromosome. We used our algorithm to scan the chromosomes of Mus musculus using window lengths of three genes, advancing one gene between two instances of the window so that all possible three-gene windows were tested. Consecutive statistically significant windows were merged up in only one cluster. Then a permutation test was used to evaluate whether these significantly differentially expressed genes impose a stronger clustering tendency than would be expected by chance. In such a test, we counted how many clusters can be identified among our co-regulated genes at a time point, then repeated the clustering analysis on 10,000 sets of genes that were randomly selected in the genome to find out how many clusters could be obtained by chance. In the entire distribution of the number of clusters for 10,000 random gene sets, the p-value of clustering tendency can be defined by the portion of cluster numbers that are larger than the cluster number in significantly expressed genes. It can be expressed as following formula, for m = 1, … M, where M is number of random permutations. In this study, we set M equal to 10,000, Tobs is the number of cluster observed in our data, and Tm is that number of cluster in random gene sets. Then the permutation p-value was calculated as
For visualization of co-expressed and co-localized regions using UCSC genome browser co-ordinates have been provided as individual text files in BED format in the Supplementary Material.
Promoter Scanning
PSCAN6 Ver1.2.1 was used for promoter scanning selecting a region −450 to +50 of the input genes using motif descriptors from JASPAR database7. The JASPAR CORE database contains a curated, non-redundant set of profiles, derived from published collections of experimentally defined TF binding sites for eukaryotes. For promoter scanning algorithm refer to Zambelli et al. (2009).
Results
Gene Expression Profiles Distinguishes Different GABAergic Cell Populations
The G42 transgenic GFP reporter line labels PCs, BskCs, and StCs throughout their postnatal development (Ango et al., 2004). We used G42 and a manual sorting procedure (Sugino et al., 2006) to purify BskC and StCs together (S/BCs, see Materials and Methods for details) and PCs from the cerebellar cortex from the first to the eighth postnatal week. The first time point for PC is P3, soon after the PCL is formed and the first time point for S/BCis P14 because they do not complete their migration until the second postnatal week. Total RNA from ∼50 PC and ∼150 S/BC were amplified by two rounds of linear amplifications followed by hybridization to Affymetrix mouse expression array 430.2. At least three biological replicates were analyzed for each developmental time point for each cell-type.
We performed a PCA (Raychaudhuri et al., 2000) on all postsynaptic protein transcripts, GABAergic transcripts as well as the top 1500 highly altered probesets (1943 probesets, 4.2% of total that showed changes in expression greater than 1 standard deviation of mean) across all samples. PCA clearly distinguished PCs and S/BCs between ages P14–56, whereas P3 and P7 PCs formed a separate cluster (Figures 1B–D). Such distinction was abolished when unrelated transcripts such as all B-cell activation, blood glycolipid biosynthesis, or glial expressed transcripts were used (Figures 1E–G). Gene expression profiles were compared between all stages to derive a correlation matrix that indicate the overall degree of similarity or relatedness between any two samples during circuit development. Gene-wise standardized expression values of TFs, CAMs, and GABA transmission transcripts were used to compute the Pearson correlation coefficients between two samples and the matrix containing all the values were plotted as a heatmap where the X and Y axis denotes the individual samples from each developmental stage. Developmentally PC and S/BC can each be segregated into two broad groups based on their expression of TFs and CAMs (Figures 1H,I) by cross-correlation analysis. Furthermore, the GABAergic transcripts parsed the developmental trajectory of PCs into three distinct epochs: P3–7, P14–21, and P28–56; the same analysis parsed S/BC trajectory into two epochs: P14–21 and P28–56 (Figure 1J). Compared to PC, the S/BC developmental profile are less robust probably due to the less homogeneous nature of this population. Our cell-type specific gene expression profiles could readily distinguish the PCs and S/BCs and further capture the distinct developmental epochs as they engage in circuit formation.
Temporal Expression Profiles Capture Elevated Biological Pathways at Different Developmental Stages
We conducted pathway enrichment analysis using KEGG database based on developmental gene expression of PCs and S/BCs (Figure 2A). Interestingly, a number of common biological pathways were elevated in both cell populations, but with different developmental timing that appears to correlate with their different maturation profiles. For example, between P3 and P7 in PCs pathways of “axon guidance,” “regulation of actin cytoskeleton,” “gap junction,” and “tight junctions” is highly upregulated indicating the early steps of circuit integration by PC. This is accompanied by an upregulation of other pathways (Figure 2A) such as insulin signaling, TGF-beta, Hedgehog, and Wnt which are important for axon guidance (Song et al., 2003; Charron and Tessier-Lavigne, 2007; Scolnick et al., 2008). Upregulation of GnRH signaling that has an modulatory effect on cerebellar neurons (Albertson et al., 2008) and P53 signaling which is important for PC survival (Gavino and Richard, 2011) was also observed during this time. In P14PCs, pathways related to “long-term potentiation,” “long-term depression,” “JAK/STAT,” “VEGF,” and “mTOR signaling” were elevated, which correlate to the development of parallel fiber synapses. The JAK/STAT, VGEF pathway is in general associated with postnatal brain development, differentiation, and survival but recently are also implicated in NMDAR-LTD (De-Fraja et al., 1998; Storkebaum et al., 2005; Nicolas et al., 2012) whereas mTOR signaling is involved in local protein synthesis in LTP (Kelleher et al., 2004). The apoptosis pathway was upregulated at P14 perhaps reflecting the known developmental death of a subset of PC cells (Dusart et al., 2006). Between P28 and 56, the upregulation of pathways related to “CAMs,” “chondroitin sulfate biosynthesis,” “focal adhesion,” “cytokine–cytokine receptor interaction,” and “extracellular matrix receptor interaction” (ECM-interaction) correlate with the maturation and stabilization of PC connectivity.
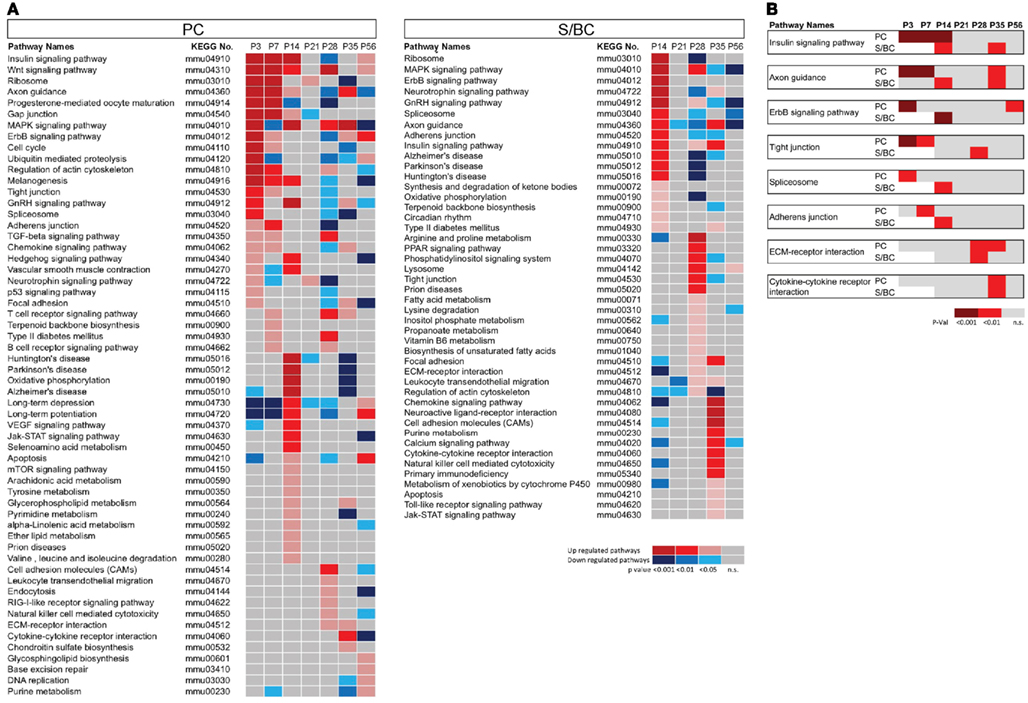
Figure 2. Pathway enrichment analysis of developmentally co-regulated transcripts in PC and S/BCs. (A) Pathways enriched at specific developmental stages in PCs (left) and S/BCs (right). Each colored box represents significant p-values of the associated pathway across the developmental stages that are either upregulated (red), down-regulated (blue), or non-significant enrichment (gray). (B) Comparison between PC and S/BCs shows delayed elevation of pathways involved in early postnatal development in S/BCs.
In S/BCs a number of similar pathways are also activated but delayed compared to PC (Figures 2A,B). For example, “axon guidance,” “tight junction,” “adherens junction,” “insulin signaling,” “ErbB,” and “spliceosome” pathways were upregulated in P14S/BCs, reflecting the delayed axogenesis of BskC and StC after they enter the ML during the second postnatal week. However between P28 and 35, similar to PC cells, pathways of “ECM-receptor interaction,” “CAMs,” “cytokine–cytokine receptor interaction,” “neuroactive ligand receptor interactions,” and “regulation of cytoskeleton” were activated; these correlate with the synaptic maturation and consolidation when BskCs elaborate and maintain pinceau synapses to the AIS of PC (Ango et al., 2004) and StC make multiple synaptic connections to PC dendrites (Ango et al., 2008).
Correlation between Co-Expressed Genes and Their Chromosome Co-Localization
Several studies have shown that genes that are co-regulated tend to localize as “clusters” along the chromosome (Boutanaev et al., 2002; Blanco et al., 2008). We therefore examined whether there is a correlation between developmental co-regulation and genomic co-localization in our dataset in PCs and S/BCs. We define a cluster as a set of co-regulated transcripts (upregulated, down-regulated, and up- and down-regulated with the same developmental profile) located within three ORF distances of each other. The number of the clusters detected in co-regulated genes was significantly higher than that would be expected by chance. In total we detected 4640 clusters in PCs across seven developmental stages and 1657 in S/BCs across five stages (Figure 3A). The clusters varied from 2 to13 genes with a size range from 194 Kb to 1.37 Mb, with an average of 279 (±79) Kb for PCs and 219 (±56) for S/BCs (Figures 3B,C). Surprisingly, more clusters were identified in the early postnatal ages (combined 2229 clusters in P3 and P7 PC; 1160 clusters in P14 S/BC) and at adult stage P56 (1896 and 440 clusters in PC and S/BC respectively) compared to intermediate stages (P21–P35; Figure 3A). Despite the highly correlated expression of TFs, CAMs, and GABAergic transcripts seen in PCs an S/BCs between P21 and 35 (Figures 1E–G) we found the co-transcribing genes were not significantly genomically co-localized.
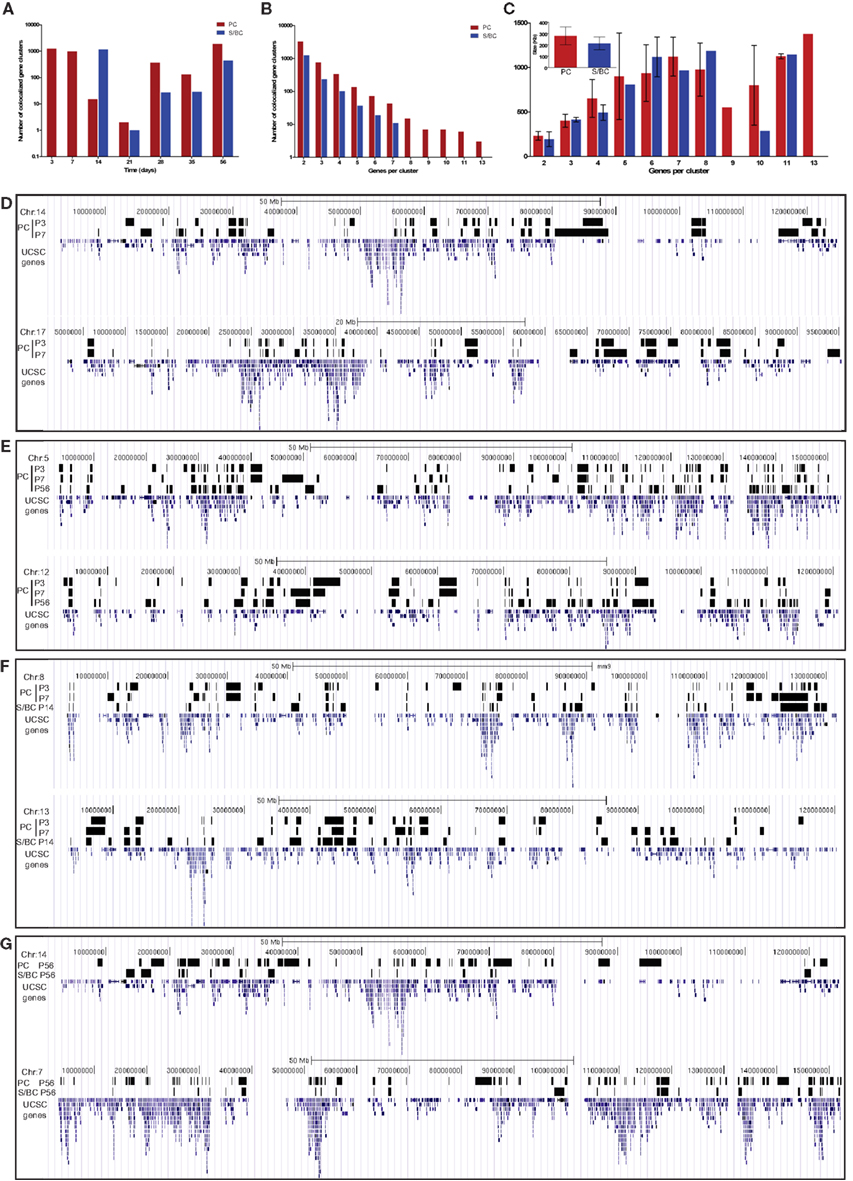
Figure 3. Co-expressed transcripts are often co-localized on the genome. (A) Distribution of total number of co-expressed and co-localized transcript between PC and S/BCs during development. (B) Frequency distribution of the different co-localized clusters. (C) Size distribution of different co-localized clusters in PC and S/BCs. Average size of all clusters across all time points for PC and S/BCs shown in inset. (D–G) Representative chromosomal distribution of co-localized and co-expressed transcripts at specific developmental stages. The region harboring co-expressed and co-localized clusters are depicted as black bar spanning across the starting and ending ORFs in UCSC genome browser (see UCSC track files in BED format Table S1 in Supplementary Material for PC and Table S2 in Supplementary Material for S/BC). Certain cluster groups are stable between developmental stages P3 and P7 in PCs [(D), see also Table A1 in Appendix]. Co-localized clusters can re-emerge in late-developmental stages as shown in PC cell by comparing the P3 and P7 time points with P56 (E). Representative common clusters across cell-types during early postnatal developmental stage (F). Few such clusters are common between cell-types in late-adult stages suggesting the maintenance of a “locked-in” differentiated state (G).
Within the same cell-type such as PC, 418 gene clusters maintained their co-expression between P3 and P7 (Figure 3D). KEGG pathway analysis of these stable gene pairs identified “regulation of actin cytoskeleton,” “pentose phosphate pathway,” and “ribosome” to be enriched (Table A1 in Appendix). Interestingly, in both PCs and S/BCs from P21 to P35 few or no such stable clusters were detected, but these clusters re-emerge at later ages. For example in PC, 234 gene pairs were conserved between P3 and P56 stages and 311 between P7 and P56 (Figure 3E). Furthermore, we also identified conserved and co-expressed gene clusters between cell-types, such as 212 common gene pairs between P14 S/BCs and P3 PCs as well as157 pairs between P14 S/BCs and P7 PCs (Figure 3F). However, 119 common gene pairs were found between mature PCs and S/BCs at P56 (Figure 3G). It is possible that these co-expressed genomic clusters may constitute common “regulatory modules” across cell-types that encode components of functional pathways and are subjected to chromatin regulation during neural development and the relatively lower common clusters between cell-type in adults reflects the post-maturation state.
Molecular Signatures of Developing PCs and S/BCs
We examined whether different classes of genes are coordinately expressed in PCs and S/BCs that correlate with their developmental and physiological phenotypes.
GABA transmission transcripts
In PC cells, we detected the known sharp changes in GABA(A) receptor subunits (a shift from α2 to α1) between P7 and P14 (Figures 4A1 and A2 in Appendix), with a simultaneous upregulation of α2 at P14 followed by increase in α4 transcript. These temporal patterns correlate with the increase of GABAergic synaptic innervation and transmission from BskCs and StCs during this period. Gabra4 is known to be responsive to positive GABA modulatory neurosteroids (Zhou and Smith, 2009), mediate extra-synaptic inhibition (Chandra et al., 2006), and has been implicated in regulating inhibitory tone (Smith and Gong, 2005). In S/BCs, the Gabrb3 subunit is upregulated at P21 followed by Gabra3 and the extra-synaptic receptors Gabre and Gabrq at P35. The high-affinity Gabrb3 (GABA-A b3) is also extra-synaptic and is involved in slower tonic inhibition, affecting neuronal excitability, and network activity (Huntsman et al., 1999; Nusser et al., 2001; Hentschke et al., 2009). Finally at P56 Gabrb1, Gabra4, Gabrg1 are upregulated (Figure 4A3).
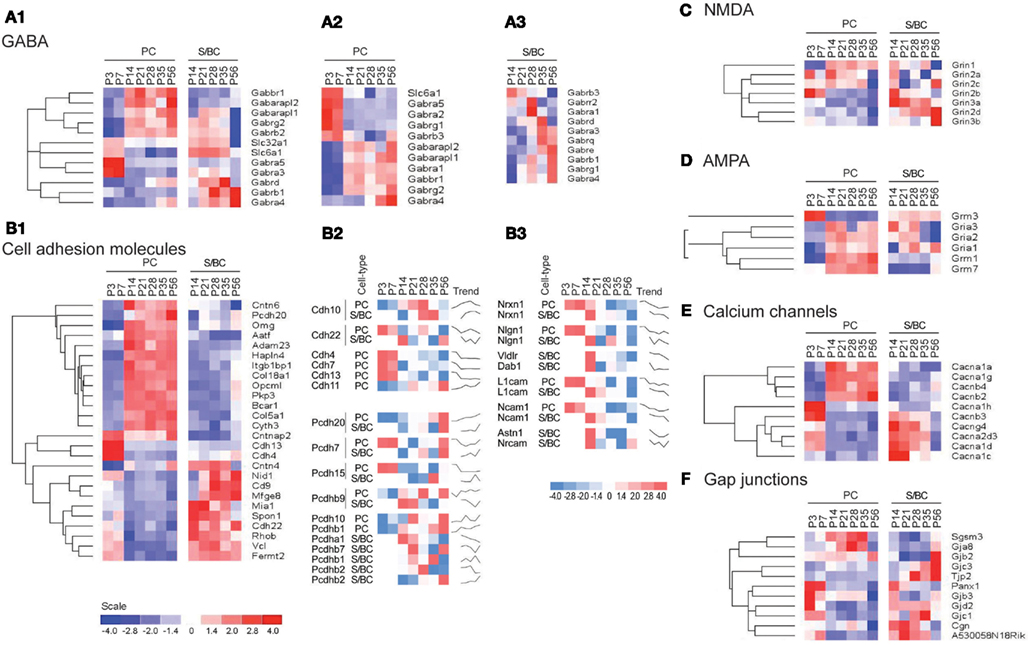
Figure 4. Cell-type specific phasic temporal profiles of several classes of transcripts. (A1) Cell-type specific GABAergic transcripts between cell-types, (A2,A3) PC and SB individual temporal profiles are shown. (B1) Cell-type specific cell adhesion molecules (CAMs) transcripts, (B2,B3) PC and SB specific individual profiles are shown. (C) Cell-type specific expression of NMDA receptors, (D) AMPA receptors, (E) Calcium channels, and (F) Gap junction molecules.
Cell adhesion molecules
CAMs are expressed in two broad groups in PCs and S/BCs, respectively (Figure 4B1). In PC, Cdh13, and Cdh4 are expressed during the early postnatal stages; Col18a1, Bcar1, Cntnap2, Aatf, Adam23 continue expression up until P56. Nid1, Cd9, Mfged8, and Mia1 are restricted to S/BC. In situ data on eight transcripts in the Allen Brain Atlas (ABA) developmental mouse ISH database8 matched our findings (Figures A1 and A2 in Appendix). Distinct developmental expression of CAMs in PCs and S/BCs might contribute to the formation, maturation, and maintenance of pre- and post-synaptic components (Figures 4B2,B3). In S/BCAstn1, implicated in neuronal migration (Zheng et al., 1996), peaked at P14 which correlates with their migration during this period. Interestingly cadherins and protocadherins showed interesting temporal patterns as well and we also found developmental co-expression of the same cadherins (e.g., Cdh10 and Cdh22) and protocadherins (e.g., Pcdh20, Pcdh7, and Pcdh9) between PC and S/BC.
Glutamate receptors
Past studies suggested the absence of functional NMDA receptors in PC cells (Farrant and Cull-Candy, 1991; Llano et al., 1991), however in agreement with recent observations we detect the expression of Grin2b between P3 and 7, Grin2a and Grin2c between P14 and 35 and the obligatory Grin1 from P14 onwards in PC (Casado et al., 2002; Piochon et al., 2007, 2010; Renzi et al., 2007; Bidoret et al., 2009; Figure 4C). In S/BCs we further detected specific expression of Grin3a and Grin3b subunits, which are known to have atypical channel properties (Sucher et al., 1996; Matsuda et al., 2002; Figure A3 in Appendix). Metabotropic glutamate receptorsGrm1 and Grm7 are expressed at high levels in PC whereas S/BC expressed Grm3 between P14 and 56 (Figure 4D), which has a relatively weaker expression in StC compared to Golgi cells (Ohishi et al., 1993; Figure A3 in Appendix). The functional significance of these expression patterns should be examined by electrophysiology experiments.
Calcium channels
We found high level expression of Cacna1a (Westenbroek et al., 1995), Cacna1g (Talley et al., 1999), Cacna1h, and Cacnb4 transcripts in PCs (Figure 4E; Figure A4 in Appendix). While the P/Q type calcium channel Cacna1a (Cav2.1) is characteristic of PC (Hashimoto et al., 2011), the T-type channels (such as Cacna1g or, Cav3.1 and Cacna1h or, Cav3.2) are expressed in cells with pacemaker activity (Yunker et al., 2003; Engbers et al., 2012), can play a key role at the AIS in generating spike bursts (Bender and Trussell, 2009) and implicated in rebound potentiation of inhibitory synaptic signals in cerebellar PCs (Kano et al., 1992; Tempia and Konnerth, 1994; Cueni et al., 2009). On the other hand, the expression of L-type calcium channel subunits Cacna1c, Cacna1d, and associated gamma subunit Cacng4 appear restricted to S/BCs. Cacna1c (Cav1.2) and Cacna1d (Cav1.3) are often co-expressed in the same cell on dendrites and dendritic spines with slow activation kinetics and large conductance (Lipscombe et al., 2004). They regulate a multitude of neuronal processes including gene expression, neuronal survival, synaptic efficacy, suppressing spontaneous intracellular calcium oscillations, and slow rhythmic firing.
Gap junction proteins
Gap junctions create a direct cytoplasmic connection between neurons and form electrical synapses that contribute to various network rhythmic activities (LeBeau et al., 2003; Middleton et al., 2008). We found gap junction transcripts Sgsm3 (Rutbc3) and Gja8 (CX50) in PCs, and Tjp2 and Gjc3 in S/BC at adult stages (Figure 4F; Figure A4 in Appendix). Gjd2 (CX36), Gjc1 (CX45), Gjb3, and Panx1 are expressed in PCs in the first week and in S/BCs from P14 onward. CX36 and CX45 shape the spontaneous firing during retina development (Blankenship et al., 2011) and might play a similar role in cerebellar circuit formation.
We found co-expression of GABA-B receptors, mGluR1, P/Q type and T-type calcium channels, and cytohesins in PC. Interestingly postsynaptic GABA-B receptors, P/Q and T-type can functionally interact with mGluR1-mediated excitatory transmission at PF-PC synapses (Hirono et al., 2001; Gugger et al., 2012), where as cytohesins, a group of guanine nucleotide exchange factors (GEFs), also forms a postsynaptic complex with mGluR1 (Kitano et al., 2003).
Differential Expression of Transcription Factors between Cell-Types
We queried 1266 out of 1675 non-redundant TFs (∼75.5%) from the Riken Transcription Factor Database (TFdb; Kanamori et al., 2004) in our expression dataset and found 79 to be differentially expressed between PCs and S/BCs and during development (Figure 5A). Twenty-nine TFs were highly expressed in PCs, such as Ebf1 (Olf1), Ebf2, Ebf3 (Malgaretti et al., 1997; Croci et al., 2006), Lhx1 (Zhao et al., 2007), FoxP2 (Fujita and Sugihara, 2012), and Plagl1 (Zac1; Chung et al., 2011). Other PC restricted TFs are novel such as Fem1c, Sh3d19, Aatf, Ankrd6, Ank1, Otf1 (Pou2f1), Gas7, Nfatc2 (Nfat1), Nptxr (Npr), Gtf2h4, and Bcll2a (Ctip1). NFATs are best studied in immune system and chondrocytes differentiation (Horsley and Pavlath, 2002) but their role in neuronal differentiation is less clear. On the other hand at least five TFs appear S/BC specific, Sox1, Sox2, Klf4, Epas1, and Rorb. The postmitotic expression of Sox1, Sox2, Myst4, and Klf4 transcripts in S/BC is surprising as they maintain neuronal progenitor identity and neurogenesis in early development (Graham et al., 2003). However recent evidence suggest that continued postmitotic expression of Sox1 is necessary for maintaining cell-fate (Ekonomou et al., 2005). We also detected 35 TFs that had early (P3–P7) expression in PC but later became specifically enriched in S/BC from P14 to P56; these includeTcfap2b, Btbd11, Esrrg, Klf12, and Egr1 which showed high level and tightly restricted expression.
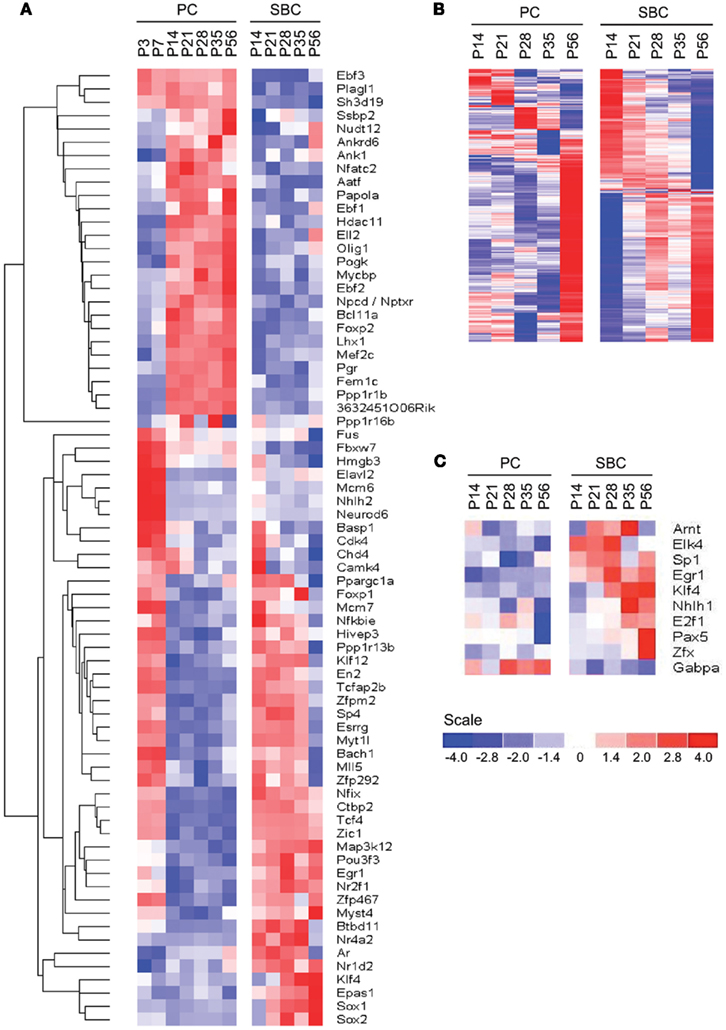
Figure 5. Cell-type specific expression of TFs. (A) Phasic expression of TFs between PC and S/BCs. (B,C) Identification of cell-type specific TFs by promoter scanning of co-regulated transcripts during development. (B) Observed cell-type specific co-regulated transcripts at each time points in both PC and S/BCs. (C) Promoter scanning for binding motifs of temporally co-regulated transcripts correctly identifies S/BC and PC TFs that match with cell-type specific microarray data.
We noticed co-expressed transcripts in virtually all-developmental stages of PC and S/BC, suggesting the possibility that these transcripts may be regulated by common TFs (Figure 5B). We reasoned that by scanning promoters of co-expressed genes for known TF binding motifs we could identify the relevant TFs in PCs and S/BCs. We investigated upstream (−450 bp) and immediate downstream (+50 bp) regions relative to the transcription start site for statistically significant enrichment of TF binding sites using PSCAN (Zambelli et al., 2009) that looks for over-represented binding motifs from public JASPAR database (Sandelin et al., 2004; Bryne et al., 2008). In S/BCs, we found 13 TFs at P14 and 6 TFs at P56. In PCs, we found two TF at P14 and four TFs at P56 (Table 1). We were limited by motif database (130 TF for mouse), which is a fraction of the currently known 1675 mouse TFs from the Riken-TFdb. Cross comparison against our microarray data revealed that seven TFs predicted by PSCAN were also detected in microarray to be S/BC specific:Egr1 at both P14 and 56; Elk4 at P14; Zfx, Sp1, Klf4, and Tcfap2a at P56 (Figure 5C). In PCs, Gabpa expression was in agreement with P56 microarray data.
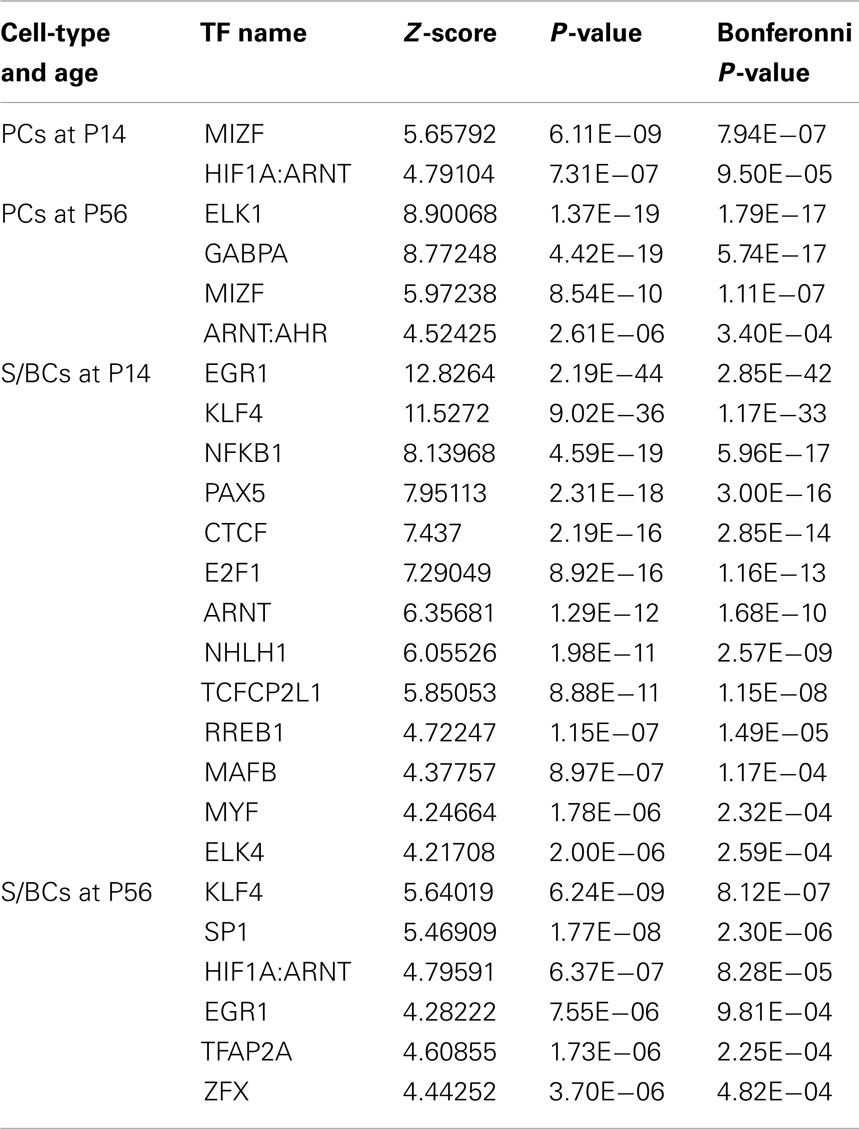
Table 1. PSCAN results for PC and S/BC showing TF enriched among the co-expressed transcripts at P14 and P56 time points.
Novel Subtype Specific Transcripts in Stellate/Basket Cells
We detected not only genes previously shown to be expressed in PCs and/or S/BCs (Figure 6A), but also novel S/BC specific transcripts. For example, while the Kit ligand (Kit-l) was known to be expressed in PCs, we found that the transcript for its receptor, the Kit oncogene (c-Kit), was restricted to S/BCs (Morii et al., 1992), suggesting the involvement of this ligand receptor system in PC-S/BC interactions. In S/BCs, we found 38 new transcripts, of which 19 are not expressed in PCs (Figure 6A). Eight of these were validated (Figures 6B–J) by in situ hybridization. These appear to be primarily expressed in basket cells and could potentially serve as specific markers. Acam and Arhgap21 signal was not appreciably down-regulated at P56 in S/BC compared to earlier stages which could be due to the chromogenic detection method that causes a loss in dynamic range.
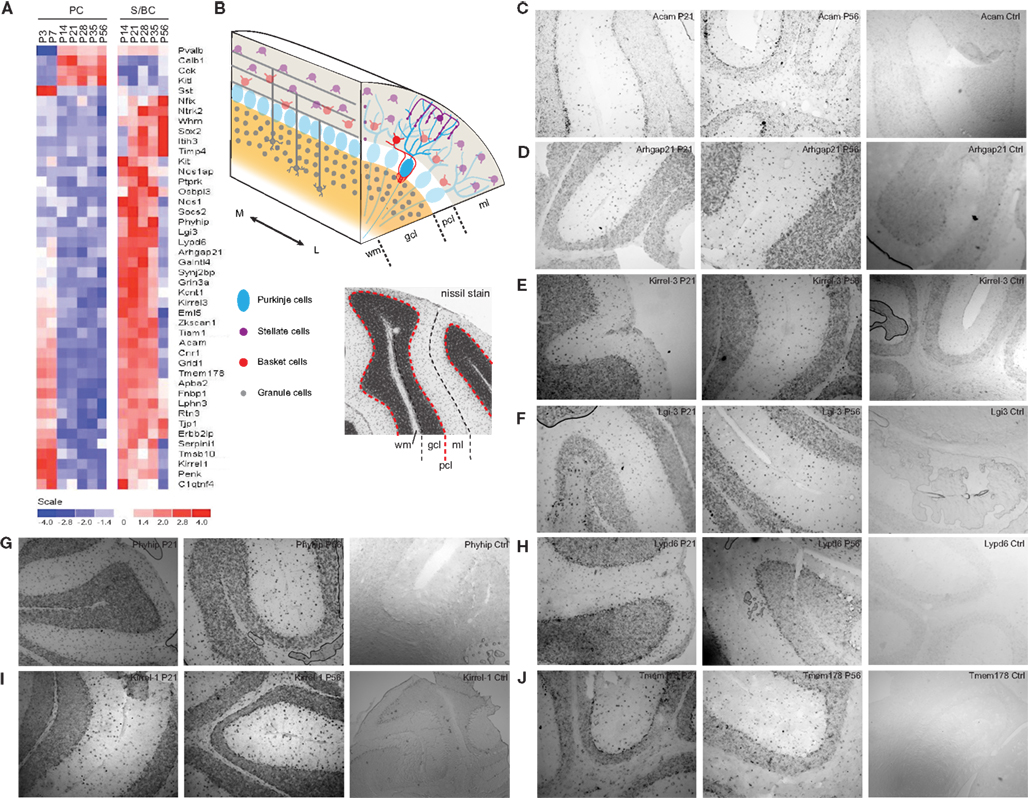
Figure 6. Expression of PC and S/BCs specific transcripts. (A) Heatmap showing novel cell-type specific transcripts and their developmental profiles. (B) Schematic diagram of the cerebellar and nissl stained cerebellum section indicating respective layers. (C–J) In situ hybridization panels of the novel S/BC transcripts validating the microarray data. Each panel shows two time points P21, P56, and control probes. Abbreviations: gcl, granule cell layer; ml, molecular layer; pcl, Purkinje cell layer; wm, white matter; M, medial; L, lateral.
Discussion
Previous studies have assayed gene expression of whole cerebellum using tissue homogenates (Kagami and Furuichi, 2001; Kanamori et al., 2004; Sato et al., 2008). Due to cellular heterogeneity, these results are difficult to interpret in the context of cerebellar circuit organization and development. Individual neuron types are both the building blocks of neural circuits and the basic units of gene regulation. Here we purified two major GABAergic cell-types of the cerebellar cortex and measured the developmental progression in their transcriptomes from neonatal to mature ages.
Several methods have been used to achieve cell-type-based gene expression profiling in mice through cell specific expression of fluorescence reporters (e.g., FACS, manual sorting) or molecular tags (e.g., TRAP, Ribo-Tag; Okaty et al., 2011). The TRAP and Ribo-Tag methods allow direct immunoprecipitation of cell specific mRNAs from tissue homogenates using GFP-tagged ribosomal proteins but often require careful optimization of specificity and pooling of multiple tissue samples (Heiman et al., 2008; Sanz et al., 2009). Manual sorting has the advantage that even a small number or fraction of fluorescence-labeled neurons among dissociated cells can be visually identified and purified. Compared with FACS, manual sorting exerts less physical manipulation of dissociated neurons and allows direct evaluation of the sorting process by the experimenter. For example, although there are no specific reporters that differentially label PCs, BskCs, and StCs, we were able to readily distinguish PCs and S/BCs simply by their cell sizes using the G42 line that labels both. A caveat of the cell sorting method, whether FACS or manual, is that certain aspect of gene expression might be altered by the dissociation procedure (see Okaty et al., 2011 for a discussion).
A major motivation in analyzing the development progression of gene expression in PCs and S/BCs is that StC and BskC interneurons establish GABAergic synaptic transmission with PC cells during the postnatal period. In this context our study may reveal coordinated expression programs in postsynaptic PCs and presynaptic S/BCs that direct the formation and transmission of these inhibitory synapses. We noted developmental co-expression of members of cadherins and protocadherins in PC and S/BC. Cdh10 and Cdh22 showed strikingly similar expression pattern in PC and S/BC. Cdh10 expression rose gradually, peaked at P28, and declined at P35. Cdh22 has two expression peaks: the early peak (P3–P14) may correlate to the initial interactions between S/BC and PCs and the late peak(P28) might contribute to GABAergic synapse maturation and maintenance (Figure 4B2). The involvement of Pcdhα in Reelin signaling is well-known (Senzaki et al., 1999). Here we found that members of non-clustered Pcdh (Pcdhδ) family (Pcdh20, Pcdh7, and Pcdh9) are comparably co-expressed in PC and S/BC (Figure 4B2). Pcdhs are proteolytically cleaved by disintegrins, such as ADAMs with metalloprotease activity (Reiss et al., 2006). We found that PCs preferentially expressed Adam23, which might regulate co-expressed Pcdh and modulate cell–cell adhesion. Finally, the CAMs Cntnap2 (Caspr2) is repressed by the TF Foxp2 (Fujita and Sugihara, 2012) through direct binding at the Cntnap2 promoter (Vernes et al., 2008). We found that the rise ofFoxp2expression at P14 in PCs (Figure 5A) precisely correlated to the abrupt drop in Cntnap2 transcript (Figure 4B1).
During the characteristic shift of GABA-A receptor subunit from α2 to α1 in PCs between P7 and 14, we found an upregulation in the Slc32a1 (VGAT) and Slc6a1 (GAT1) in the S/BCs (Figures 4A1 and A2 in Appendix), suggesting coordinated regulation of post- and pre-synaptic components, respectively. On the other hand, PCs are also postsynaptic to glutamatergic parallel fibers and climbing fibers; they are also presynaptic to multiple neurons (especially those in the deep cerebellar nuclei). In addition, S/BCs are postsynaptic to glutamatergic and GABAergic inputs. Therefore, gene expression profiles in PCs and S/BCs may contain multiple pathways, each contributing to distinct pre- and post-synaptic development. Identifying the molecules and relevant pathways in PCs and S/BCs profiles that contribute to S/BC → PC GABAergic synapses would require careful validation of their subcellular localization and function. Even though this study treats S/BC as a group, there are known differences in morphology and subcellular synapse targeting between BskC-PC and StC-PC, which could be molecularly distinct. However such unique molecular correlates can only be discovered upon sorting the two cell-types to purity.
Several studies have shown that genes that are co-regulated tend to localize as clusters along the chromosome (Boutanaev et al., 2002; Blanco et al., 2008). Here we provide evidence that, in developing cerebellar GABAergic neurons, groups of co-expressed genes also tend co-localize as clusters in the genome, ranging from two genes to large stretches of 13 genes. We interpret these naturally arising co-transcribing gene clusters during key developmental stages to be the transcript level readout of epigenetic control. Interestingly, a significant fraction of such clusters are co-expressed in both PCs and S/BCs, although at different postnatal ages. In addition, many of the clusters appear to be co-regulated during development: for example, in PCs they are turned on in the first postnatal week, turned off in subsequent weeks, and turned back on in the mature age (P56). Such developmental co-expression in different cell-types suggest that certain groups of genes which localize as genomic clusters may constitute “chromosome regulatory modules” that encode components of functional pathways; they are deployed in different cell-types at the appropriate stage to support the relevant neural developmental events. In this context the discovery of abundant levels of 5-methylcytosine, an unusual nuclear DNA base in PC (Kriaucionis and Heintz, 2009) and its correlation with gene expression (Ficz et al., 2011) is intriguing and need to be further explored by informatics analysis and by experimental validation.
In PCs a sharp change in expression profile was noted from P7 to P14, which might reflect the abrupt changes in morphology, positioning, physiology, and connectivity of the PCs during this period (Dusart and Flamant, 2012). Pathway terms such as “LTD,” “LTP,” “VEGF signaling,” “JAK/STAT signaling,” “mTOR signaling,” and “apoptosis” are all sharply upregulated at P14 correlating to the elimination of PCs, rapid dendritic maturation, beginning of inhibitory synaptogenesis and the increased demand for local protein synthesis associated with LTP and LTD events (Figure 2A). Concomitantly there is a decline in pathway terms “chemokine signaling,” “Hedgehog signaling,” and “axon guidance” (Figures 2A,B).
Although numerous PC specific genes have been identified, few such genes have been found for BskC and StCs. In our study we grouped StC and BskC due the lack of molecular markers but our microarray and in situ data suggests candidate genes that can be exploited for such purpose. Our results on S/BC specific transcripts present opportunities for discovering subtype specific genes for generating Cre-driver mice that can separately target StCs and BskCs, as have been implemented for cortical interneurons (Taniguchi et al., 2011).
Author Contributions
Anirban Paul and Z. Josh Huang designed research; Anirban Paul performed all experiments; Anirban Paul, Ying Cai, and Gurinder S. Atwal analyzed data; Anirban Paul and Z. Josh Huang wrote the paper.
Conflict of Interest Statement
The authors declare that the research was conducted in the absence of any commercial or financial relationships that could be construed as a potential conflict of interest.
Acknowledgments
We thank Christopher Johns and Sohail Khan at the Cold Spring Harbor Laboratory, microarray core facility for technical support; Pragya Kakani and Akash Abbi for her help in RNA in situ. This work is in part funded by the Robertson Neuroscience Fund at CSHL.
Supplementary Material
The Supplementary Material for this article can be found online at http://www.frontiersin.org/Neural_Circuits/10.3389/fncir.2012.00037/abstract
Footnotes
References
Albertson, A. J., Talbott, H., Wang, Q., Jensen, D., and Skinner, D. C. (2008). The gonadotropin-releasing hormone type I receptor is expressed in the mouse cerebellum. Cerebellum 7, 379–384.
Altman, J., and Bayer, S. A. (1997). Development of the Cerebellar System: In Relation to its Evolution, Structure, and Functions. New Hampshire: CRC Press.
Ango, F., di Cristo, G., Higashiyama, H., Bennett, V., Wu, P., and Huang, Z. J. (2004). Ankyrin-based subcellular gradient of neurofascin, an immunoglobulin family protein, directs GABAergic innervation at Purkinje axon initial segment. Cell 119, 257–272.
Ango, F., Wu, C., Van der Want, J. J., Wu, P., Schachner, M., and Huang, Z. J. (2008). Bergmann glia and the recognition molecule CHL1 organize GABAergic axons and direct innervation of Purkinje cell dendrites. PLoS Biol. 6, e103. doi:10.1371/journal.pbio.0060103
Bender, K. J., and Trussell, L. O. (2009). Axon initial segment Ca2+ channels influence action potential generation and timing. Neuron 61, 259–271.
Bidoret, C., Ayon, A., Barbour, B., and Casado, M. (2009). Presynaptic NR2A-containing NMDA receptors implement a high-pass filter synaptic plasticity rule. Proc. Natl. Acad. Sci. U.S.A. 106, 14126–14131.
Blanco, E., Pignatelli, M., Beltran, S., Punset, A., Pérez-Lluch, S., Serras, F., Guigó, R., and Corominas, M. (2008). Conserved chromosomal clustering of genes governed by chromatin regulators in Drosophila. Genome Biol. 9, R134.
Blankenship, A. G., Hamby, A. M., Firl, A., Vyas, S., Maxeiner, S., Willecke, K., and Feller, M. B. (2011). The role of neuronal connexins 36 and 45 in shaping spontaneous firing patterns in the developing retina. J. Neurosci. 31, 9998–10008.
Boutanaev, A. M., Kalmykova, A. I., Shevelyov, Y. Y., and Nurminsky, D. I. (2002). Large clusters of co-expressed genes in the Drosophila genome. Nature 420, 666–669.
Bryne, J. C., Valen, E., Tang, M.-H. E., Marstrand, T., Winther, O., da Piedade, I., Krogh, A., Lenhard, B., and Sandelin, A. (2008). JASPAR, the open access database of transcription factor-binding profiles: new content and tools in the 2008 update. Nucleic Acids Res. 36, D102–D106.
Cameron, D. B., Kasai, K., Jiang, Y., Hu, T., Saeki, Y., and Komuro, H. (2009). Four distinct phases of basket/stellate cell migration after entering their final destination (the molecular layer) in the developing cerebellum. Dev. Biol. 332, 309–324.
Casado, M., Isope, P., and Ascher, P. (2002). Involvement of presynaptic N-methyl-D-aspartate receptors in cerebellar long-term depression. Neuron 33, 123–130.
Chandra, D., Jia, F., Liang, J., Peng, Z., Suryanarayanan, A., Werner, D. F., Spigelman, I., Houser, C. R., Olsen, R. W., Harrison, N. L., and Homanics, G. E. (2006). GABAA receptor alpha 4 subunits mediate extrasynaptic inhibition in thalamus and dentate gyrus and the action of gaboxadol. Proc. Natl. Acad. Sci. U.S.A. 103, 15230–15235.
Charron, F., and Tessier-Lavigne, M. (2007). The Hedgehog, TGF-beta/BMP and Wnt families of morphogens in axon guidance. Adv. Exp. Med. Biol. 621, 116–133.
Chung, S.-H., Marzban, H., Aldinger, K., Dixit, R., Millen, K., Schuurmans, C., and Hawkes, R. (2011). Zac1 plays a key role in the development of specific neuronal subsets in the mouse cerebellum. Neural Dev. 6, 25.
Croci, L., Chung, S.-H., Masserdotti, G., Gianola, S., Bizzoca, A., Gennarini, G., Corradi, A., Rossi, F., Hawkes, R., and Consalez, G. G. (2006). A key role for the HLH transcription factor EBF2COE2,O/E-3 in Purkinje neuron migration and cerebellar cortical topography. Development 133, 2719–2729.
Cueni, L., Canepari, M., Adelman, J., and Lüthi, A. (2009). Ca2+ signaling by T-type Ca2+ channels in neurons. Pflugers Arch. 457, 1161–1172.
D’Angelo, E., Mazzarello, P., Prestori, F., Mapelli, J., Solinas, S., Lombardo, P., Cesana, E., Gandolfi, D., and Congi, L. (2011). The cerebellar network: from structure to function and dynamics. Brain Res. Rev. 66, 5–15.
De-Fraja, C., Conti, L., Magrassi, L., Govoni, S., and Cattaneo, E. (1998). Members of the JAK/STAT proteins are expressed and regulated during development in the mammalian forebrain. J. Neurosci. Res. 54, 320–330.
Dusart, I., and Flamant, F. (2012). Profound morphological and functional changes of rodent Purkinje cells between the first and the second postnatal weeks: a metamorphosis? Front. Neuroanat. 6:11. doi:10.3389/fnana.2012.00011
Dusart, I., Guenet, J. L., and Sotelo, C. (2006). Purkinje cell death: differences between developmental cell death and neurodegenerative death in mutant mice. Cerebellum 5, 163–173.
Ekonomou, A., Kazanis, I., Malas, S., Wood, H., Alifragis, P., Denaxa, M., Karagogeos, D., Constanti, A., Lovell-Badge, R., and Episkopou, V. (2005). Neuronal migration and ventral subtype identity in the telencephalon depend on SOX1. PLoS Biol. 3, e186. doi:10.1371/journal.pbio.0030186
Engbers, J. D. T., Anderson, D., Asmara, H., Rehak, R., Mehaffey, W. H., Hameed, S., McKay, B. E., Kruskic, M., Zamponi, G. W., and Turner, R. W. (2012). Intermediate conductance calcium-activated potassium channels modulate summation of parallel fiber input in cerebellar Purkinje cells. Proc. Natl. Acad. Sci. U.S.A. 109, 2601–2606.
Farrant, M., and Cull-Candy, S. G. (1991). Excitatory amino acid receptor-channels in Purkinje cells in thin cerebellar slices. Proc. Biol. Sci. 244, 179–184.
Ficz, G., Branco, M. R., Seisenberger, S., Santos, F., Krueger, F., Hore, T. A., Marques, C. J., Andrews, S., and Reik, W. (2011). Dynamic regulation of 5-hydroxymethylcytosine in mouse ES cells and during differentiation. Nature 473, 398–402.
Fujita, H., and Sugihara, I. (2012). FoxP2 expression in the cerebellum and inferior olive: development of the transverse stripe-shaped expression pattern in the mouse cerebellar cortex. J. Comp. Neurol. 520, 656–677.
Gavino, C., and Richard, S. (2011). Loss of p53 in quaking viable mice leads to Purkinje cell defects and reduced survival. Sci. Rep. 1, 84.
Graham, V., Khudyakov, J., Ellis, P., and Pevny, L. (2003). SOX2 functions to maintain neural progenitor identity. Neuron 39, 749–765.
Gugger, O. S., Hartmann, J., Birnbaumer, L., and Kapfhammer, J. P. (2012). P/Q type and T type calcium channels, but not type 3 transient receptor potential cation channels, are involved in inhibition of dendritic growth after chronic metabotropic glutamate receptor type 1 and protein kinase C activation in cerebellar Purkinje cells. Eur. J. Neurosci. 35, 20–33.
Hashimoto, K., Tsujita, M., Miyazaki, T., Kitamura, K., Yamazaki, M., Shin, H.-S., Watanabe, M., Sakimura, K., and Kano, M. (2011). Postsynaptic P/Q-type Ca2+ channel in Purkinje cell mediates synaptic competition and elimination in developing cerebellum. Proc. Natl. Acad. Sci. U.S.A. 108, 9987–9992.
Heiman, M., Schaefer, A., Gong, S., Peterson, J. D., Day, M., Ramsey, K. E., Suárez-Fariñas, M., Schwarz, C., Stephan, D. A., Surmeier, D. J., Greengard, P., and Heintz, N. (2008). A translational profiling approach for the molecular characterization of CNS cell types. Cell 135, 738–748.
Hentschke, H., Benkwitz, C., Banks, M. I., Perkins, M. G., Homanics, G. E., and Pearce, R. A. (2009). Altered GABAA,slow inhibition and network oscillations in mice lacking the GABAA receptor beta3 subunit. J. Neurophysiol. 102, 3643–3655.
Hirono, M., Yoshioka, T., and Konishi, S. (2001). GABAB receptor activation enhances mGluR-mediated responses at cerebellar excitatory synapses. Nat. Neurosci. 4, 1207–1216.
Horsley, V., and Pavlath, G. K. (2002). NFAT: ubiquitous regulator of cell differentiation and adaptation. J. Cell Biol. 156, 771–774.
Huntsman, M. M., Porcello, D. M., Homanics, G. E., DeLorey, T. M., and Huguenard, J. R. (1999). Reciprocal inhibitory connections and network synchrony in the mammalian thalamus. Science 283, 541–543.
Kagami, Y., and Furuichi, T. (2001). Investigation of differentially expressed genes during the development of mouse cerebellum. Brain Res. Gene Expr. Patterns 1, 39–59.
Kanamori, M., Konno, H., Osato, N., Kawai, J., Hayashizaki, Y., and Suzuki, H. (2004). A genome-wide and nonredundant mouse transcription factor database. Biochem. Biophys. Res. Commun. 322, 787–793.
Kano, M., Rexhausen, U., Dreessen, J., and Konnerth, A. (1992). Synaptic excitation produces a long-lasting rebound potentiation of inhibitory synaptic signals in cerebellar Purkinje cells. Nature 356, 601–604.
Kelleher, R. J. III, Govindarajan, A., and Tonegawa, S. (2004). Translational regulatory mechanisms in persistent forms of synaptic plasticity. Neuron 44, 59–73.
Kitano, J., Yamazaki, Y., Kimura, K., Masukado, T., Nakajima, Y., and Nakanishi, S. (2003). Tamalin is a scaffold protein that interacts with multiple neuronal proteins in distinct modes of protein-protein association. J. Biol. Chem. 278, 14762–14768.
Kriaucionis, S., and Heintz, N. (2009). The nuclear DNA base 5-hydroxymethylcytosine is present in Purkinje neurons and the brain. Science 324, 929–930.
LeBeau, F. E. N., Traub, R. D., Monyer, H., Whittington, M. A., and Buhl, E. H. (2003). The role of electrical signaling via gap junctions in the generation of fast network oscillations. Brain Res. Bull. 62, 3–13.
Leto, K., Rolando, C., and Rossi, F. (2012). The genesis of cerebellar GABAergic neurons: fate potential and specification mechanisms. Front. Neuroanat. 6:6. doi:10.3389/fnana.2012.00006
Lipscombe, D., Helton, T. D., and Xu, W. (2004). L-Type calcium channels: the low down. J. Neurophysiol. 92, 2633–2641.
Llano, I., Marty, A., Armstrong, C. M., and Konnerth, A. (1991). Synaptic- and agonist-induced excitatory currents of Purkinje cells in rat cerebellar slices. J. Physiol. 434, 183–213.
Malgaretti, N., Pozzoli, O., Bosetti, A., Corradi, A., Ciarmatori, S., Panigada, M., Bianchi, M. E., Martinez, S., and Consalez, G. G. (1997). Mmot1, a new helix-loop-helix transcription factor gene displaying a sharp expression boundary in the embryonic mouse brain. J. Biol. Chem. 272, 17632–17639.
Matsuda, K., Kamiya, Y., Matsuda, S., and Yuzaki, M. (2002). Cloning and characterization of a novel NMDA receptor subunit NR3B: a dominant subunit that reduces calcium permeability. Brain Res. Mol. Brain Res. 100, 43–52.
Middleton, S. J., Racca, C., Cunningham, M. O., Traub, R. D., Monyer, H., Knöpfel, T., Schofield, I. S., Jenkins, A., and Whittington, M. A. (2008). High-frequency network oscillations in cerebellar cortex. Neuron 58, 763–774.
Morii, E., Hirota, S., Kim, H. M., Mikoshiba, K., Nishimune, Y., Kitamura, Y., and Nomura, S. (1992). Spatial expression of genes encoding c-kit receptors and their ligands in mouse cerebellum as revealed by in situ hybridization. Brain Res. Dev. Brain Res. 65, 123–126.
Nicolas, C. S., Peineau, S., Amici, M., Csaba, Z., Fafouri, A., Javalet, C., Collett, V. J., Hildebrandt, L., Seaton, G., Choi, S.-L., Sim, S. E., Bradley, C., Lee, K., Zhuo, M., Kaang, B. K., Gressens, P., Dournaud, P., Fitzjohn, S. M., Bortolotto, Z. A., Cho, K., and Collingridge, G. L. (2012). The JAK/STAT pathway is involved in synaptic plasticity. Neuron 73, 374–390.
Nusser, Z., Kay, L. M., Laurent, G., Homanics, G. E., and Mody, I. (2001). Disruption of GABA(A) receptors on GABAergic interneurons leads to increased oscillatory power in the olfactory bulb network. J. Neurophysiol. 86, 2823–2833.
Ohishi, H., Shigemoto, R., Nakanishi, S., and Mizuno, N. (1993). Distribution of the mRNA for a metabotropic glutamate receptor (mGluR3) in the rat brain: an in situ hybridization study. J. Comp. Neurol. 335, 252–266.
Okaty, B. W., Sugino, K., and Nelson, S. B. (2011). A quantitative comparison of cell-type-specific microarray gene expression profiling methods in the mouse brain. PLoS ONE 6, e16493. doi:10.1371/journal.pone.0016493
Piochon, C., Irinopoulou, T., Brusciano, D., Bailly, Y., Mariani, J., and Levenes, C. (2007). NMDA receptor contribution to the climbing fiber response in the adult mouse Purkinje cell. J. Neurosci. 27, 10797–10809.
Piochon, C., Levenes, C., Ohtsuki, G., and Hansel, C. (2010). Purkinje cell NMDA receptors assume a key role in synaptic gain control in the mature cerebellum. J. Neurosci. 30, 15330–15335.
Raychaudhuri, S., Stuart, J. M., and Altman, R. B. (2000). Principal components analysis to summarize microarray experiments: application to sporulation time series. Pac. Symp. Biocomput. 5, 455–466.
Reiss, K., Maretzky, T., Haas, I. G., Schulte, M., Ludwig, A., Frank, M., and Saftig, P. (2006). Regulated ADAM10-dependent ectodomain shedding of γ-protocadherin C3 modulates cell-cell adhesion. J. Biol. Chem. 281, 21735–21744.
Renzi, M., Farrant, M., and Cull-Candy, S. G. (2007). Climbing-fibre activation of NMDA receptors in Purkinje cells of adult mice. J. Physiol. (Lond.) 585, 91–101.
Sandelin, A., Alkema, W., Engström, P., Wasserman, W. W., and Lenhard, B. (2004). JASPAR: an open-access database for eukaryotic transcription factor binding profiles. Nucleic Acids Res. 32, D91–D94.
Sanz, E., Yang, L., Su, T., Morris, D. R., McKnight, G. S., and Amieux, P. S. (2009). Cell-type-specific isolation of ribosome-associated mRNA from complex tissues. Proc. Natl. Acad. Sci. U.S.A. 106, 13939–13944.
Sato, A., Sekine, Y., Saruta, C., Nishibe, H., Morita, N., Sato, Y., Sadakata, T., Shinoda, Y., Kojima, T., and Furuichi, T. (2008). Cerebellar development transcriptome database (CDT-DB): profiling of spatio-temporal gene expression during the postnatal development of mouse cerebellum. Neural. Netw. 21, 1056–1069.
Scolnick, J. A., Cui, K., Duggan, C. D., Xuan, S., Yuan, X.-B., Efstratiadis, A., and Ngai, J. (2008). Role of IGF signaling in olfactory sensory map formation and axon guidance. Neuron 57, 847–857.
Senzaki, K., Ogawa, M., and Yagi, T. (1999). Proteins of the CNR family are multiple receptors for reelin. Cell 99, 635–647.
Smith, S. S., and Gong, Q. H. (2005). Neurosteroid administration and withdrawal alter GABAA receptor kinetics in CA1 hippocampus of female rats. J. Physiol. (Lond.) 564, 421–436.
Song, J., Wu, L., Chen, Z., Kohanski, R. A., and Pick, L. (2003). Axons guided by insulin receptor in Drosophila visual system. Science 300, 502–505.
Storey, J. D. (2003). The positive false discovery rate: a Bayesian interpretation and the q-value. Ann. Stat. 31, 2013–2035.
Storey, J. D., and Storey, J. D. (2002). A direct approach to false discovery rates, a direct approach to false discovery rates. J. R. Stat. Soc. Series B Stat. Methodol. 64, 479–498.
Storkebaum, E., Lambrechts, D., Dewerchin, M., Moreno-Murciano, M.-P., Appelmans, S., Oh, H., Van Damme, P., Rutten, B., Man, W. Y., De Mol, M., Wyns, S., Manka, D., Vermeulen, K., Van Den Bosch, L., Mertens, N., Schmitz, C., Robberecht, W., Conway, E. M., Collen, D., Moons, L., and Carmeliet, P. (2005). Treatment of motoneuron degeneration by intracerebroventricular delivery of VEGF in a rat model of ALS. Nat. Neurosci. 8, 85–92.
Sucher, N. J., Awobuluyi, M., Choi, Y. B., and Lipton, S. A. (1996). NMDA receptors: from genes to channels. Trends Pharmacol. Sci. 17, 348–355.
Sugino, K., Hempel, C. M., Miller, M. N., Hattox, A. M., Shapiro, P., Wu, C., Huang, Z. J., and Nelson, S. B. (2006). Molecular taxonomy of major neuronal classes in the adult mouse forebrain. Nat. Neurosci. 9, 99–107.
Talley, E. M., Cribbs, L. L., Lee, J. H., Daud, A., Perez-Reyes, E., and Bayliss, D. A. (1999). Differential distribution of three members of a gene family encoding low voltage-activated (T-type) calcium channels. J. Neurosci. 19, 1895–1911.
Taniguchi, H., He, M., Wu, P., Kim, S., Paik, R., Sugino, K., Kvitsiani, D., Kvitsani, D., Fu, Y., Lu, J., Lin, Y., Miyoshi, G., Shima, Y., Fishell, G., Nelson, S. B., and Huang, Z. J. (2011). A resource of Cre driver lines for genetic targeting of GABAergic neurons in cerebral cortex. Neuron 71, 995–1013.
Tempia, F., and Konnerth, A. (1994). Calcium requirement of long-term depression and rebound potentiation in cerebellar Purkinje neurons. Semin. Cell Biol. 5, 243–250.
Vernes, S. C., Newbury, D. F., Abrahams, B. S., Winchester, L., Nicod, J., Groszer, M., Alarcón, M., Oliver, P. L., Davies, K. E., Geschwind, D. H., Monaco, A. P., and Fisher, S. E. (2008). A functional genetic link between distinct developmental language disorders. N. Engl. J. Med. 359, 2337–2345.
Westenbroek, R. E., Sakurai, T., Elliott, E. M., Hell, J. W., Starr, T. V., Snutch, T. P., and Catterall, W. A. (1995). Immunochemical identification and subcellular distribution of the alpha 1A subunits of brain calcium channels. J. Neurosci. 15, 6403–6418.
Yunker, A. M. R., Sharp, A. H., Sundarraj, S., Ranganathan, V., Copeland, T. D., and McEnery, M. W. (2003). Immunological characterization of T-type voltage-dependent calcium channel CaV3.1 (alpha1G) and CaV3.3 (alpha1I) isoforms reveal differences in their localization, expression, and neural development. Neuroscience 117, 321–335.
Zambelli, F., Pesole, G., and Pavesi, G. (2009). Pscan: finding over-represented transcription factor binding site motifs in sequences from co-regulated or co-expressed genes. Nucleic Acids Res. 37, W247–W252.
Zhao, Y., Kwan, K.-M., Mailloux, C. M., Lee, W.-K., Grinberg, A., Wurst, W., Behringer, R. R., and Westphal, H. (2007). LIM-homeodomain proteins Lhx1 and Lhx5, and their cofactor Ldb1, control Purkinje cell differentiation in the developing cerebellum. Proc. Natl. Acad. Sci. U.S.A. 104, 13182–13186.
Zheng, C., Heintz, N., and Hatten, M. E. (1996). CNS gene encoding astrotactin, which supports neuronal migration along glial fibers. Science 272, 417–419.
Appendix
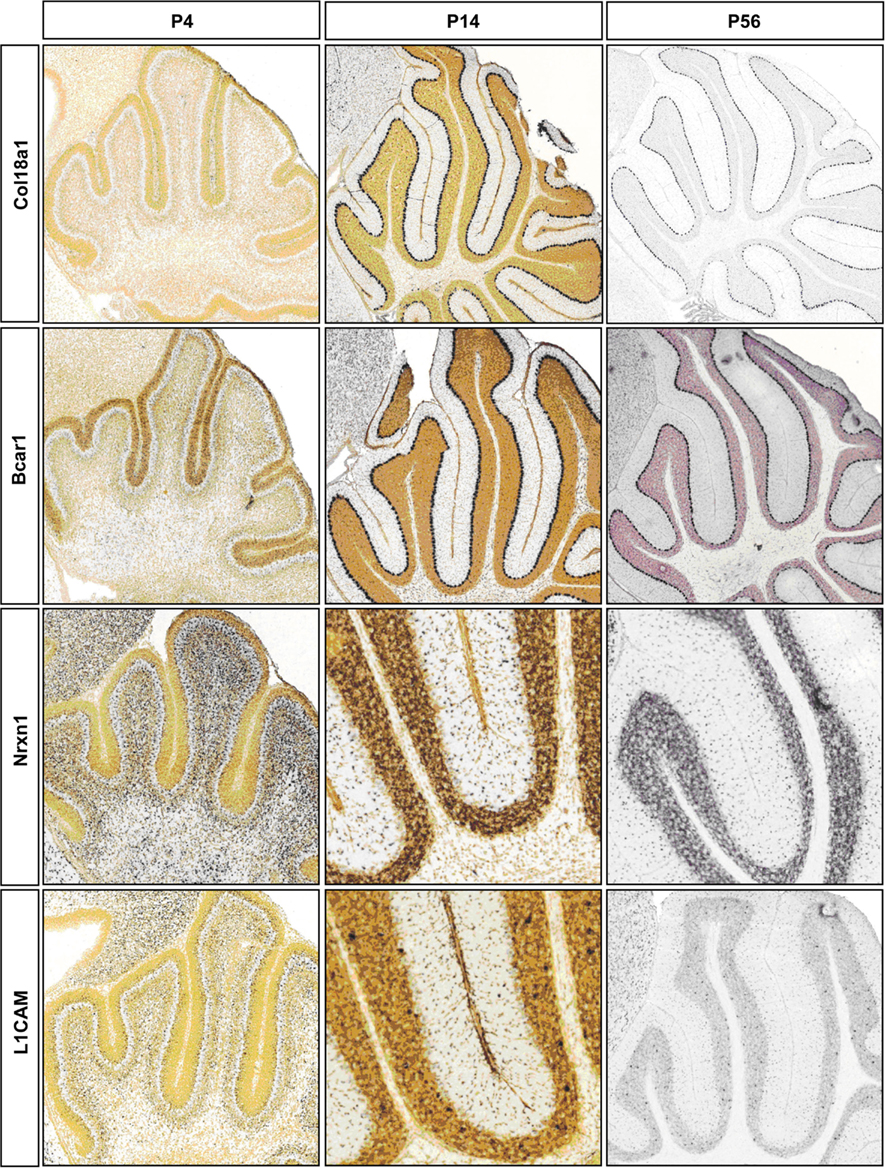
Figure A1. Representative RNA in-situs from Allen Brain developing mouse brain images showing the expression of cell adhesion molecule transcripts, Col18a1, Bcar1, Nrxn1, and L1cam. Expression changes matched with microarray developmental profiles.
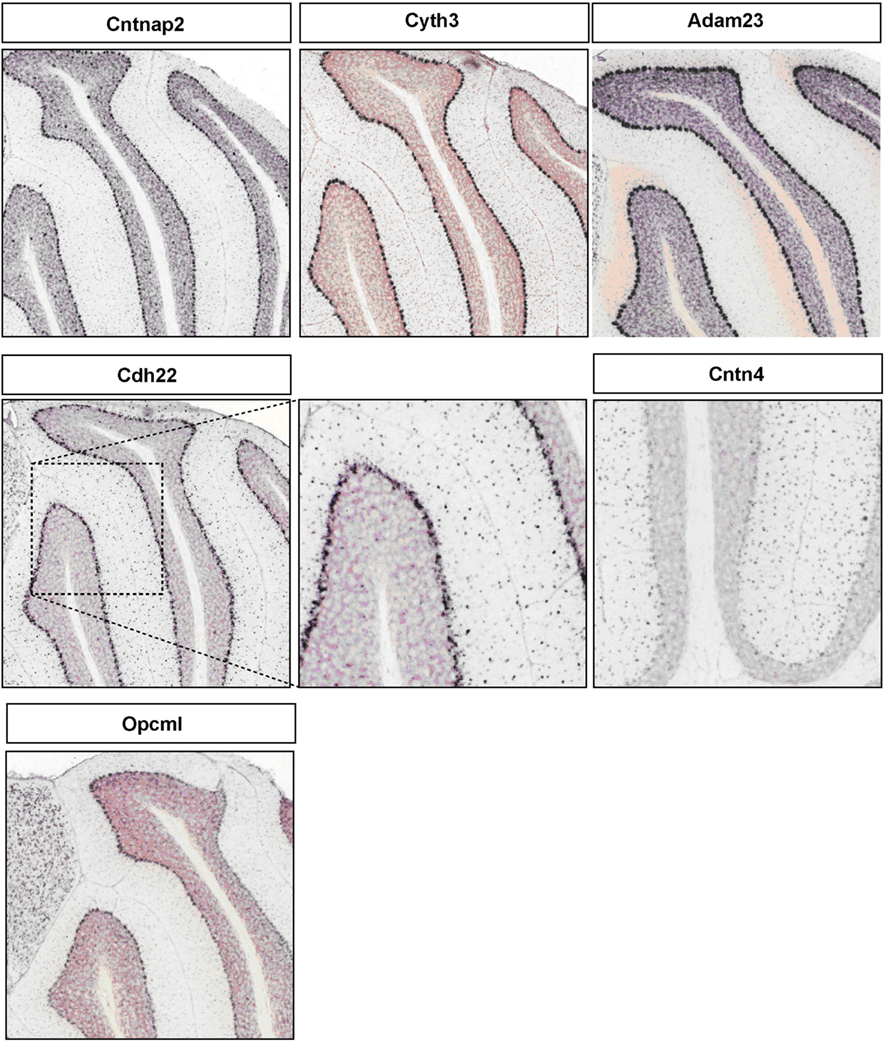
Figure A2. Representative RNA in-situs from Allen Brain mouse brain (only P56 time point available) images showing the PC specific expression of cell adhesion molecule transcripts, Cntnap2, Cyth3, Adam23, and Opcml; S/BC specific expression of Cdh22 and Cntn4.
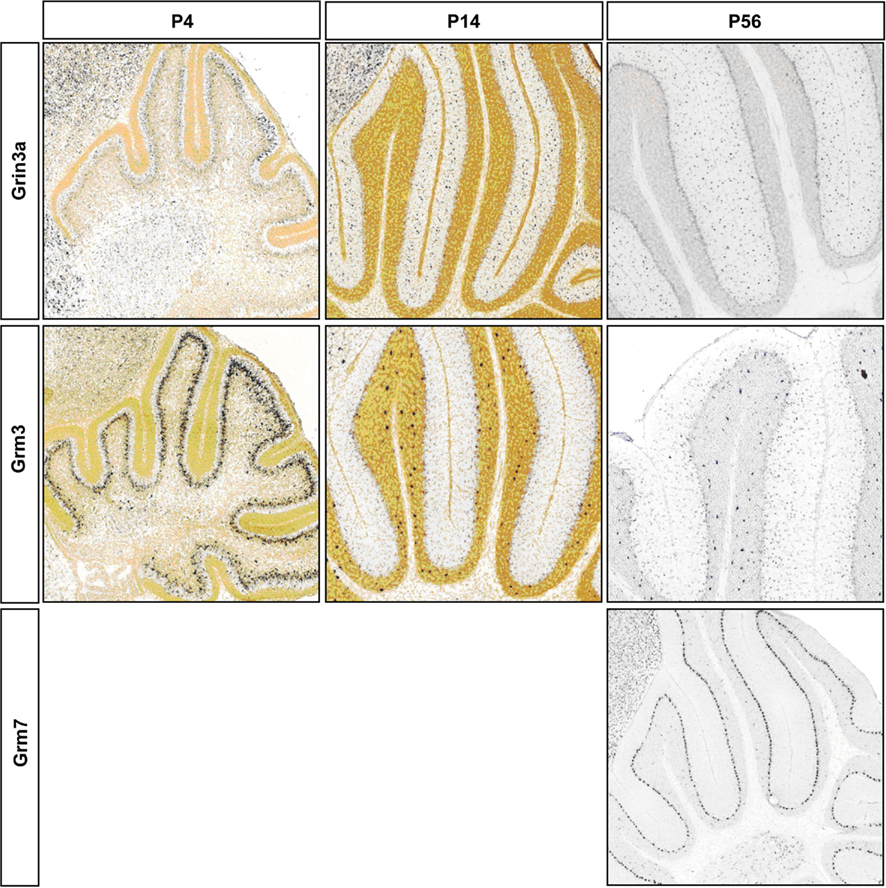
Figure A3. Representative RNA in-situs from Allen Brain developing mouse brain images showing the expression of NMDA and AMPA transcripts; S/BC restricted Grin3a and Grm3; PC restricted Grm7. Expression changes matched with microarray developmental profiles. Grm3 signal is weaker than Golgi cells as has been reported in Ohishi et al. (1993).
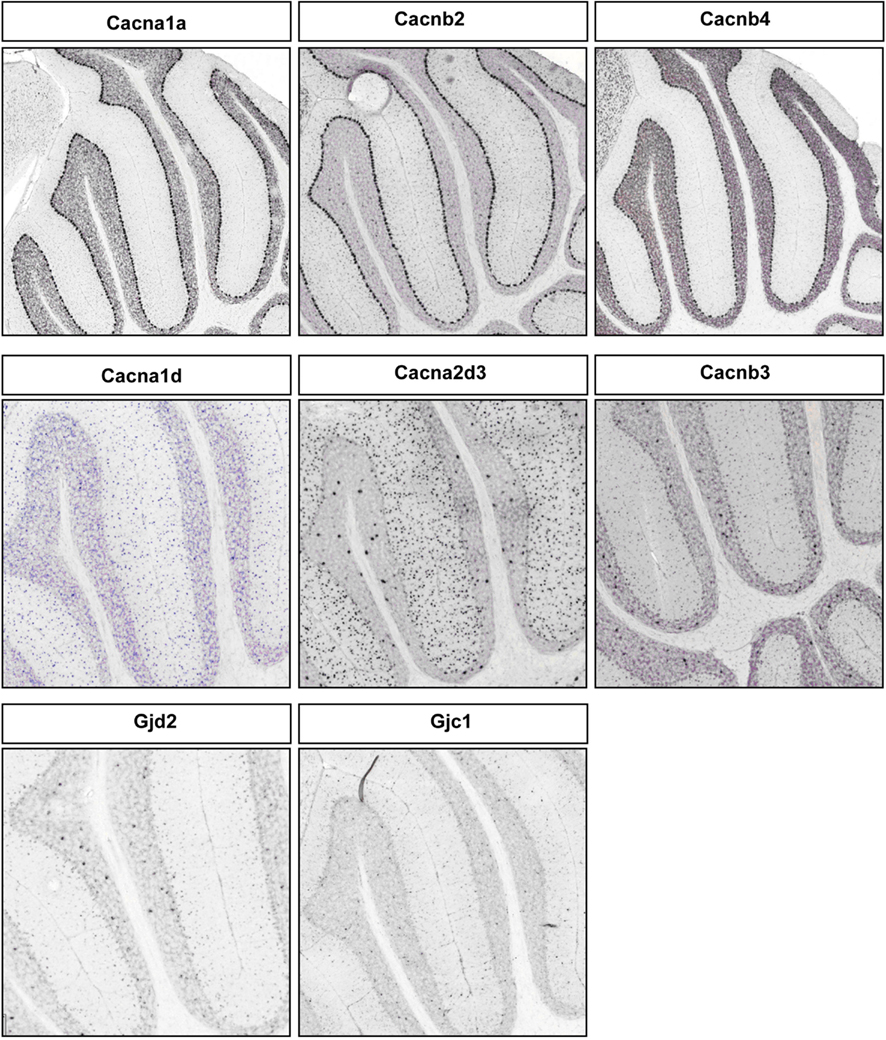
Figure A4. Representative RNA in-situs from Allen Brain mouse brain (only P56 time point available) images showing the PC specific expression of voltage-gated calcium channel transcripts, Cacana1a, Cacnb2, and Cacnb4; S/BC specific expression of Cacna1d, Cacna2d3, and Cacnb3. Also showing the expression of gap junction proteins Gjd2 and Gjc1 in S/BC.
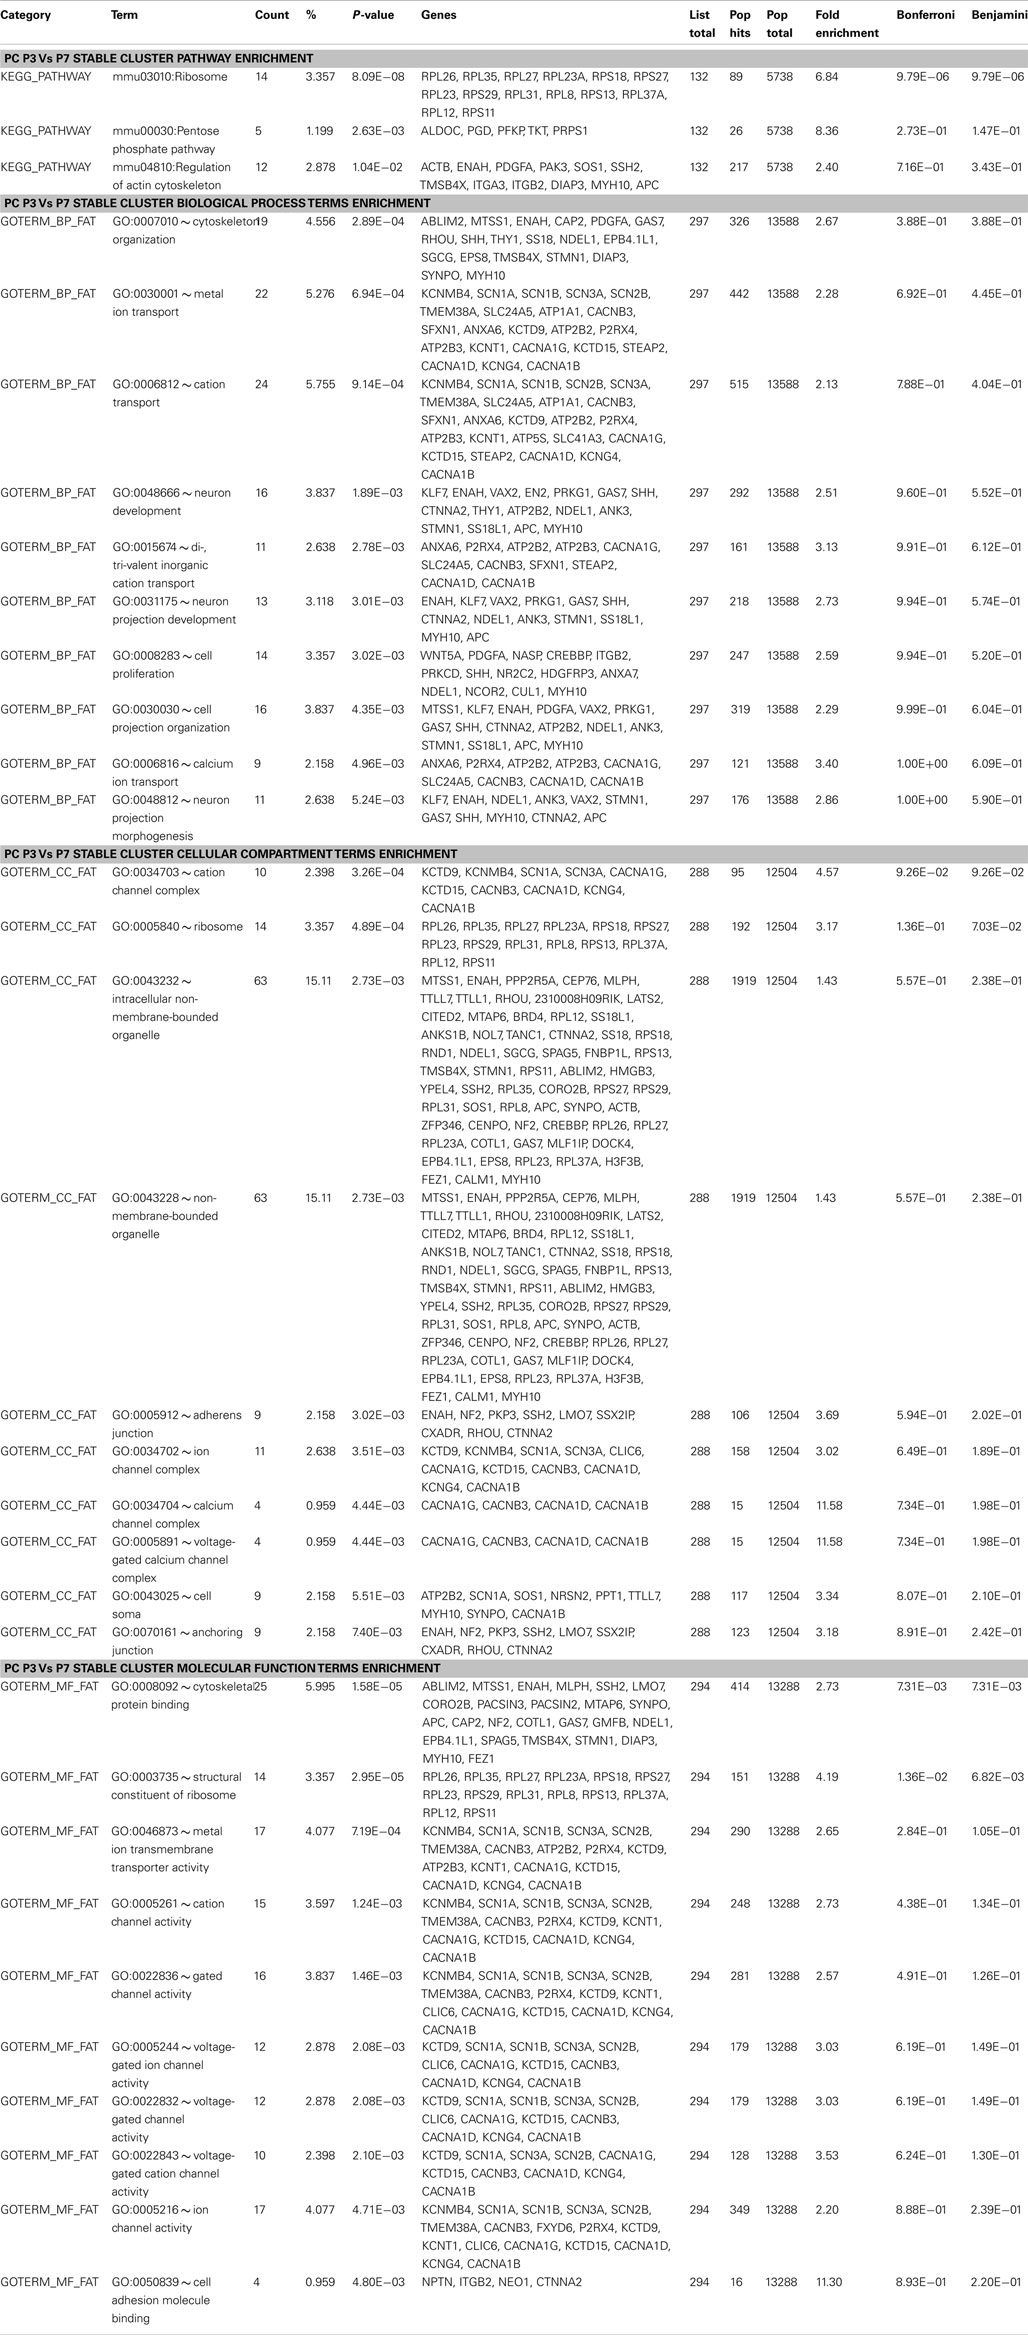
Table A1. Pathway and gene ontology terms enriched in PC, P3-P7 stable clusters.
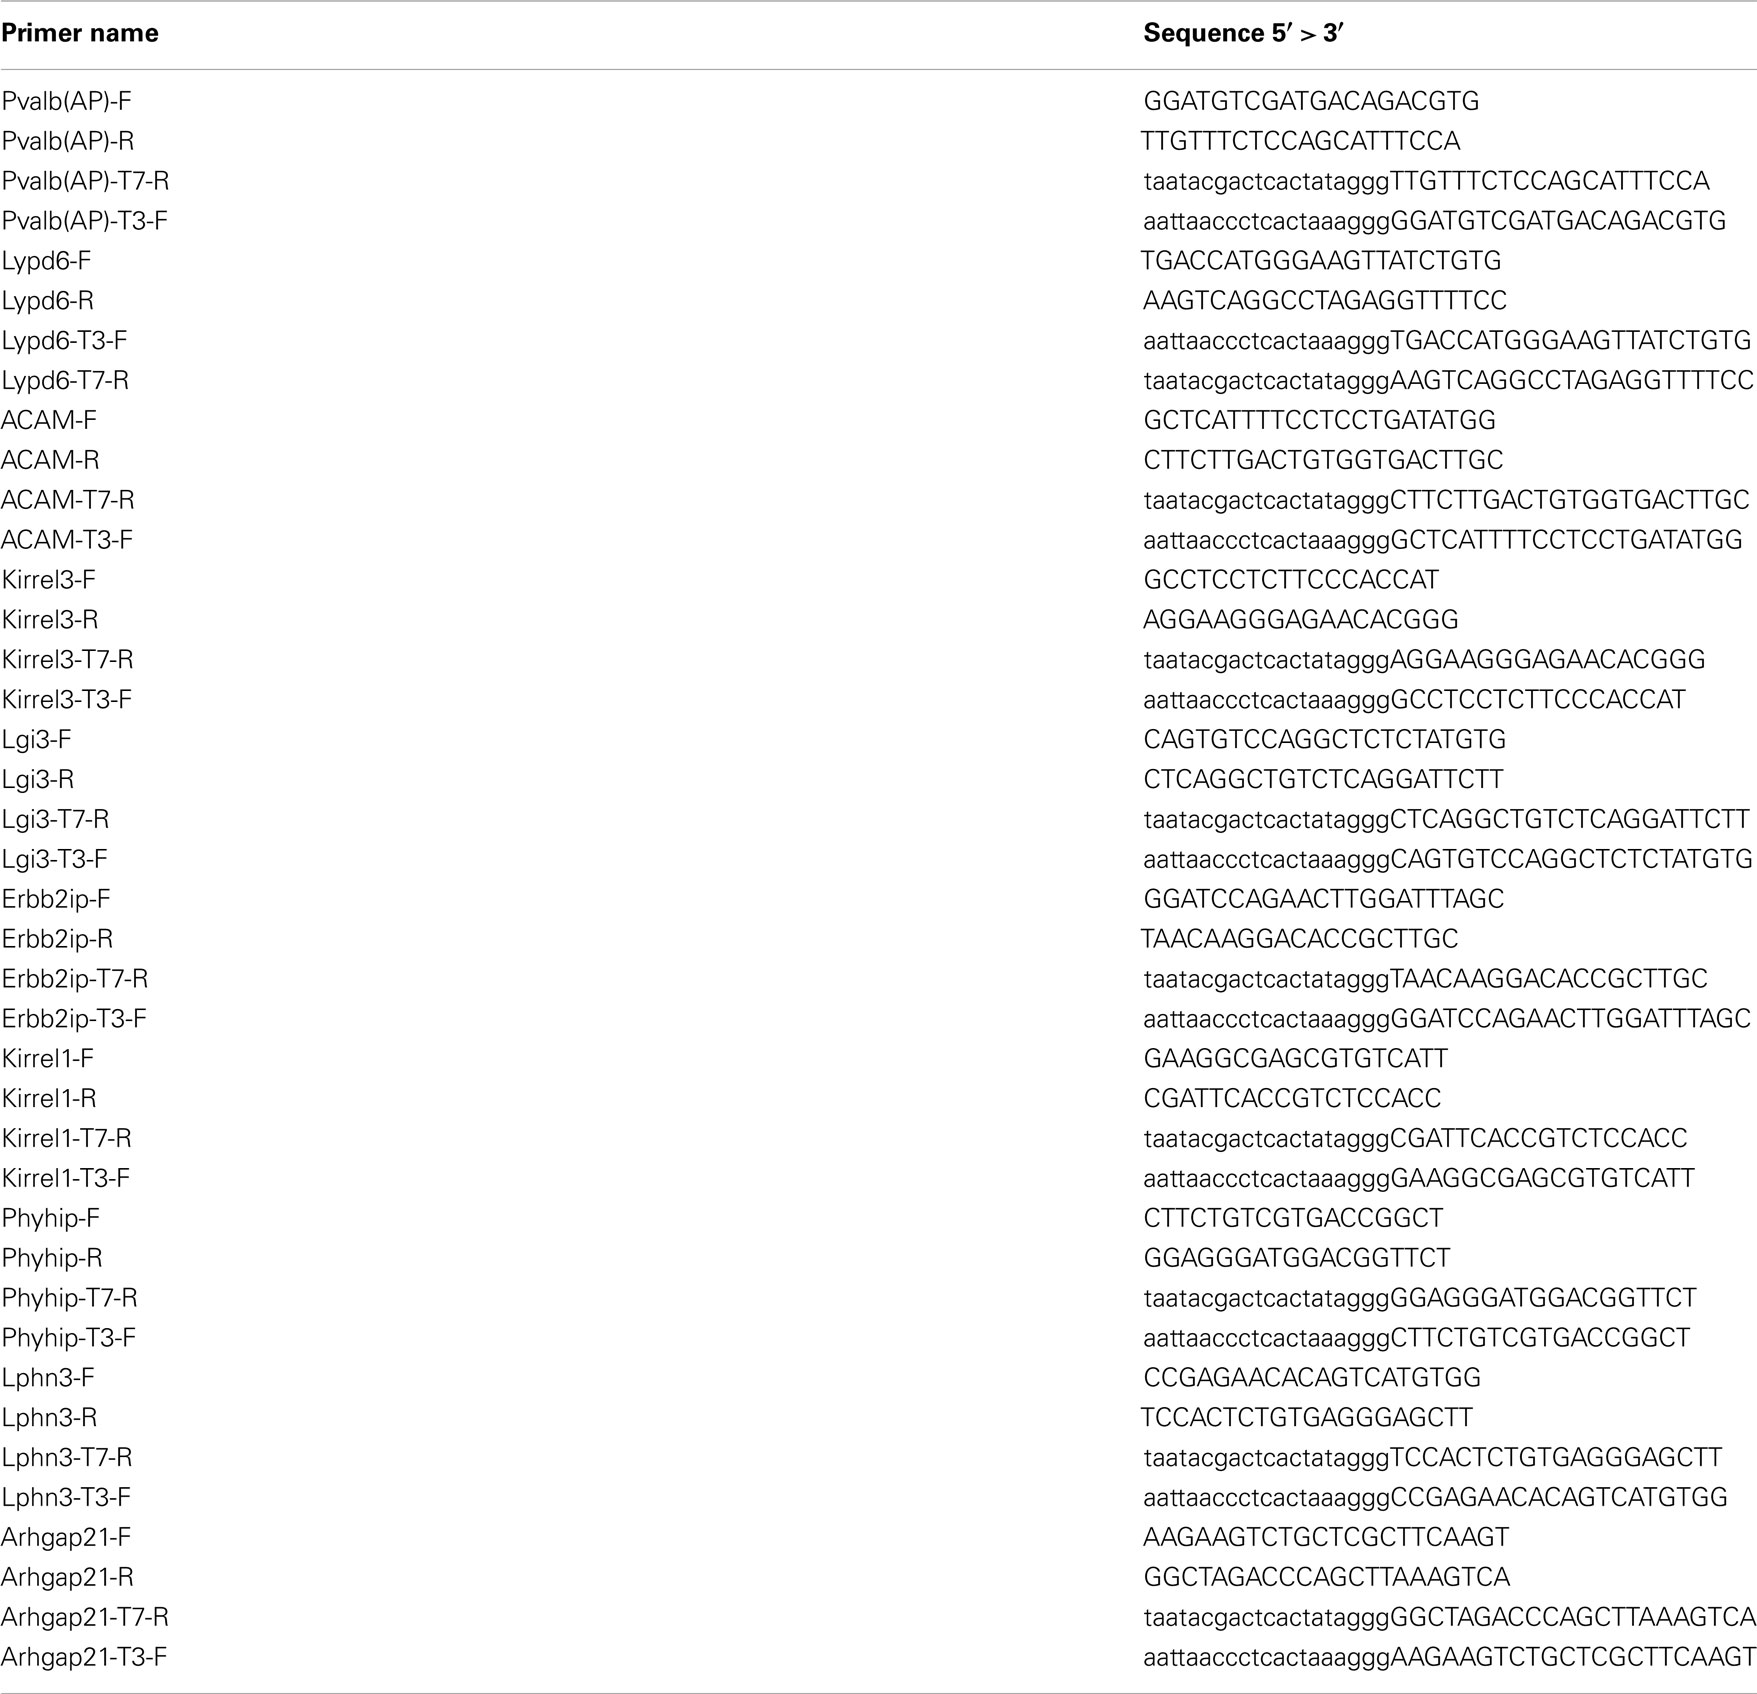
Table A2. List of RNA in sit u hybridization primers.
Keywords: cerebellum, circuit assembly, development, GABAergic, gene expression, microcircuit, Purkinje cell, stellate basket cell
Citation: Paul A, Cai Y, Atwal GS and Huang ZJ (2012) Developmental coordination of gene expression between synaptic partners during GABAergic circuit assembly in cerebellar cortex. Front. Neural Circuits 6:37. doi: 10.3389/fncir.2012.00037
Received: 03 May 2012; Paper pending published: 21 May 2012;
Accepted: 01 June 2012; Published online: 26 June 2012.
Edited by:
Edward M. Callaway, California Institute of Technology, USAReviewed by:
David J. Margolis, University of Zurich, SwitzerlandYuanquan Song, University of California San Francisco, USA
Copyright: © 2012 Paul, Cai, Atwal and Huang. This is an open-access article distributed under the terms of the Creative Commons Attribution Non Commercial License, which permits non-commercial use, distribution, and reproduction in other forums, provided the original authors and source are credited.
*Correspondence: Z. Josh Huang, Cold Spring Harbor Laboratory, One Bungtown Road, Cold Spring Harbor, New York, NY 11724, USA. e-mail: huangj@cshl.edu