Hypoxia Delays Oligodendrocyte Progenitor Cell Migration and Myelin Formation by Suppressing Bmp2b Signaling in Larval Zebrafish
 Lei-qing Yang
 Min Chen1
  Da-long Ren
- 1Hefei National Laboratory for Physical Sciences at the Microscale, School of Life Sciences, University of Science and Technology of China, Hefei, China
- 2Chinese Academy of Sciences Key Laboratory of Brain Function and Disease, School of Life Sciences, University of Science and Technology of China, Hefei, China
Hypoxia in newborns tends to result in developmental deficiencies in the white matter of the brain. As previous studies of the effects of hypoxia on neuronal development in rodents and human infants have been unable to use in vivo imaging, insight into the dynamic development of oligodendrocytes (OLs) in the central nervous system under hypoxia is limited. Here, we developed a visual model to study OL development using sublethal postnatal hypoxia in zebrafish larvae. We observed that hypoxia significantly suppressed OL progenitor cell migration toward the dorsum using in vivo imaging. Further, we found that hypoxia affected myelination, as indicated by thinner myelin sheaths and by a downregulation of myelin basic protein expression. Bmp2b protein expression was also significantly downregulated following hypoxia onset. Using gain of function and loss of function experiments, we demonstrated that the Bmp2b protein was associated with the regulation of OL development. Thus, our work provides a visual hypoxia model within which to observe OL development in vivo, and reveals the underlying mechanisms involved in these processes.
Introduction
Prior clinical research has indicated that adequate oxygen delivery is vital for brain development in infants (Hack et al., 2000; Back et al., 2006; Chahboune et al., 2009). Many investigators have modeled clinical symptoms in experimental animals by exposing neonatal rodents to different degrees and durations of hypoxia (Ganat et al., 2002; Kanaan et al., 2006; Zhou et al., 2008; Fagel et al., 2009). In both mice and rats, hypoxia reduces the volumes of the cerebral cortex and corpus callosum, and eventually leads to liberal ventriculomegaly (Weiss et al., 2004; Watzlawik et al., 2015). Hypoxia also has been shown to disrupt synaptic development (Curristin et al., 2002), binuclear neuron formation (Paltsyn et al., 2014), and glia–neuron interactions (Accorsi-Mendonca et al., 2015). Thus, hypoxia presumably abrogates the development and cognitive potential of the newborn brain (Huppi et al., 2001; Sabatino et al., 2003). A recent study demonstrated that targeting EGFR in oligodendrocyte (OL) progenitor cells (OPCs) at a specific time after premature newborn hypoxic injury was clinically feasible and potentially beneficial (Scafidi et al., 2014). Thus, it is clear that hypoxia plays an important role in the development of neurons and glia in the brain. However, neural behavior, especially OL behavior, in the spinal cord has rarely been monitored in vivo in conjunction with hypoxia.
Zebrafish (Danio rerio) represent an attractive vertebrate model for developmental research due to their rapid development (Kimmel et al., 1995) and transparency, allowing easy in vivo imaging. Moreover, as mammalian and zebrafish OLs and myelin are homologous, the transparent zebrafish model represents an efficient tool for the observation of OL differentiation and myelination; using zebrafish, it is also possible to explore molecular mechanisms in vivo via a number of previously described genetic manipulations and fluorescence transgeneses (Buckley et al., 2008; Dubois-Dalcq et al., 2008; He et al., 2014). Although hypoxia-induced retinopathy (Cao et al., 2010), bone regeneration (Maes et al., 2012), and cancer metastasis (Kumar and Gabrilovich, 2014) have been widely studied, little is known about the mechanism of OL development in the hypoxic zebrafish model.
Here, we found that hypoxia inhibited OPC dorsal migration, delayed the onset of OL myelination in vivo, and reduced the expression of the mbp gene. Transmission electron microscope (TEM) images showed a thinner myelin sheath in response to hypoxic conditions. We used molecular methods to show that the bmp2b gene was downregulated under hypoxia. Using a Bmp2b receptor inhibitor and bmp2b messenger RNA (mRNA) rescue strategy, we demonstrated that Bmp2b participated in regulating OL development under hypoxia. Collectively, our findings indicated that hypoxia suppresses OL differentiation via Bmp2b signaling.
Materials and Methods
Zebrafish Lines and Maintenance
The following zebrafish lines were used in this study: wild-type (WT), transgenic OL lineage transcription factor 2 labeled by EGFP [Tg (olig2:EGFP)] (Shin et al., 2003), Tg (mbp:EGFP-CAAX; donated by Prof. David A. Lyons, University of Edinburgh, Edinburgh, United Kingdom) (Almeida et al., 2011) and Tg (Tol-056) (Satou et al., 2009). Zebrafish embryos were bred with laboratory stock and were maintained at 28.5°C with a 14/10 h light/dark cycle. Zebrafish embryos were collected from natural spawning and staged by days post-fertilization (dpf), according to established criteria (Kimmel et al., 1995). To prevent dark pigment formation, larvae were raised in an embryo medium containing 0.2 mM N-phenylthiourea (Sigma-Aldrich, St. Louis, MO, United States).
All of the animal manipulations described in this study were conducted in strict accordance with the guidelines and regulations set forth by the University of Science and Technology of China (USTC) Animal Resources Center and University Animal Care and Use Committee. All protocols were approved by the Committee on the Ethics of Animal Experiments of the USTC (permit no. USTCACUC1103013).
Hypoxia Device
The hypoxia device we used contained a self-driven unit that automatically controlled nitrogen gas perfusion depending on dissolved oxygen levels in the water (Cao et al., 2010). An oxygen electrode was connected to an oxygen regulator and to the nitrogen gas supplier to accurately detect oxygen levels continuously. We used 100% of the ambient oxygen in the air (7.10 ppm) as the calibration concentration, recalibrated to 40% (3.41 ppm) based preliminary results. To reduce the likelihood of unexpected early zebrafish death during experimentation, the oxygen regulator was recalibrated before each experiment.
In vivo Imaging and Data Analysis
Larvae to be imaged were transferred to N-phenylthiourea to inhibit pigmentation at 24 h post-fertilization (hpf). Prior to imaging, larvae were anesthetized with MS222 and embedded in 1% low-melting-point agarose in embryo medium containing MS222. All images of the spinal cord were taken laterally, such that anterior was to the left, and dorsal was at the top. To investigate OPC migration at 3 and 4 dpf in vivo, Tg (olig2: EGFP) transgenic zebrafishes were imaged under a 10 × objective lens and a 40 × objective lens (FV1000 BX61; Olympus, Tokyo, Japan) at 2 μm intervals, locating within a frame long and wide with the cloacal pores at the central point of the spinal cord. After imaging, fish were removed from the agarose and placed in fresh embryo medium for further growth. Photomontages were assembled with Adobe Photoshop CS5 (Adobe Systems, San Jose, CA, United States).
Treatment With CoCl2⋅6H2O and LDN193189
Cobalt (II) chloride hexahydrate (CoCl2⋅6H2O; Sangon, China) is a general drug designed to induce hypoxia in vitro (Wu et al., 2015). LDN193189 (S2618; Selleck Chemicals, United States) was used as a Bmp2b receptor inhibitor. We treated 1-dpf larvae with either 2 mM CoCl2⋅6H2O or 10 μM LDN193189 in subsequent experiments.
Quantitative Real-Time Polymerase Chain Reaction (qRT-PCR) and Western Blots
Total mRNA was extracted from three groups of 30 larvae each, with each group representing a single independent sample. Each sample was reverse-transcribed into complementary DNA (cDNA) with HiScriptII Q RT SuperMix (Vazyme, China), and analyzed with qRT-PCR using AceQ qPCR SYBR Green Master Mix (Vazyme, China). For each experiment, we used three biological and experimental replicates. All primers used are given in Supplementary Table S1. All results were analyzed as mean fold change ± SEM.
To detect protein expression of Mbp, Bmp2b, and Hif1α in zebrafish larvae, we collected normoxic and hypoxic WT zebrafish larvae at 3 and 4 dpf. Larvae were lysed with RIPA buffer (Beyotime, China). Equal amounts of pooled normoxic and hypoxic extracts were loaded onto SDS–PAGE gels. Western blots were performed using the antibodies to Mbp (1:1,000; Abmart, Shanghai, China), Bmp2b (1: 1,000; GTX54233; Genetex, Irvine, CA, United States), HIF1α (1:500; NB100-134; Novus), and β-actin (1:1,000; GTX629630; Genetex, Irvine, CA, United States) as primary antibodies. The MBP rabbit polyclonal antibody was generated (by Abmart, Shanghai, China) using the peptide SRSRSPPKRWSTIF as previously described (Lyons et al., 2005). The HRP-conjugated goat anti-rabbit secondary antibody (Invitrogen, Carlsbad, CA, United States) was diluted to 1: 10,000 at room temperature.
Bmp2b mRNA Synthesis and Microinjection
To generate bmp2b mRNA, a full-length bmp2b fragment was initially amplified from the cDNA of the WT zebrafish strain using a pair of primers (Supplementary Table S1). bmp2b mRNA was then synthesized with a T7 mMESSAGE mMACHINE Kit (Ambion, Foster City, CA, United States). Finally, we injected 200 pg bmp2b mRNA into single-cell zebrafish embryos.
Zebrafish Optokinetic Response (OKR) Assays
Optokinetic Response assays were performed as previously described (Mueller and Neuhauss, 2010; Huang et al., 2018). We used these assays to visually examine the functional deficiencies of 4-dpf hypoxic zebrafish larvae after OL development disruption. We used LabVIEW to generate a sine-wave grating and used an LCD projector to project this grating. Zebrafish larvae were immobilized dorsal side up in 6% methylcellulose in a chamber. Elicited eye movements were recorded in real time by an infrared-sensitive CCD camera (TCA-1.3BW; Nanjing, China), while rotating grating patterns were projected around the larva. Normoxic and hypoxic larvae were stimulated at a constant angular velocity of 7.5°. To measure visual acuity, both sets of larvae were presented with spatial frequencies of 0.02, 0.04, and 0.06 cycles/degree at 3, 6, and 9 continuous contrast levels, respectively. The OKR gain (the ratio of eye velocity to stimulus velocity) was used to measure contrast sensitivity (Rinner et al., 2005).
Transmission Electron Microscopy
All larval zebrafish were immobilized overnight in a 2.0% formaldehyde and 2.5% glutaraldehyde fixative solution (Electron Microscopy Sciences, United States) at 4°C. Immobilized larval zebrafish were washed with 0.1 M phosphate buffer (pH 7.4). Specimens were then incubated in a postfixation solution containing 1% osmium tetroxide for 2 h and washed with water. Specimens were then washed three times with 0.1 M phosphate buffer (pH 7.4) for 15 min each time. Next, specimens were washed with water, and twice dehydrated with serial dilutions of ethanol in water (i.e., 50, 70, 80, 90, and 100%) and with 100% for 15 min each. All samples were then embedded in epon/araldite resin and hardened for 2 to 3 days at 60°C. Ultrathin (80 nm) transverse sections of the spinal cords of all larvae were stained with uranyl acetate and lead citrate. Sections were viewed and photographed with an FEI Tecnai Spirit (120 kV TEM) transmission electron microscope.
Statistical Analysis
Values were presented as means ± SEMs. The significance of differences between or among groups were identified using Student’s t-tests, non-parametric tests, one-way analyses of variance (ANOVA), or two-way ANOVAs, based on the number of groups compared and other independent factors. For qRT-PCR analyses, we analyzed three independent samples three times each to yield reliable results. Statistical significance was classed as follows: ∗P < 0.05, ∗∗P < 0.01, and ∗∗∗P < 0.001.
Results
Creation of Moderate Sublethal Hypoxic Conditions for Larval Zebrafish
To create hypoxic conditions for larval zebrafish, nitrogen gas was perfused into the water of a 1 L aquarium. The aquarium was an automated unit (Figure 1A). Oxygen levels were accurately measured by the oxygen electrode, which was connected to the oxygen regulator and the nitrogen gas supplier. Thus, nitrogen gas perfusion was controlled depending on the levels of dissolved oxygen in the water. Preliminary studies indicated that dissolved oxygen levels of 3.5 mg/L were optimal for our experiments (Figure 1B). Preliminary experiments also showed that the gene expression of hif1α and the protein expression of Hif1α increased in response to hypoxia (Figures 1C,D). Thus, we successfully created sublethal hypoxic conditions by automatically regulating the perfusion of nitrogen into the water.
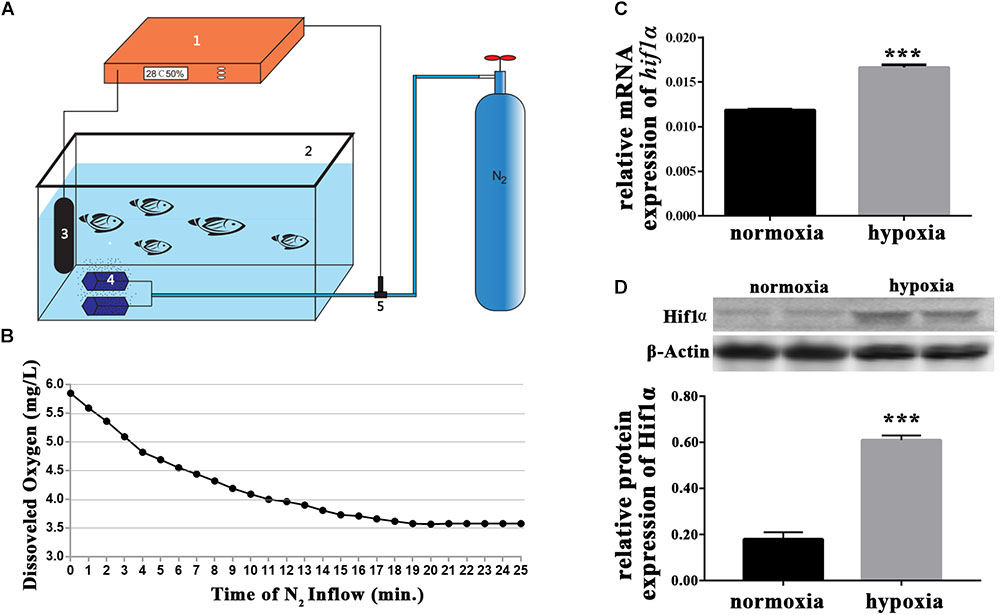
FIGURE 1. Hypoxic setup for larval zebrafish. (A) (1) oxygen regulator; (2) hypoxic larval aquarium; (3) oxygen electrode; (4) air stone; and (5) solenoid valve. The compressed nitrogen source is shown as a blue gas cylinder. (B) Dissolved oxygen in the hypoxic aquarium decreased slowly over time as nitrogen perfusion increased until dissolved oxygen stabilized at 3.5 mg/L. (C) qRT-PCR analysis showing that hif1α mRNA expression was significantly increased under hypoxia. (D) Western blot of Hif1α protein expression showing that hypoxia enhanced Mbp protein translation. ∗P < 0.05; ∗∗P < 0.01; ∗∗∗P < 0.001.
Hypoxia Suppressed OL Differentiation
In infants with periventricular leukomalacia, the delivery of oxygen to the developing brain often fails; in addition, these infants also exhibit widespread changes in glial maturation, with a loss of myelinated fiber tracts (Haynes et al., 2012). To investigate the OL changes that might occur in the central nervous system in vivo in response to hypoxia, we first observed OPC migration in the Tg (olig2: EGFP) transgenic line. At 24 hpf, embryos subjected to hypoxia, and larvae were collected for living imaging at 3 and 4 dpf. At both 3 and 4 dpf, significantly fewer dorsally migrated spinal cord olig2+ cells were observed in the hypoxic larvae (n = 10; 3 dpf: 23.30 ± 1.955; 4 dpf: 25.80 ± 1.562) (Figure 2B) as compared to the normoxic larvae (n = 10; 3 dpf: 44.70 ± 1.012; 4 dpf: 55.00 ± 1.921; Figure 2A).
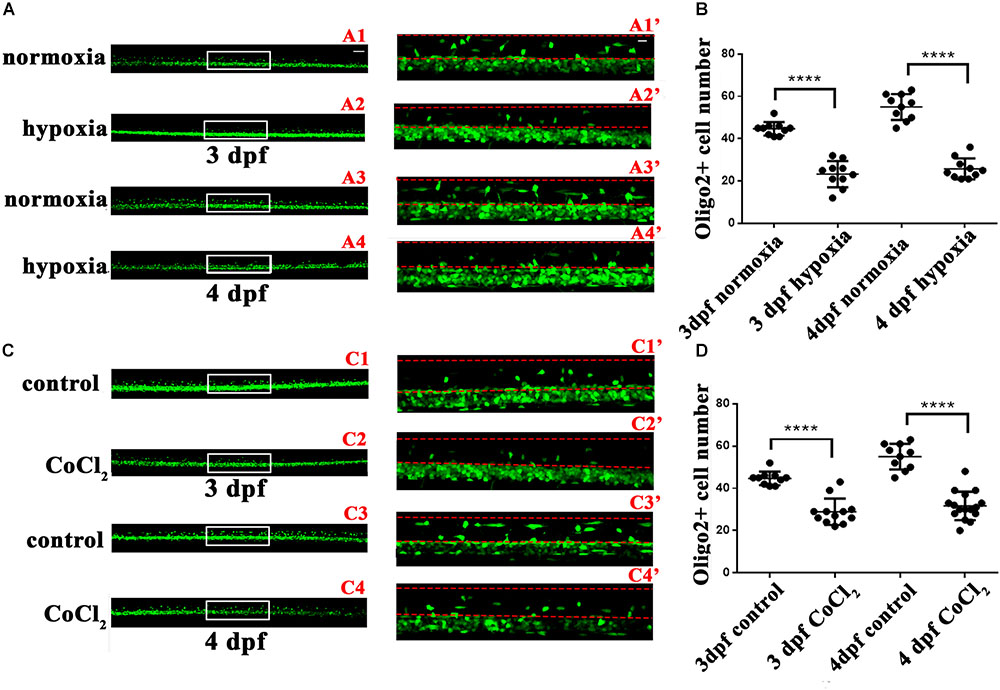
FIGURE 2. Hypoxia and CoCl2⋅6H2O suppressed OPC migration to the dorsal area. The number of dorsally migrated spinal cord olig2+ cells was counted in Tg (olig2: EGFP) zebrafish using a 10 × objective lens on a FV1000 microscope (Olympus, Tokyo, Japan). (A,B) The number of dorsally migrated olig2+ cells decreased under hypoxia at 3 and 4 dpf. A1′, A2′, A3′, and A4′ are the magnified pictures of the white boxes in A1, A2, A3, and A4. Two-way ANOVA, P < 0.0001: Student’s two-tailed t-test. Significantly more cells were dorsally migrated in 3-dpf normoxic larvae as compared to 3-dpf hypoxic larvae (n = 10; P < 0.0001). Significantly more cells were dorsally migrated in 4-dpf normoxic larvae as compared to 4-dpf hypoxic larvae (n = 10; P < 0.0001). (C,D) The number of dorsally migrated spinal cord olig2+ cells in 3- and 4-dpf larvae decreased after CoCl2⋅6H2O exposure. C1′, C2′, C3′, and C4′ are the magnified pictures of the white boxes in C1, C2, C3, and C4. Two-way ANOVA, P < 0.0001: Student’s two-tailed t-test. Significantly more cells were dorsally migrated in 3-dpf normoxic larvae as compared to 3-dpf hypoxic larvae (n = 10; P < 0.0001). Significantly more cells were dorsally migrated in 4-dpf normoxic larvae as compared to 4-dpf hypoxic larvae (n = 10; P < 0.0001). The dashed line indicates the dorsal spinal cord. Scale bars: A1–A4 and C1–C4, 50 μm; A1′–A4′, and C1′–C4′, 10 μm. ∗P < 0.05; ∗∗P < 0.01; ∗∗∗P < 0.001. Error bars represent S.E.M.
To further test these results, we used cobalt chloride (CoCl2) to induce similar hypoxia conditions (Goldberg et al., 1988; Wu et al., 2015). At 24 hpf, 2 mM of CoCl2⋅6H2O (Sangon, China) was used to mimic hypoxia. We then collected larvae at 3 and 4 dpf to observe OPC migration. We observed far fewer dorsally migrated spinal cord olig2+ cells in the CoCl2⋅6H2O group (n = 10; 3 dpf: 28.92 ± 1.803; 4 dpf: 31.69 ± 1.685) than in the control group (n = 10; 3 dpf: 44.70 ± 1.012; 4 dpf: 55.00 ± 1.921; Figures 2C,D). This result suggested that some olig2+ cells differentiated and matured early, beginning functional myelination locally, and were thus unable to migrate to their normal destinations. Together, these results indicated that hypoxia suppresses zebrafish OPC differentiation in vivo.
Hypoxia Induced Delayed OL Myelination
To explore the subsequent OL developmental processes, we observed mature OLs. Myelination occurs along an anteroposterior gradient in the developing spinal cord (Buckley et al., 2008). Therefore, we used the timings of the appearance of myelin sheaths at specific sites along the anteroposterior axis as the indices of myelination development. For this experiment, we used Tg (mbp:EGFP-CAAX) zebrafish, and found that the onset of myelination was delayed under hypoxia (Figures 3A,B). In normoxic zebrafish larvae, the onset of myelination was 3 dpf, which coincided with mbp gene transcription and dorsal OL migration/differentiation (Buckley et al., 2010).
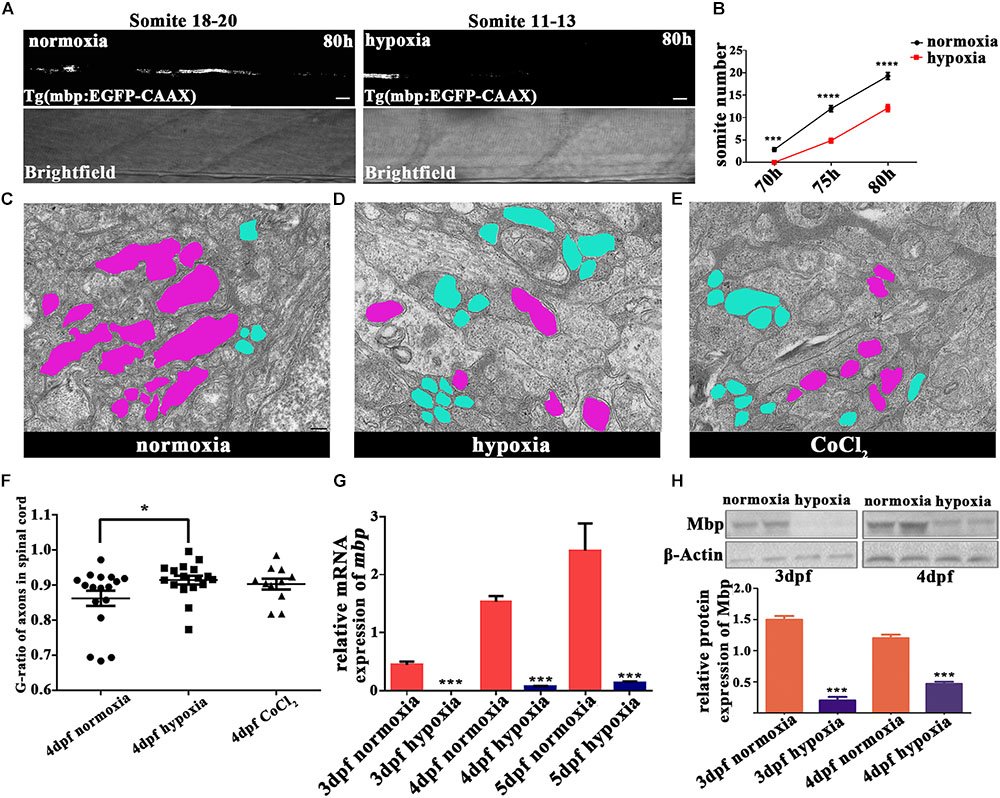
FIGURE 3. Hypoxia delayed the onset of myelination and led to thinner myelin sheaths. (A) Myelination of the Mauthner axon, the most posterior myelin sheath in the spinal cord, at 80 hpf. Myelination can be seen between somites 18 and 20 in normoxic animals but between somites 11 and 13 in hypoxic animals. Scale bars: 10 μm. (B) The most posterior myelin sheath at 70 hpf is somite 2.875 ± 0.3981 in normoxic animals (n = 8) and somite 0.0 ± 0.0 in hypoxic animals (n = 8); at 75 hpf is somite 12.00 ± 0.6814 in normoxic animals (n = 8) and somite 4.857 ± 0.5084 in hypoxic animals (n = 7); and at 80 hpf is somite 19.27 ± 0.7519 in normoxic animals (n = 8) and somite 12.13 ± 0.7892 in hypoxic animals (n = 7). Two-way ANOVA, P < 0.0001. (C–E) A large number of unmyelinated axons (shaded in blue) were observed in the spinal cord axons of the hypoxic and CoCl2 groups as compared to the myelinated axons (shaded in purple) observed in the normoxic group. Scale bars: 200 nm. (F) The hypoxic group had a higher G-ratio in the spinal cord axon than did the normoxic group, indicating delayed-onset myelination under hypoxia. One-way ANOVA, P < 0.05. (G) qRT-PCR analysis indicated that myelin basic protein (mbp) mRNA transcription was significantly decreased under hypoxia. (H) The expression of the Mbp protein was analyzed with western blots. The results showed that hypoxia blocked Mbp protein translation. Larvae at 3 and 4 dpf (30 per day) were pooled for western blot experiments. ∗P < 0.05; ∗∗P < 0.01; ∗∗∗P < 0.001; ∗∗∗∗P < 0.0001.
To further evaluate myelination under hypoxia, we used electron microscopy to examine the myelination of zebrafish axons in the spinal cord at 4 dpf (Figures 3C–E and Supplementary Figure S2). We found that many more axons were myelinated than unmyelinated in the normoxic group, whereas the opposite result was observed in the hypoxic and CoCl2 groups. We then used the G-ratio (the axon circumference divided by the total circumference) to compare the number of myelinated axons between groups (Yin and Hu, 2014). The axon G-ratios in the hypoxic groups (n = 17; 0.9144 ± 0.01243) and in the CoCl2 groups (n = 11; 0.9029 ± 0.01559) were also higher than those of the normoxic groups (n = 17; 0.8623 ± 0.02167) (Figure 3F).
We further investigated the effects of hypoxia on OPC migration and axonal myelination by quantifying the gene expression of mbp and olig2 and the protein expression of Mbp in hypoxic zebrafish larvae at 3 dpf and 4 dpf. Our qRT-PCR results showed that at 3, 4, and 5 dpf, mbp and olig2 mRNA expression were significantly lower in hypoxic zebrafish larvae as compared to normoxic larvae (Figure 3G and Supplementary Figure S1). The protein expression of Mbp was also substantially lower in the hypoxia group as compared to the normoxic group (Figure 3H).
Using OKR to assess the function of the visual system, previous studies have also demonstrated that OL affects OKR in zebrafish (Yin and Hu, 2014; Tian et al., 2016). Here, our OKR test revealed that, under hypoxia, central nervous system myelination was delayed and that myelin sheaths were more thinly wrapped. Additionally, our OKR experiment indicated that visual function was also deficient in 4-dpf hypoxic zebrafish (Supplementary Figure S3).
Thus, our results indicated that hypoxia disrupts OL development in vivo, both in terms of OPC migration and with respect to mature OL myelination.
LDN193189 Inhibited OPC Dorsal Migration
BMP deficiency affects glial maturation in the spinal cord (See et al., 2007). BMPs also act as growth factors, stimulating axon growth in the spinal motor neurons (Zhong and Zou, 2014). Bmp2b and Bmp4 are two classic BMP isoforms that regulate the early development of zebrafish (Grinspan et al., 2000; Mowbray et al., 2001; Ke et al., 2008; Tiso et al., 2009). Therefore, we measured the gene expression of bmp2b and bmp4 with qRT-PCR. We found that bmp2b gene expression was strongly downregulated in 3 and 4 dpf hypoxic zebrafish larvae vs. normoxic larvae (Figures 4A,B); there was no apparent change bmp4 gene expression (data not shown). Bmp2b protein expression was also obviously downregulated in the hypoxic larvae as compared to the normoxic larvae (Figures 4C,D).
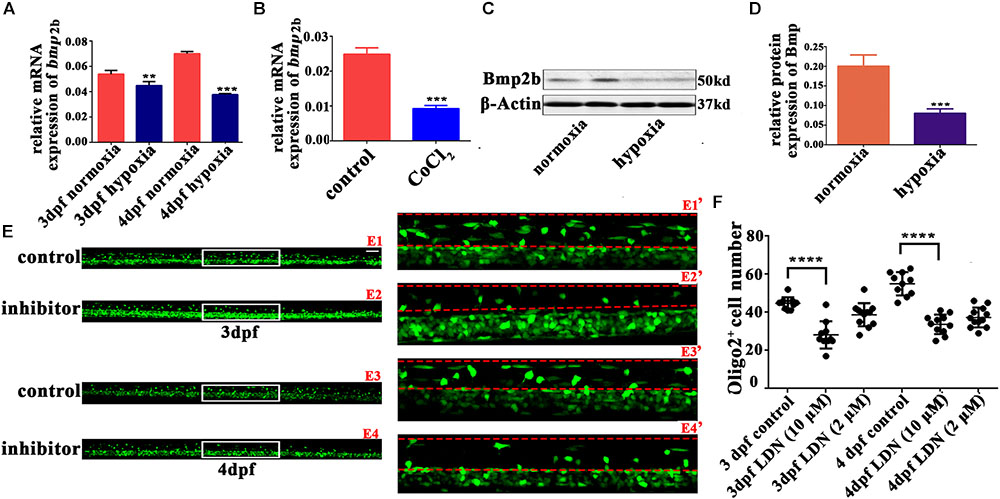
FIGURE 4. The Bmp2b inhibitor suppresses OPC migration to the dorsal area. (A,B) qRT-PCR analysis indicated that bmp2b gene mRNA expression was significantly downregulated after hypoxia and CoCl2 exposure. (C,D) Bmp2b protein expression was analyzed with western blots. The results showed that hypoxia blocked Bmp2b protein translation. Thirty zebrafish 4-dpf larvae were pooled for western blots experiments. (E,F) The number of dorsally migrated olig2+ cells at 3 and 4 dpf decreased after LDN193189 treatment. E1′, E2′, E3′, and E4′ are magnified pictures of the white boxes in E1, E2, E3, and E4. Scale bars: E1–E4, 50 μm and E1′–E4′, 10 μm. Two-way ANOVA, P < 0.0001: Student’s two-tailed t-test. Significantly more cells were dorsally migrated in 3-dpf control larvae as compared to 3-dpf larvae treated with 10 μM LDN193189 (n = 12; P < 0.0001). Significantly more cells were dorsally migrated in 4-dpf normoxic larvae as compared to 4-dpf larvae treated with 10 μM LDN193189 (n = 10; P < 0.0001). ∗P < 0.05; ∗∗P < 0.01; ∗∗∗P < 0.001; ∗∗∗∗P < 0.0001. Error bars represent S.E.M.
We next used a Bmp2b receptor inhibitor to observe OPC migration, and found that significantly fewer spinal cord olig2+ cells were dorsally migrated in the larvae treated with 10 μM LDN193189 at 3 dpf (n = 10; 28.20 ± 2.274) and 4 dpf (n = 11; 33.73 ± 1.544), as compared to the untreated larvae at 3 dpf (n = 10; 44.70 ± 1.012) and 4 dpf (n = 10; 55.00 ± 1.921; Figures 4E,F). These results suggested that Bmp2b might play a pivotal role in the regulation of OPC differentiation under hypoxia.
Bmp2b mRNA Reversed the Abnormalities in OPC Differentiation
To investigate whether bmp2b was essential to OPC migration under hypoxia, we synthesized bmp2b mRNA and injected it into one-cell Tg (olig2: EGFP) zebrafish embryos. We then measured bmp2b gene expression at 3 dpf (Figures 5A,B). We found that bmp2b mRNA injection after CoCl2 increased the dorsally migrated spinal cord olig2+ cells at 3 dpf (n = 15; 35.53 ± 1.521) and 4 dpf (n = 17; 31.06 ± 1.459), as compared to CoCl2-treated larvae not injected with bmp2b mRNA at 3 dpf (n = 12; 28.92 ± 1.803) and 4 dpf (n = 16; 31.69 ± 1.685; Figures 5C,D). These results indicated that Bmp2b signaling is critical to OPC differentiation.
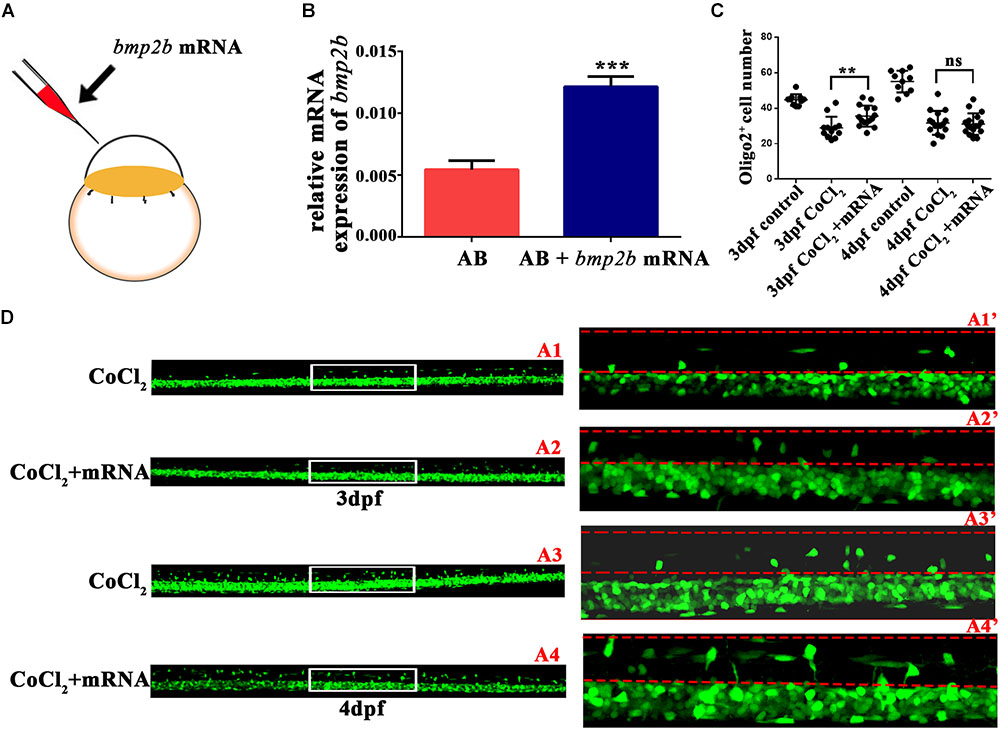
FIGURE 5. Bmp2b mRNA reversed the reduction in the number of olig2+ cells migrating to the dorsal area. (A) Bmp2b mRNA was injected into one-cell embryos. (B) qRT-PCR analysis showed that bmp2b gene expression increased, validating the rescue effect. (C–D) bmp2b mRNA reversed the reduction in the number of dorsally migrated olig2+ cells at 3 and 4 dpf. A1′, A2′, A3′, and A4′ are the magnified pictures of the white boxes in A1, A2, A3, and A4. Scale bars: A1–A4, 50 μm and A1′–A4′, 10 μm. ∗P < 0.05; ∗∗P < 0.01; ∗∗∗P < 0.001. Error bars represent S.E.M.
Discussion
Hypoxia is a principal cause of brain injury in premature infants, which clinical features consist of diagnostic aspects and clinicopathologic correlations (du Plessis, 2009). Using a hypoxic larval zebrafish model, we identified several novel aspects of OL behavior in the spinal cord under hypoxia. First, we used Tg (olig2: EGFP) and Tg (mbp-EGFP-CAAX) hypoxic models to show that fewer OPCs migrated to the dorsal area and that myelin sheaths in the spinal cord were thinner. Second, bmp2b gene expression was downregulated in hypoxic animals. Third, based on loss of function and gain of function, we demonstrated that hypoxia suppressed OL differentiation through Bmp2b signaling.
Hypoxia affects many processes involved in bone regeneration (Drager et al., 2015) and angiogenesis (Tanaka and Nangaku, 2013). Several rodent models have been designed to study various hypoxia-induced diseases, including retinopathy (Liu et al., 2014), bronchopulmonary dysplasia (Elberson et al., 2015), and absolutely periventricular leukomalacia (Chen et al., 2015). However, the zebrafish has become an attractive vertebrate model organism for the study of hypoxia-induced diseases due to the broad conservation of its genes and its bodily transparency (Cao et al., 2010; Wu et al., 2015). Here, we observed OPC migration and OL myelination in vivo. We found that, under hypoxia, significantly fewer olig2+ cells migrated to the dorsal area, and olig2 gene expression was downregulated. The onset of myelination was also delayed under hypoxia, which may have been due to changes in mbp transcription and dorsal OL migration and differentiation (Buckley et al., 2010). We used TEM to show that spinal cord axons were covered with a thinner myelin sheath under hypoxia, indicating that hypoxia severely disrupted OL function. Our results thus indicated that hypoxia affected OPC migration, OL myelination, and even myelin sheath thickness.
We also investigated the effects of Bmp2b on OL differentiation under hypoxia using loss of function and gain of function. Consistent with our results, BMPs have been shown to be associated with OPC differentiation (See et al., 2007). Although the mechanisms by which hypoxia affects Bmp2b expression, several studies have shown that BMPs are associated with OL differentiation, and that hypoxia affects BMP2protein expression (Drager et al., 2015). Thus, we speculated that Bmp2b might be involved in reducing OL differentiation in zebrafish. However, our results do not exclude the possibility that additional genes or BMP subunits may also be regulated by hypoxia.
To test our speculation, we designed bmp2b rescue mRNA. For the OPC migration experiment, we obtained the desired rescue effect by injecting bmp2b mRNA into one-cell-phase embryos.
Conclusion
In summary, our results indicated that hypoxia negatively influences OL differentiation, and that this process was meditated by Bmp2b signaling. Our ultimately increases our understanding of hypoxia and glial development.
Author Contributions
L-qY, D-lR, and BH designed the experiments. L-qY conducted all the experiments and wrote the manuscript. MC and J-lZ also helped to complete part of the experiments. BH and D-lR revised the manuscript.
Funding
This research was supported by grants from National Natural Science Foundation of China (81790643, 31701027, and 31771183), Anhui Provincial Natural Science Foundation (1708085QC58).
Conflict of Interest Statement
The authors declare that the research was conducted in the absence of any commercial or financial relationships that could be construed as a potential conflict of interest.
Acknowledgments
We thank our Core Facility Center for Life Sciences, University of Science and Technology of China.
Supplementary Material
The Supplementary Material for this article can be found online at: https://www.frontiersin.org/articles/10.3389/fncel.2018.00348/full#supplementary-material
References
Accorsi-Mendonca, D., Almado, C. E., Bonagamba, L. G., Castania, J. A., Moraes, D. J., and Machado, B. H. (2015). Enhanced firing in NTS induced by short-term sustained hypoxia is modulated by Glia-Neuron interaction. J. Neurosci. 35, 6903–6917. doi: 10.1523/JNEUROSCI.4598-14.2015
Almeida, R. G., Czopka, T., Ffrench-Constant, C., and Lyons, D. A. (2011). Individual axons regulate the myelinating potential of single oligodendrocytes in vivo. Development 138, 4443–4450. doi: 10.1242/dev.071001
Back, S. A., Craig, A., Luo, N. L., Ren, J., Akundi, R. S., Ribeiro, I., et al. (2006). Protective effects of caffeine on chronic hypoxia-induced perinatal white matter injury. Ann. Neurol. 60, 696–705. doi: 10.1002/ana.21008
Buckley, C. E., Goldsmith, P., and Franklin, R. J. (2008). Zebrafish myelination: a transparent model for remyelination? Dis. Model. Mech. 1, 221–228. doi: 10.1242/dmm.001248
Buckley, C. E., Marguerie, A., Alderton, W. K., and Franklin, R. J. (2010). Temporal dynamics of myelination in the zebrafish spinal cord. Glia 58, 802–812. doi: 10.1002/glia.20964
Cao, Z., Jensen, L. D., Rouhi, P., Hosaka, K., Lanne, T., Steffensen, J. F., et al. (2010). Hypoxia-induced retinopathy model in adult zebrafish. Nat. Protoc. 5, 1903–1910. doi: 10.1038/nprot.2010.149
Chahboune, H., Ment, L. R., Stewart, W. B., Rothman, D. L., Vaccarino, F. M., Hyder, F., et al. (2009). Hypoxic injury during neonatal development in murine brain: correlation between in vivo DTI findings and behavioral assessment. Cereb. Cortex 19, 2891–2901. doi: 10.1093/cercor/bhp068
Chen, L. X., Ma, S. M., Zhang, P., Fan, Z. C., Xiong, M., Cheng, G. Q., et al. (2015). Neuroprotective effects of oligodendrocyte progenitor cell transplantation in premature rat brain following hypoxic-ischemic injury. PLoS One 10:e0115997. doi: 10.1371/journal.pone.0115997
Curristin, S. M., Cao, A., Stewart, W. B., Zhang, H., Madri, J. A., Morrow, J. S., et al. (2002). Disrupted synaptic development in the hypoxic newborn brain. Proc. Natl. Acad. Sci. U.S.A. 99, 15729–15734. doi: 10.1073/pnas.232568799
Drager, J., Harvey, E. J., and Barralet, J. (2015). Hypoxia signalling manipulation for bone regeneration. Expert Rev. Mol. Med. 17:e6. doi: 10.1017/erm.2015.4
Dubois-Dalcq, M., Williams, A., Stadelmann, C., Stankoff, B., Zalc, B., and Lubetzki, C. (2008). From fish to man: understanding endogenous remyelination in central nervous system demyelinating diseases. Brain 131, 1686–1700. doi: 10.1093/brain/awn076
Elberson, V. D., Nielsen, L. C., Wang, H., and Kumar, H. S. (2015). Effects of intermittent hypoxia and hyperoxia on angiogenesis and lung development in newborn mice. J. Neonatal Perinatal Med. 8, 313–322. doi: 10.3233/NPM-15814134
Fagel, D. M., Ganat, Y., Cheng, E., Silbereis, J., Ohkubo, Y., Ment, L. R., et al. (2009). Fgfr1 is required for cortical regeneration and repair after perinatal hypoxia. J. Neurosci. 29, 1202–1211. doi: 10.1523/JNEUROSCI.4516-08.2009
Ganat, Y., Soni, S., Chacon, M., Schwartz, M. L., and Vaccarino, F. M. (2002). Chronic hypoxia up-regulates fibroblast growth factor ligands in the perinatal brain and induces fibroblast growth factor-responsive radial glial cells in the sub-ependymal zone. Neuroscience 112, 977–991. doi: 10.1016/S0306-4522(02)00060-X
Goldberg, M. A., Dunning, S. P., and Bunn, H. F. (1988). Regulation of the erythropoietin gene: evidence that the oxygen sensor is a heme protein. Science 242, 1412–1415. doi: 10.1126/science.2849206
Grinspan, J. B., Edell, E., Carpio, D. F., Beesley, J. S., Lavy, L., Pleasure, D., et al. (2000). Stage-specific effects of bone morphogenetic proteins on the oligodendrocyte lineage. J. Neurobiol. 43, 1–17. doi: 10.1002/(SICI)1097-4695(200004)43:1<1::AID-NEU1>3.0.CO;2-0
Hack, M., Taylor, H. G., Klein, N., and Mercuri-Minich, N. (2000). Functional limitations and special health care needs of 10- to 14-year-old children weighing less than 750 grams at birth. Pediatrics 106, 554–560. doi: 10.1542/peds.106.3.554
Haynes, R. L., Desilva, T. M., and Li, J. (2012). Mechanisms of perinatal brain injury. Neurol. Res. Int. 2012:157858. doi: 10.1155/2012/157858
He, J. H., Gao, J. M., Huang, C. J., and Li, C. Q. (2014). Zebrafish models for assessing developmental and reproductive toxicity. Neurotoxicol. Teratol. 42, 35–42. doi: 10.1016/j.ntt.2014.01.006
Huang, D. F., Wang, M. Y., Yin, W., Ma, Y. Q., Wang, H., Xue, T., et al. (2018). Zebrafish lacking circadian gene per2 exhibit visual function deficiency. Front. Behav. Neurosci. 12:53. doi: 10.3389/fnbeh.2018.00053
Huppi, P. S., Murphy, B., Maier, S. E., Zientara, G. P., Inder, T. E., Barnes, P. D., et al. (2001). Microstructural brain development after perinatal cerebral white matter injury assessed by diffusion tensor magnetic resonance imaging. Pediatrics 107, 455–460. doi: 10.1542/peds.107.3.455
Kanaan, A., Farahani, R., Douglas, R. M., Lamanna, J. C., and Haddad, G. G. (2006). Effect of chronic continuous or intermittent hypoxia and reoxygenation on cerebral capillary density and myelination. Am. J. Physiol. Regul. Integr. Comp. Physiol. 290, R1105–R1114. doi: 10.1152/ajpregu.00535.2005
Ke, Z., Kondrichin, I., Gong, Z., and Korzh, V. (2008). Combined activity of the two Gli2 genes of zebrafish play a major role in Hedgehog signaling during zebrafish neurodevelopment. Mol. Cell. Neurosci. 37, 388–401. doi: 10.1016/j.mcn.2007.10.013
Kimmel, C. B., Ballard, W. W., Kimmel, S. R., Ullmann, B., and Schilling, T. F. (1995). Stages of embryonic development of the zebrafish. Dev. Dyn. 203, 253–310. doi: 10.1002/aja.1002030302
Kumar, V., and Gabrilovich, D. I. (2014). Hypoxia-inducible factors in regulation of immune responses in tumour microenvironment. Immunology 143, 512–519. doi: 10.1111/imm.12380
Liu, N., Sun, Y., Zhao, N., and Chen, L. (2014). Role of hypoxia-inducible factor-1alpha and survivin in oxygen-induced retinopathy in mice. Int. J. Clin. Exp. Pathol. 7, 6814–6819.
Lyons, D. A., Pogoda, H. M., Voas, M. G., Woods, I. G., Diamond, B., Nix, R., et al. (2005). erbb3 and erbb2 are essential for schwann cell migration and myelination in zebrafish. Curr. Biol. 15, 513–524. doi: 10.1016/j.cub.2005.02.030
Maes, C., Carmeliet, G., and Schipani, E. (2012). Hypoxia-driven pathways in bone development, regeneration and disease. Nat. Rev. Rheumatol. 8, 358–366. doi: 10.1038/nrrheum.2012.36
Mowbray, C., Hammerschmidt, M., and Whitfield, T. T. (2001). Expression of BMP signalling pathway members in the developing zebrafish inner ear and lateral line. Mech. Dev. 108, 179–184. doi: 10.1016/S0925-4773(01)00479-8
Mueller, K. P., and Neuhauss, S. C. (2010). Quantitative measurements of the optokinetic response in adult fish. J. Neurosci. Methods 186, 29–34. doi: 10.1016/j.jneumeth.2009.10.020
Paltsyn, A. A., Manukhina, E. B., Goryacheva, A. V., Downey, H. F., Dubrovin, I. P., Komissarova, S. V., et al. (2014). Intermittent hypoxia stimulates formation of binuclear neurons in brain cortex- a role of cell fusion in neuroprotection? Exp. Biol. Med. 239, 595–600. doi: 10.1177/1535370214523898
Rinner, O., Rick, J. M., and Neuhauss, S. C. (2005). Contrast sensitivity, spatial and temporal tuning of the larval zebrafish optokinetic response. Invest. Ophthalmol. Vis. Sci. 46, 137–142. doi: 10.1167/iovs.04-0682
Sabatino, G. M., Domizio, S., Cicioni, P., and Sabatino, G. (2003). Mechanisms of perinatal brain injury. Panminerva Med. 45, 117–121.
Satou, C., Kimura, Y., Kohashi, T., Horikawa, K., Takeda, H., Oda, Y., et al. (2009). Functional role of a specialized class of spinal commissural inhibitory neurons during fast escapes in zebrafish. J. Neurosci. 29, 6780–6793. doi: 10.1523/JNEUROSCI.0801-09.2009
Scafidi, J., Hammond, T. R., Scafidi, S., Ritter, J., Jablonska, B., Roncal, M., et al. (2014). Intranasal epidermal growth factor treatment rescues neonatal brain injury. Nature 506, 230–234. doi: 10.1038/nature12880
See, J., Mamontov, P., Ahn, K., Wine-Lee, L., Crenshaw, E. B. III, and Grinspan, J. B. (2007). BMP signaling mutant mice exhibit glial cell maturation defects. Mol. Cell. Neurosci. 35, 171–182. doi: 10.1016/j.mcn.2007.02.012
Shin, J., Park, H. C., Topczewska, J. M., Mawdsley, D. J., and Appel, B. (2003). Neural cell fate analysis in zebrafish using olig2 BAC transgenics. Methods Cell Sci. 25, 7–14. doi: 10.1023/B:MICS.0000006847.09037.3a
Tanaka, T., and Nangaku, M. (2013). Angiogenesis and hypoxia in the kidney. Nat. Rev. Nephrol. 9, 211–222. doi: 10.1038/nrneph.2013.35
Tian, C., Zou, S., and Hu, B. (2016). Extraocular source of oligodendrocytes contribute to retinal myelination and optokinetic responses in zebrafish. Invest. Ophthalmol. Vis. Sci. 57, 2129–2138. doi: 10.1167/iovs.15-17675
Tiso, N., Filippi, A., Benato, F., Negrisolo, E., Modena, N., Vaccari, E., et al. (2009). Differential expression and regulation of olig genes in zebrafish. J. Comp. Neurol. 515, 378–396. doi: 10.1002/cne.22054
Watzlawik, J. O., Kahoud, R. J., O’Toole, R. J., White, K. A., Ogden, A. R., Painter, M. M., et al. (2015). Abbreviated exposure to hypoxia is sufficient to induce CNS dysmyelination, modulate spinal motor neuron composition, and impair motor development in neonatal mice. PLoS One 10:e0128007. doi: 10.1371/journal.pone.0128007
Weiss, J., Takizawa, B., McGee, A., Stewart, W. B., Zhang, H., Ment, L., et al. (2004). Neonatal hypoxia suppresses oligodendrocyte Nogo-A and increases axonal sprouting in a rodent model for human prematurity. Exp. Neurol. 189, 141–149. doi: 10.1016/j.expneurol.2004.05.018
Wu, Y. C., Chang, C. Y., Kao, A., Hsi, B., Lee, S. H., Chen, Y. H., et al. (2015). Hypoxia-induced retinal neovascularization in zebrafish embryos: a potential model of retinopathy of prematurity. PLoS One 10:e0126750. doi: 10.1371/journal.pone.0126750
Yin, W., and Hu, B. (2014). Knockdown of Lingo1b protein promotes myelination and oligodendrocyte differentiation in zebrafish. Exp. Neurol. 251, 72–83. doi: 10.1016/j.expneurol.2013.11.012
Zhong, J., and Zou, H. (2014). BMP signaling in axon regeneration. Curr. Opin. Neurobiol. 27, 127–134. doi: 10.1016/j.conb.2014.03.009
Keywords: hypoxia, oligodendrocyte, differentiation, myelination, bmp2b, zebrafish
Citation: Yang L-q, Chen M, Zhang J-l, Ren D-l and Hu B (2018) Hypoxia Delays Oligodendrocyte Progenitor Cell Migration and Myelin Formation by Suppressing Bmp2b Signaling in Larval Zebrafish. Front. Cell. Neurosci. 12:348. doi: 10.3389/fncel.2018.00348
Received: 29 June 2018; Accepted: 18 September 2018;
Published: 04 October 2018.
Edited by:
Stefania Ceruti, Università degli Studi di Milano, ItalyReviewed by:
Mario Valentino, University of Malta, MaltaAnil Kumar Challa, The University of Alabama at Birmingham, United States
Copyright © 2018 Yang, Chen, Zhang, Ren and Hu. This is an open-access article distributed under the terms of the Creative Commons Attribution License (CC BY). The use, distribution or reproduction in other forums is permitted, provided the original author(s) and the copyright owner(s) are credited and that the original publication in this journal is cited, in accordance with accepted academic practice. No use, distribution or reproduction is permitted which does not comply with these terms.
*Correspondence: Da-long Ren, rendl8736@ustc.edu.cn Bing Hu, bhu@ustc.edu.cn