Synapse-specific inhibitory control of hippocampal feedback inhibitory circuit
- 1 Axis of Cellular and Molecular Neuroscience, CRULRG, Québec, PQ, Canada
- 2 Department of Biochemistry, Microbiology and Bioinformatics, Faculty of Science and Engineering, Laval University, Québec, PQ, Canada
Local circuit and long-range GABAergic projections provide powerful inhibitory control over the operation of hippocampal inhibitory circuits, yet little is known about the input- and target-specific organization of interacting inhibitory networks in relation to their specific functions. Using a combination of two-photon laser scanning photostimulation and whole-cell patch clamp recordings in mice hippocampal slices, we examined the properties of transmission at GABAergic synapses formed onto hippocampal CA1 stratum oriens – lacunosum moleculare (O–LM) interneurons by two major inhibitory inputs: local projection originating from stratum radiatum interneurons and septohippocampal GABAergic terminals. Optical mapping of local inhibitory inputs to O–LM interneurons revealed that vasoactive intestinal polypeptide- and calretinin-positive neurons, with anatomical properties typical of type III interneuron-specific interneurons, provided the major local source of inhibition to O–LM cells. Inhibitory postsynaptic currents evoked by minimal stimulation of this input exhibited small amplitude and significant paired-pulse and multiple-pulse depression during repetitive activity. Moreover, these synapses failed to show any form of long-term synaptic plasticity. In contrast, synapses formed by septohippocampal projection produced higher amplitude and persistent inhibition and exhibited long-term potentiation induced by theta-like activity. These results indicate the input and target-specific segregation in inhibitory control, exerted by two types of GABAergic projections and responsible for distinct dynamics of inhibition in O–LM interneurons. The two inputs are therefore likely to support the differential activity- and brain state-dependent recruitment of hippocampal feedback inhibitory circuits in vivo, crucial for dendritic disinhibition and computations in CA1 pyramidal cells.
Introduction
GABAergic interneurons (INs) represent the dominant inhibitory cell type throughout the mammalian central nervous system and comprise an extremely heterogeneous population with divergent properties and highly specialized functions. These cells are critical regulating elements at all stages of information processing, from synaptic integration and spike generation to large-scale network activity, and are themselves controlled by specific inhibitory mechanisms. First, in the hippocampus, some subtypes of inhibitory INs are interconnected by chemical synapses and form closely interacting intrinsic inhibitory circuits (Cobb et al., 1997; Bartos et al., 2001; Ali, 2007; Karson et al., 2009). Intriguingly, one population of INs is specialized to innervate other GABAergic cells exclusively. To date, three types of so-called interneuron-specific interneurons (ISIs) have been described on the basis of their anatomical and neurochemical features (Acsády et al., 1996a,b; Gulyás et al., 1996). However, the physiological properties and roles of ISIs as well as the properties of the synapses formed by these cells on their GABAergic targets remain unknown. Second, GABAergic projections originating from the medial septum terminate on most INs (Freund and Antal, 1988; Gulyás et al., 1990), providing rhythmic inhibition and synchronization at theta frequency (Toth et al., 1997; Bland et al., 1999). Despite the potential strategic role of septal GABAergic input in controlling hippocampal network activity, the target-specific mechanisms of transmission at septohippocampal (SH) synapses are poorly understood.
Interneurons in the stratum oriens/alveus (O/A) with an axon projecting to the stratum lacunosum moleculare (O–LM cells) of the CA1 hippocampal area provide one of the major sources of feedback inhibition to the distal dendritic sites of pyramidal cells. Remarkably, O–LM INs are differentially recruited during brain-state-dependent network oscillations in vivo (sharp-wave associated ripples versus theta rhythm; Klausberger et al., 2003), implying an active role of inhibition in the control of O–LM IN activity. Moreover, the expression of anti-Hebbian long-term potentiation (LTP), a novel form of synaptic plasticity that requires postsynaptic hyperpolarization (Lamsa et al., 2007) at excitatory synapses on O–LM INs (Oren et al., 2009), provides further evidence of the important functional role of inhibition in these cells. O–LM INs appear to receive their sole intrinsic GABAergic input from type III ISIs (Acsády et al., 1996a,b). In addition, they can be innervated by SH GABAergic terminals (Gulyás et al., 1990). To date, the properties of inhibitory transmission onto these cells have been studied by analyzing a total inhibitory drive or inhibitory postsynaptic currents (IPSCs) evoked by global electrical stimulation (Morin et al., 1996; Hájos and Mody, 1997; Patenaude et al., 2001). Thus, the intricate details of synapse-specific organization of inhibition of O–LM INs remain unknown. Here, we applied a combination of optophysiological methods to dissect the mechanisms of inhibitory transmission onto O–LM cells. We found that the two major inhibitory inputs, the SH GABAergic projection and the local inhibitory input originating from putative type III ISIs, form inhibitory synapses with distinct functional properties and capacities for long-term plasticity, and may be well suited to control distinct functions in the operation of hippocampal feedback inhibitory circuit.
Materials and Methods
Slice Preparation
All experiments were carried out in accordance with the animal welfare guidelines of the Animal Protection Committee of the Université Laval. Transverse hippocampal or combined septohippocampal (SH) slices were prepared from C57BL/6 (Charles River, St Laurent, Québec, Canada) or VIP-eGFP (MMRRC strain #31009, STOCK Tg(Vip-EGFP)37Gsat, University of California, Davis, CA, USA) mice (P15–25). Animals were deeply anesthetized with 0.05% isoflurane and decapitated. The brain was removed rapidly into ice-cold (0 to +4°C) “cutting” solution containing (in mM): 250 sucrose, 2 KCl, 1.25 NaH2PO4, 26 NaHCO3, 7 MgSO4, 0.5 CaCl2, and 10 glucose, saturated with 95% O2 and 5% CO2, pH 7.4, 320–340 mOsm. For the SH slices, the brain was dissected as described previously (Toth et al., 1997). Briefly, a first parasagittal cut was made through the midline of one hemisphere to separate the brain into two pieces. A second parasagittal cut was made ∼2 mm lateral from the midline of the other hemisphere, extending from the rostral pole to a site close to the start of the fimbria. Then, a third cut was made from this point at 120° with respect to the sagittal plane. The planes defined by the second and third cuts were glued flat onto a vibratome table, thus straightening the SH projection. Slices (300 μm in thickness) were cut using a vibratome (Leica VT1000S; Leica Microsystems, Wetzlar, Germany) and transferred to a heated (35°C) oxygenated solution containing (in mM): 124 NaCl, 2.5 KCl, 1.25 NaH2PO4, 26 NaHCO3, 3 MgSO4, 1 CaCl2, and 10 glucose (30 min), after which they were kept at room temperature until use.
Electrophysiology
During experiments, slices were continuously perfused (2 mL/min) with standard artificial cerebro-spinal fluid (ACSF) containing (in mM): 124 NaCl, 2.5 KCl, 1.25 NaH2PO4, 26 NaHCO3, 2 MgSO4, 2 CaCl2, and 10 glucose, saturated with 95% O2 and 5% CO2, pH 7.4, at near-physiological temperature (30–33ºC). CA1 interneurons were visually identified using a 40× water-immersion objective and infrared differential interference contrast (Zeiss Axioscop) or Dodt infrared scanning gradient contrast (ISGC; Leica TCS SP5) optics. Enhanced green fluorescent protein (eGFP) – positive cells in slices obtained from vasoactive intestinal polypeptide (VIP) – eGFP animals were identified based on epi-fluorescence generated upon illumination with blue light (Zeiss Axioscop or Leica TCS SP5 filter set: 450–490 nm). Two-photon images of eGFP-positive cells in acute hippocampal slices were acquired using a two-photon laser scanning system (Leica TCS SP5 microscope with a 40×, 0.8 NA water-immersion objective; Leica Microsystems) based on a Ti-Sapphire laser (Chameleon Ultra II, Coherent, Missisauga, ON, Canada; >3 W, 140 fs pulses, 80 Hz repetition rate) tuned to 900 nm. Whole-cell or perforated-patch recordings from INs were performed in a voltage- or current-clamp mode using a Multiclamp 700B amplifier (Molecular Devices, Union City, CA, USA). Recording pipettes were made from borosilicate glass capillaries (1B100F-4; World Precision Instruments Inc., Sarasota, FL, USA) pulled on a Flamming/Brown-type micropipette puller (P-97; Sutter instruments, Novato, CA, USA). Pipette resistance was 3.5–6 MΩ for whole-cell and 2.5–3 MΩ for perforated patch-clamp recordings. For whole-cell recordings, the pipette solution contained the following (in mM): 130 KMeSO3, 2 MgCl2, 10 diNa-phosphocreatine, 10 HEPES, 2 ATP-Tris, 0.2 GTP-Tris and 0.15–0.2% biocytin, pH 7.25–7.35; 275–285 mOsm. In uncaging experiments, the cesium methyl sulfate-based pipette solution containing QX-314 (2 mM) was used to record IPSCs in O–LM INs.
For perforated patch-clamp recordings, the pipette solution contained (in mM): 130 KMeSO3, 2 MgCl2, 10 diNa-phosphocreatine, 10 HEPES, 2 QX-314, pH 7.25–7.35; 275–285 mOsm. Gramicidin D (0.1 mg/mL), prepared fresh as described previously (Oren et al., 2009), was included in the patch solution. The tip of the recording electrode was filled with gramicidin-free filtered potassium methyl sulfate solution. After the formation of a gigaohm seal, the access resistance was continuously monitored, and 25–30 min was typically required for successful perforation. Recordings were started when the access resistance was <50 MΩ and stable. The presence of QX-314 in the patch solution was used to assess the perforated-patch integrity, which was monitored by applying depolarizing pulses throughout the experiment. Failure to evoke action potentials indicated a rupture of the patch, in which case the recording was aborted. Following perforated-patch recordings, the pipette was carefully retracted and rapidly withdrawn from the slice, and the cell was re-patched in a whole-cell configuration to allow biocytin diffusion and subsequent morphological identification.
Monosynaptic unitary IPSCs were evoked at 0.1 Hz by minimal stimulation of the local hippocampal inhibitory projections using an electrode positioned at the border between the stratum pyramidale (PYR) and the stratum radiatum (RAD) in the CA1 area, or by minimal stimulation of SH GABAergic projections at the septal end of the fimbria in combined SH slices. A fine-tipped stimulation pipette (∼3 MΩ) was filled with ACSF and connected to a constant current isolation unit (A360LA; World Precision Instruments Inc., Sarasota, FL, USA) controlled by a data acquisition board (Digidata 1440; Molecular Devices, Sunnyvale, CA, USA) and the Clampex 10.2 software (Molecular Devices). The pipette was first positioned in the region of interest. Then, under visual control, it was moved along the PYR/RAD border or the septal bundle in SH slices, and pulses of high intensity (100–200 μ A) were applied to find a response. The stimulation intensity was then reduced to meet the criteria for minimal stimulation: IPSC failure rate ∼50%, invariant latency and shape of IPSCs, average amplitude, and failure rate independent of stimulus intensity over a range of ±5%, and lower stimulus intensities giving only failures (Jonas et al., 1993; Stevens and Wang, 1994; Raastad, 1995). When these criteria were met, we assumed that evoked IPSCs originated from the activation of a single axonal fiber, and, thus, were unitary. IPSCs were recorded at −40 mV in the presence of the NMDA and AMPA/kainate receptor antagonists DL-AP5 (50 μm; Ascent Scientific, Princeton, NJ, USA) and NBQX (10 μm; Ascent Scientific), respectively. Synaptic plasticity was induced by repetitive stimulation at 10 Hz for 2 s, which was delivered three times at 30 s intervals. Series resistance (8.5–23 MΩ) was monitored during all experiments by applying small hyperpolarizing voltage steps (−5 mV). The recordings were discontinued if the series resistance changed by more than 15%. Data acquisition (filtered at 2–3 kHz, digitized at 10 kHz) was performed using Clampex 10.2 (Molecular Devices). Data were analyzed using Clampfit 10.2 (Molecular Devices) and Igor Pro (WaveMetrics, Lake Oswego, OR, USA).
Two-Photon Laser Scanning Photostimulation by Glutamate Uncaging
To reduce the spontaneous synaptic activity during uncaging experiments, slices were perfused with ACSF containing higher Ca2+ (4 mM) and higher Mg2+ (4 mM) concentrations (Shepherd et al., 2003). To minimize the confounding effects of polysynaptic activation, DL-AP5 (50 μm) was also included in the ACSF (Shepherd et al., 2003; Brill and Huguenard, 2009). To avoid non-specific effects of 4-methoxy-7-nitroindolinyl (MNI)-caged glutamate (Glu) on inhibitory synaptic transmission (Fino et al., 2009) in the O/A, the compound was applied locally to INs of interest located at the border between the PYR and RAD. MNI-Glu (5 mM; Tocris) was delivered by micropressure pulses (2–5 psi, 3–10 ms) via a glass pipette (tip diameter of 2–3 μm) connected to a pressure application system (PicoSpritzer II; Parker Instrumentation, Fairfield, NJ, USA) and positioned ∼10 μm above the cell of interest visualized with a two-photon Dodt ISGC technique (Figure 1A). Two-photon Dodt ISGC images were acquired using a two-photon laser scanning system (Leica TCS SP5 microscope with a 40×, 0.8 NA water-immersion objective; Leica Microsystems) based on a Ti-Sapphire laser tuned to 730 nm (laser power measured under the objective, 5–10 mW). Focal photolysis of MNI-Glu was accomplished by illuminating the somatic region for 20–113 ms (laser power, 25–30 mW) right after puff application of the caged compound. Laser power was controlled by a Pockels cell. To prevent photodamage, the stimulations were repeated once every 30 s and the laser power did not exceed 40 mW (measured under the objective). To determine the spatial profile of IN photoactivation (Figure 1), the laser beam was subsequently moved away from the edge of the cell body to neighboring regions (with a step of 5–10 μm) whereas the puff pipette containing MNI-Glu remained in the same somatic position. Control experiments included the application of MNI-Glu without subsequent uncaging, and uncaging without prior application of MNI-Glu (Figure 1).
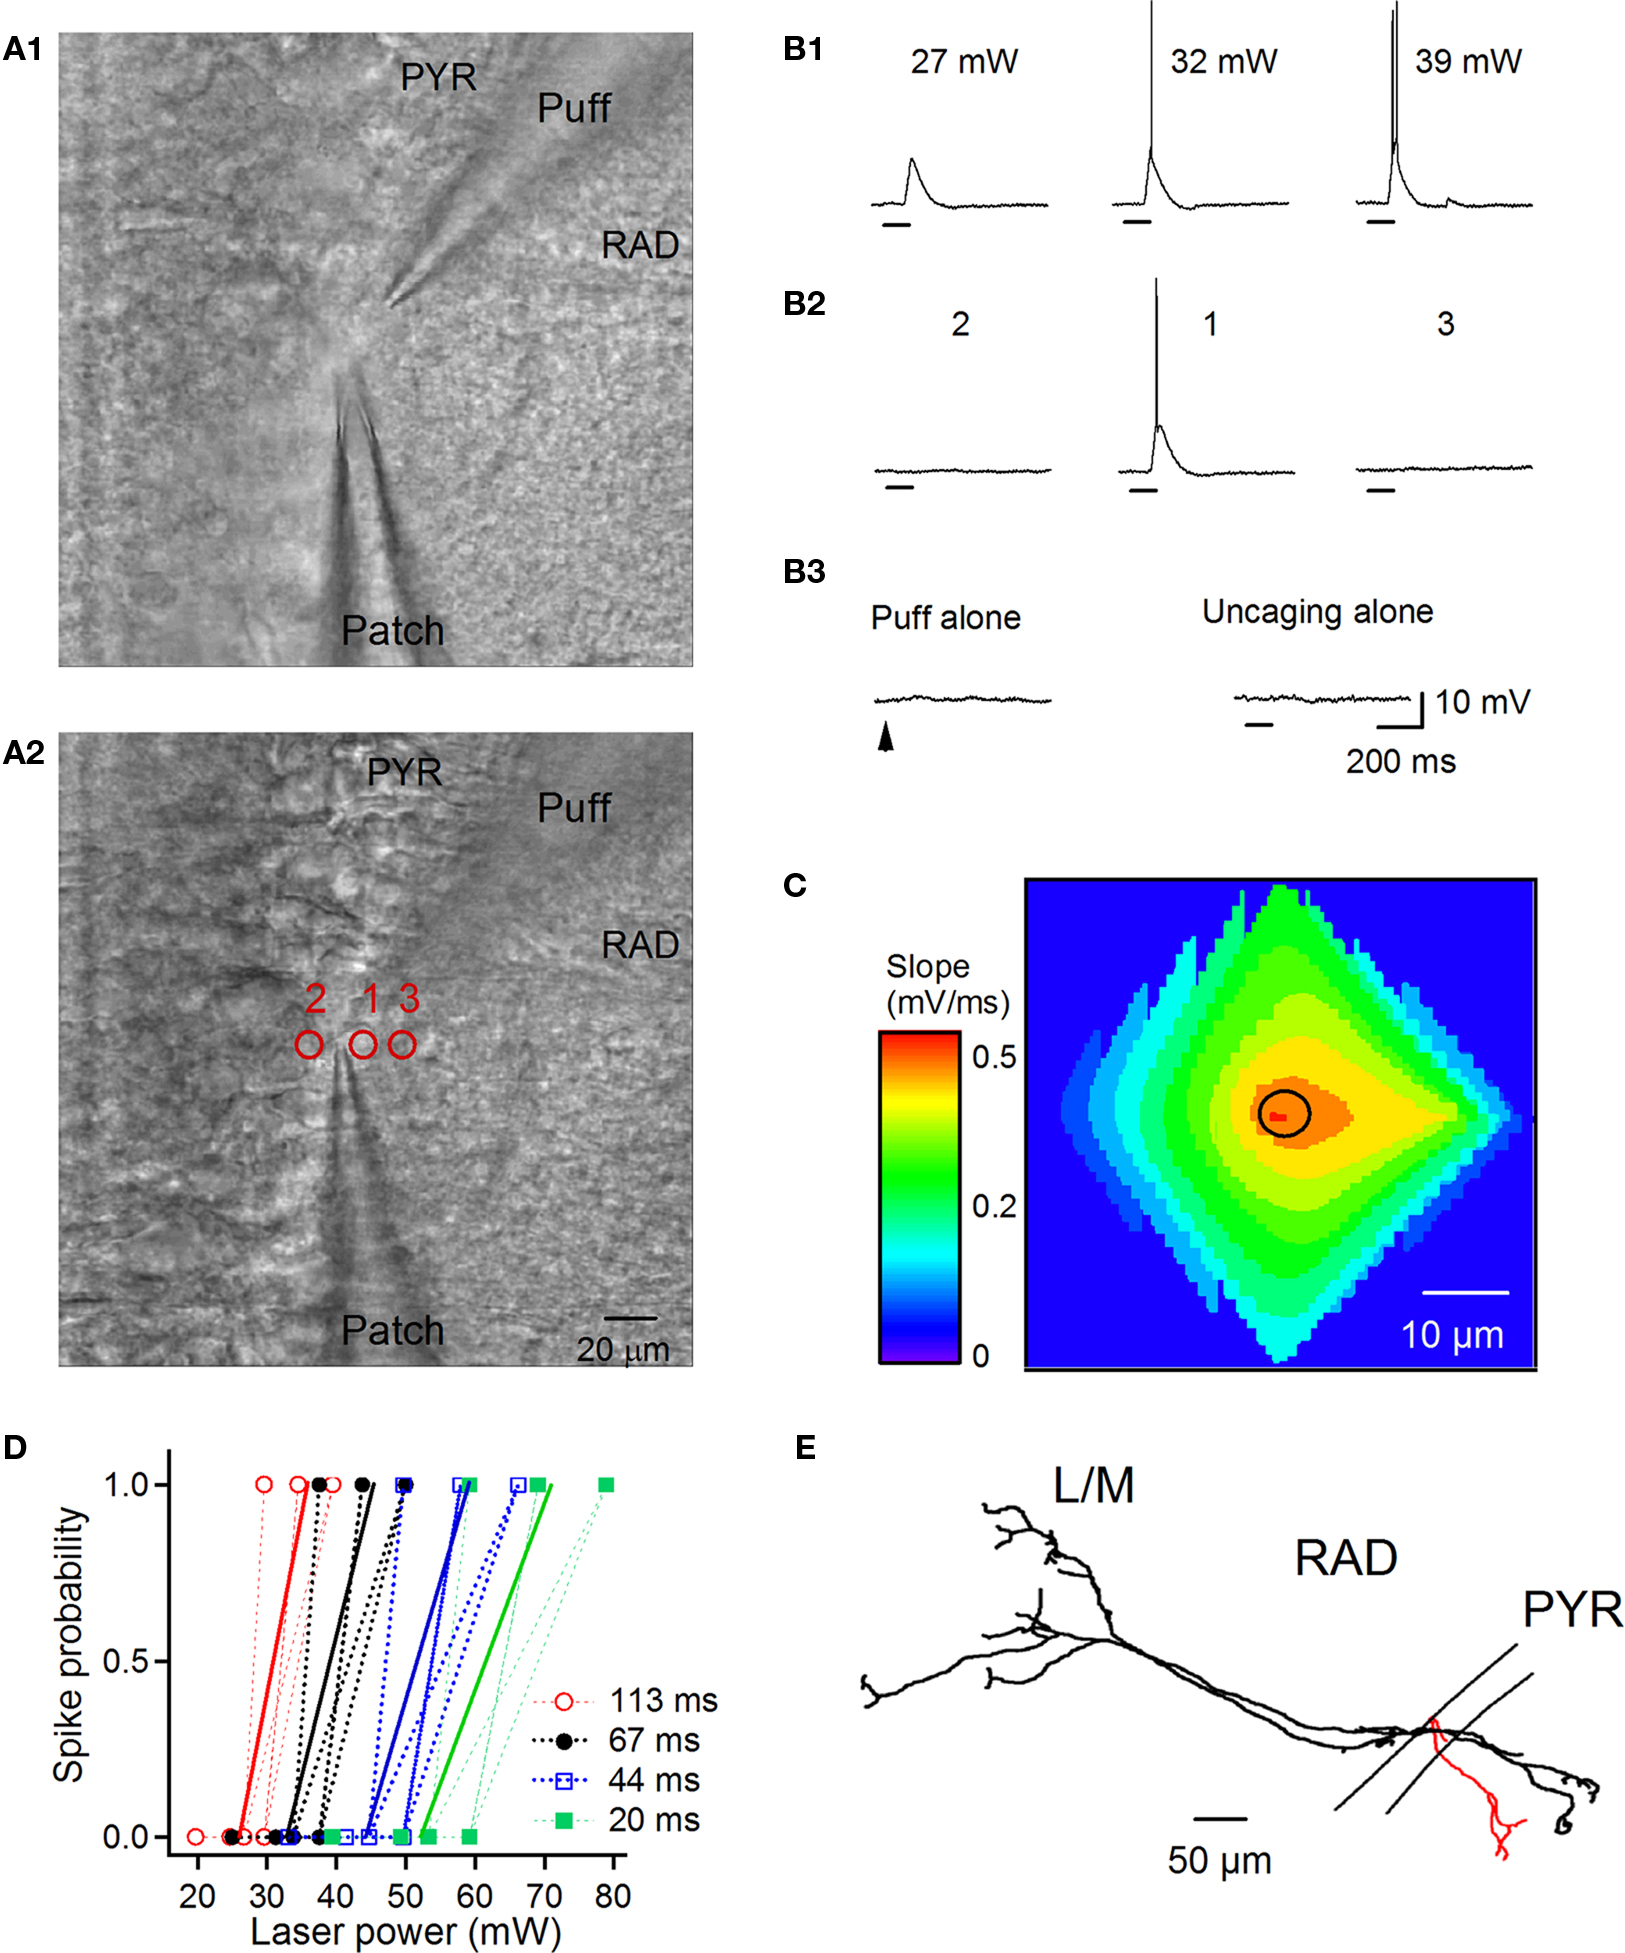
Figure 1. Laser-scanning photostimulation by glutamate uncaging of RAD INs. (A) Two-photon Dodt ISGC images of the hippocampal CA1 area showing the positioning of a puff pipette filled with MNI-Glu (A1) near the cell of interest (A2). Red circles with numbers (1–3) correspond to the areas of uncaging from which the recordings were obtained (B). (B) Postsynaptic responses evoked in the interneuron of interest (A2) by glutamate uncaging with different laser power (B1, uncaging area 1) and at different locations (B2, uncaging areas 1–3; laser power = 32 mW). Note that the puff application of MNI-Glu or uncaging alone (area 1; laser power = 32 mW) did not produce any postsynaptic responses (B3). Horizontal bars below the traces indicate the duration of uncaging pulses. (C) Contour plot of the spatial profile of IN photoexcitability with color coding for the slope of uncaging-evoked responses. A slope of 0.5 ± 0.04 mV/ms corresponds to the EPSP-spike sequence. The black circle indicates the cell body position. Note the high localization of action potential generation at the cell body level. (D) Spike probability as a function of laser power and pulse duration. Dotted lines correspond to individual cells and solid lines to the average spike probability for a given duration. Note that a minimal laser power of ∼30 mW was required to evoke a single spike using pulses of 113 ms. Successful photostimulation with shorter uncaging pulses (20–44 ms) required an increase in the laser power above 50 mW. (E) Neurolucida reconstruction of a RAD IN tested for photoexcitability and filled with biocytin. Soma and dendrites are shown in black, and axonal arborization is shown in red.
Data Analysis
Control experiments revealed that RAD INs generate uncaging-evoked action potentials within 120 ms from the beginning of the laser pulse of a 113-ms duration (Figure 1). Accordingly, uncaging-evoked responses were analyzed within this time window. Spatial maps of IN photoexcitability were constructed by plotting the mean slope of uncaging-evoked excitatory postsynaptic potentials (EPSPs) or EPSP-spike sequences for each location of photostimulation. For display only, minimal smoothing was performed on average contour plot from a representative cell (Figure 1C). IPSCs were considered as evoked by uncaging if: (1) they occurred within a 120-ms window, (2) they had a similar latency, and (3) they showed a similar rising phase (Figure 2A).
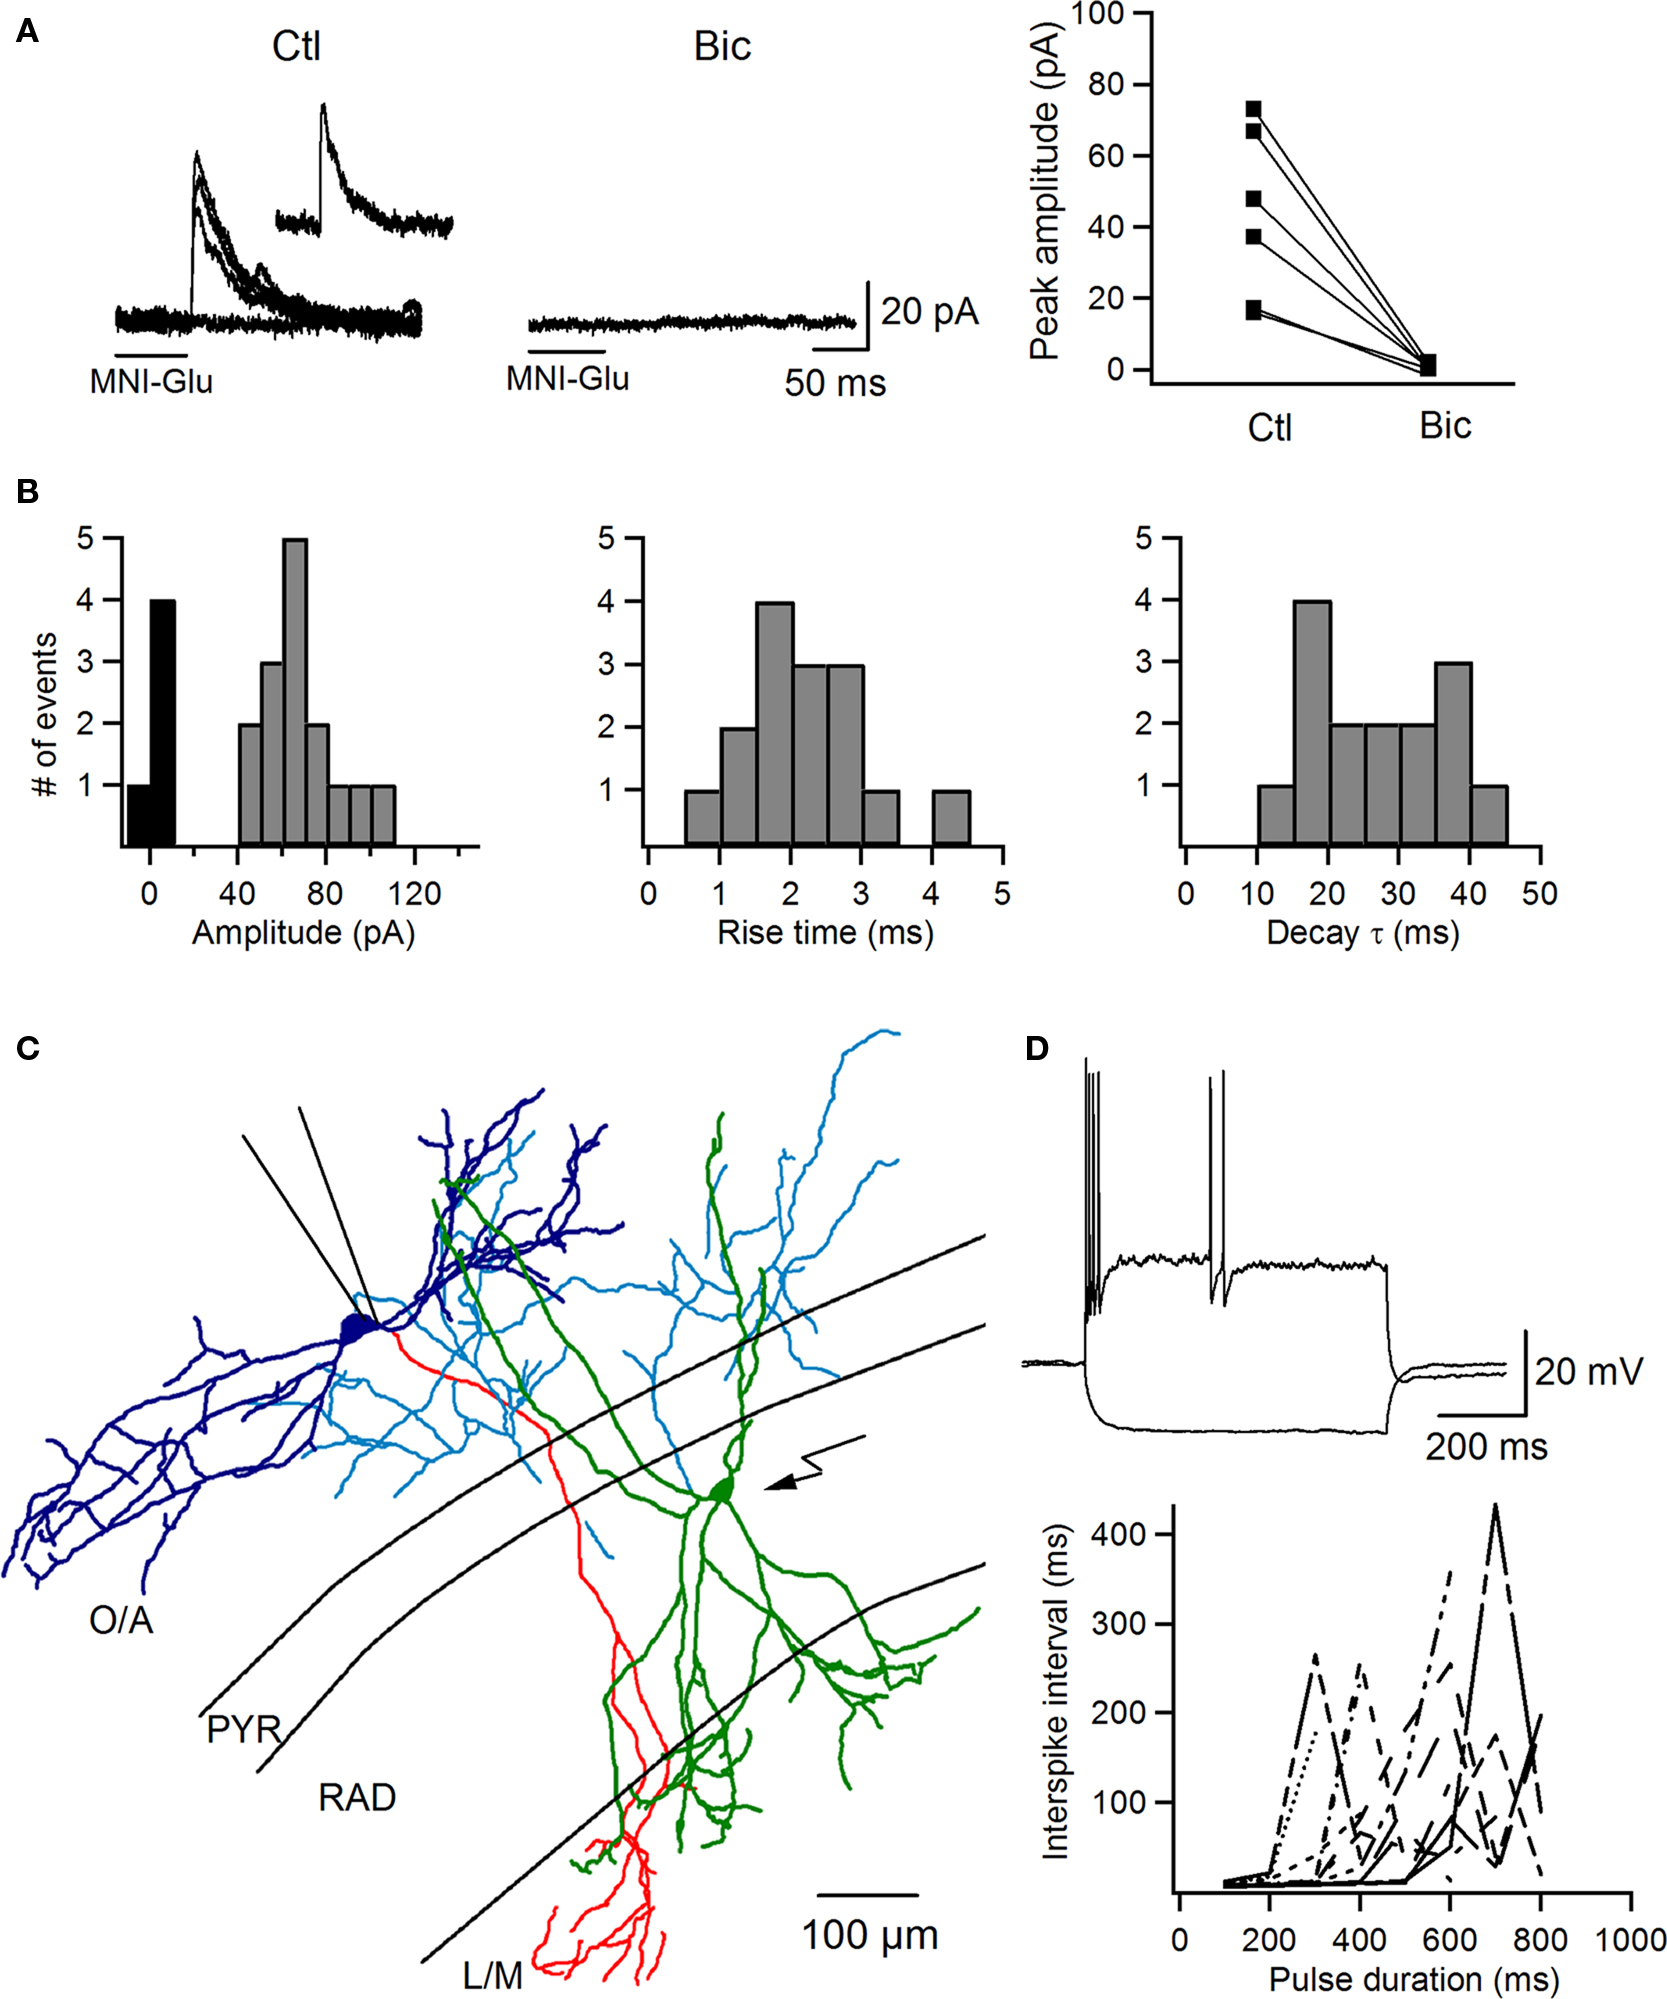
Figure 2. Optical targeting of local inhibitory input to O–LM INs. (A) Representative traces of IPSCs evoked in O–LM INs by local glutamate uncaging on PYR/RAD INs (uIPSCs; superimposition of three consecutive traces with an individual trace shown as an inset) in control and after application of bicuculline. The right panel shows summary data of uIPSC peak amplitude before and after bicuculline application (n = 6). Horizontal bars below the traces indicate the duration of uncaging pulses. (B) The distribution histograms of uIPSC peak amplitude (left), rise time (middle), and decay time constant (right) from all cells (n = 5). (C) Neurolucida reconstruction of monosynaptically connected RAD and O–LM INs filled with biocytin, showing anatomical features (bipolar orientation, extensive axonal arborization in the O/A) of an interneuron innervating an O–LM cell. Soma and dendrites of the presynaptic RAD IN are shown in green, and its axonal arborization is shown in blue. Soma and dendrites of the postsynaptic O–LM IN are shown in dark blue and its axonal arborization is shown in red. (D) Responses of the presynaptic RAD IN to current pulses (top) and a plot of the interspike interval as a function of pulse duration at different levels of membrane depolarization (bottom) demonstrating the irregular firing pattern of the RAD IN innervating the O–LM cell.
For the analysis of the firing pattern of INs in response to depolarizing current pulses, the firing frequency and the interspike interval were averaged within 100-ms bins for a total duration of depolarizing pulses (800 ms) and plotted as a function of pulse duration (Figures 2,3). IPSC amplitudes were measured at the peak of the waveform and, for group data, were normalized to the mean amplitude obtained during the baseline period (first 5 min). Group data are shown as mean ± SEM, and were analyzed using a Student’s paired t-test. For experiments, in which paired-pulse ratios (PPRs) were examined, two responses were evoked 50 ms apart at the baseline stimulation frequency of 0.1 Hz. The PPR was calculated as the ratio between the mean peak amplitude of the second response and the mean peak amplitude of the first response. The coefficient of variation (CV) of IPSCs was calculated as the ratio between the standard deviation of current amplitude and the mean current amplitude. Statistical significance between groups (Table 2) was assessed using the unpaired t-test. Pearson correlation was used to examine a correlation between the IPSC peak amplitude and rise time (Figure 4C3).
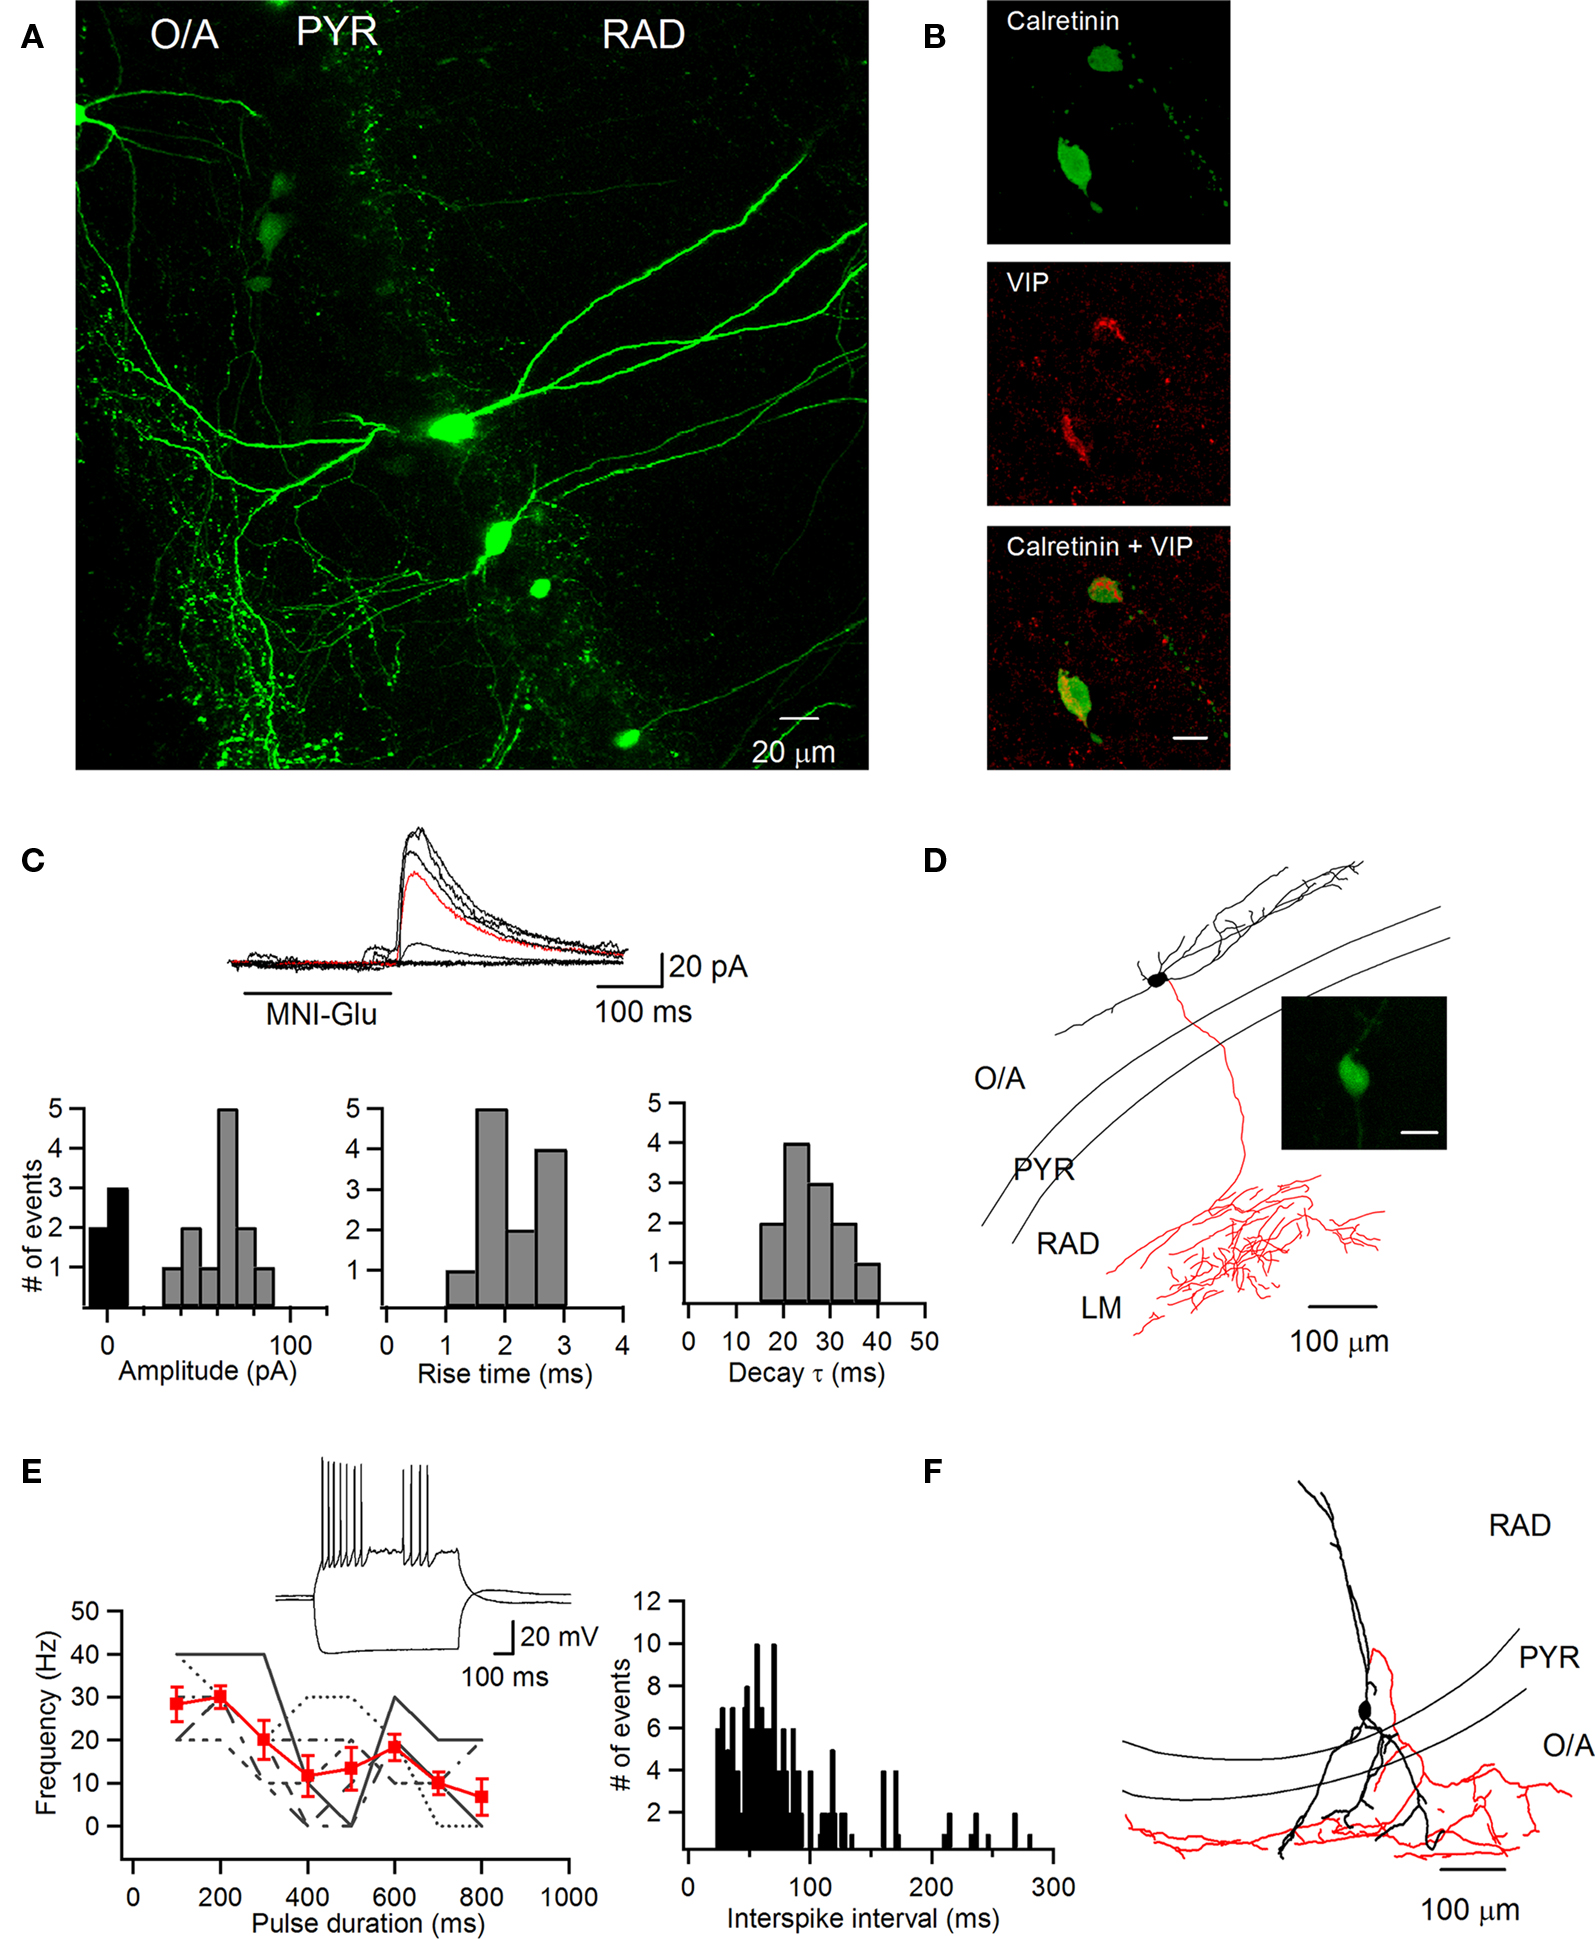
Figure 3. PYR/RAD INs positive for vasoactive intestinal polypeptide target O–LM INs. (A) Maximal projection of a two-photon z-stack acquired in the CA1 region of the hippocampus of a VIP-eGFP mouse, showing bipolarly oriented VIP-positive INs with a cell body located at the PYR/RAD border and a dense axonal arborization in the O/A. (B) Immunofluorescence images of neurons positive for calretinin (top) and VIP (middle) as well as their superimposition (bottom). Scale bar: 20 μm. (C) Sample traces of uIPSCs (six consecutive traces with an average trace shown in red; top) evoked in O/LM IN (D) by photostimulation of the bipolarly oriented VIP-positive cell (D, inset; scale bar: 20 μm) and the distribution histograms of uIPSC peak amplitude (left), rise time (middle), and decay time constant (right) from all VIP-positive cells (n = 4). (D) Neurolucida reconstruction of an O–LM IN from which the recording was obtained (C). Inset shows a VIP-positive IN, which was stimulated by uncaging. (E) Example of a firing pattern (top) of a VIP-positive IN and a summary plot of firing frequency as a function of pulse duration (bottom left; data from individual cells are shown in black and the group average is shown in red) and interspike interval histogram (bottom right) showing irregularity in IN firing. INs were depolarized to −40 mV. (F) Reconstruction of a bipolarly oriented VIP-positive cell, showing anatomical features of a putative type III ISI (soma and dendrites are shown in black and its axon is shown in red).
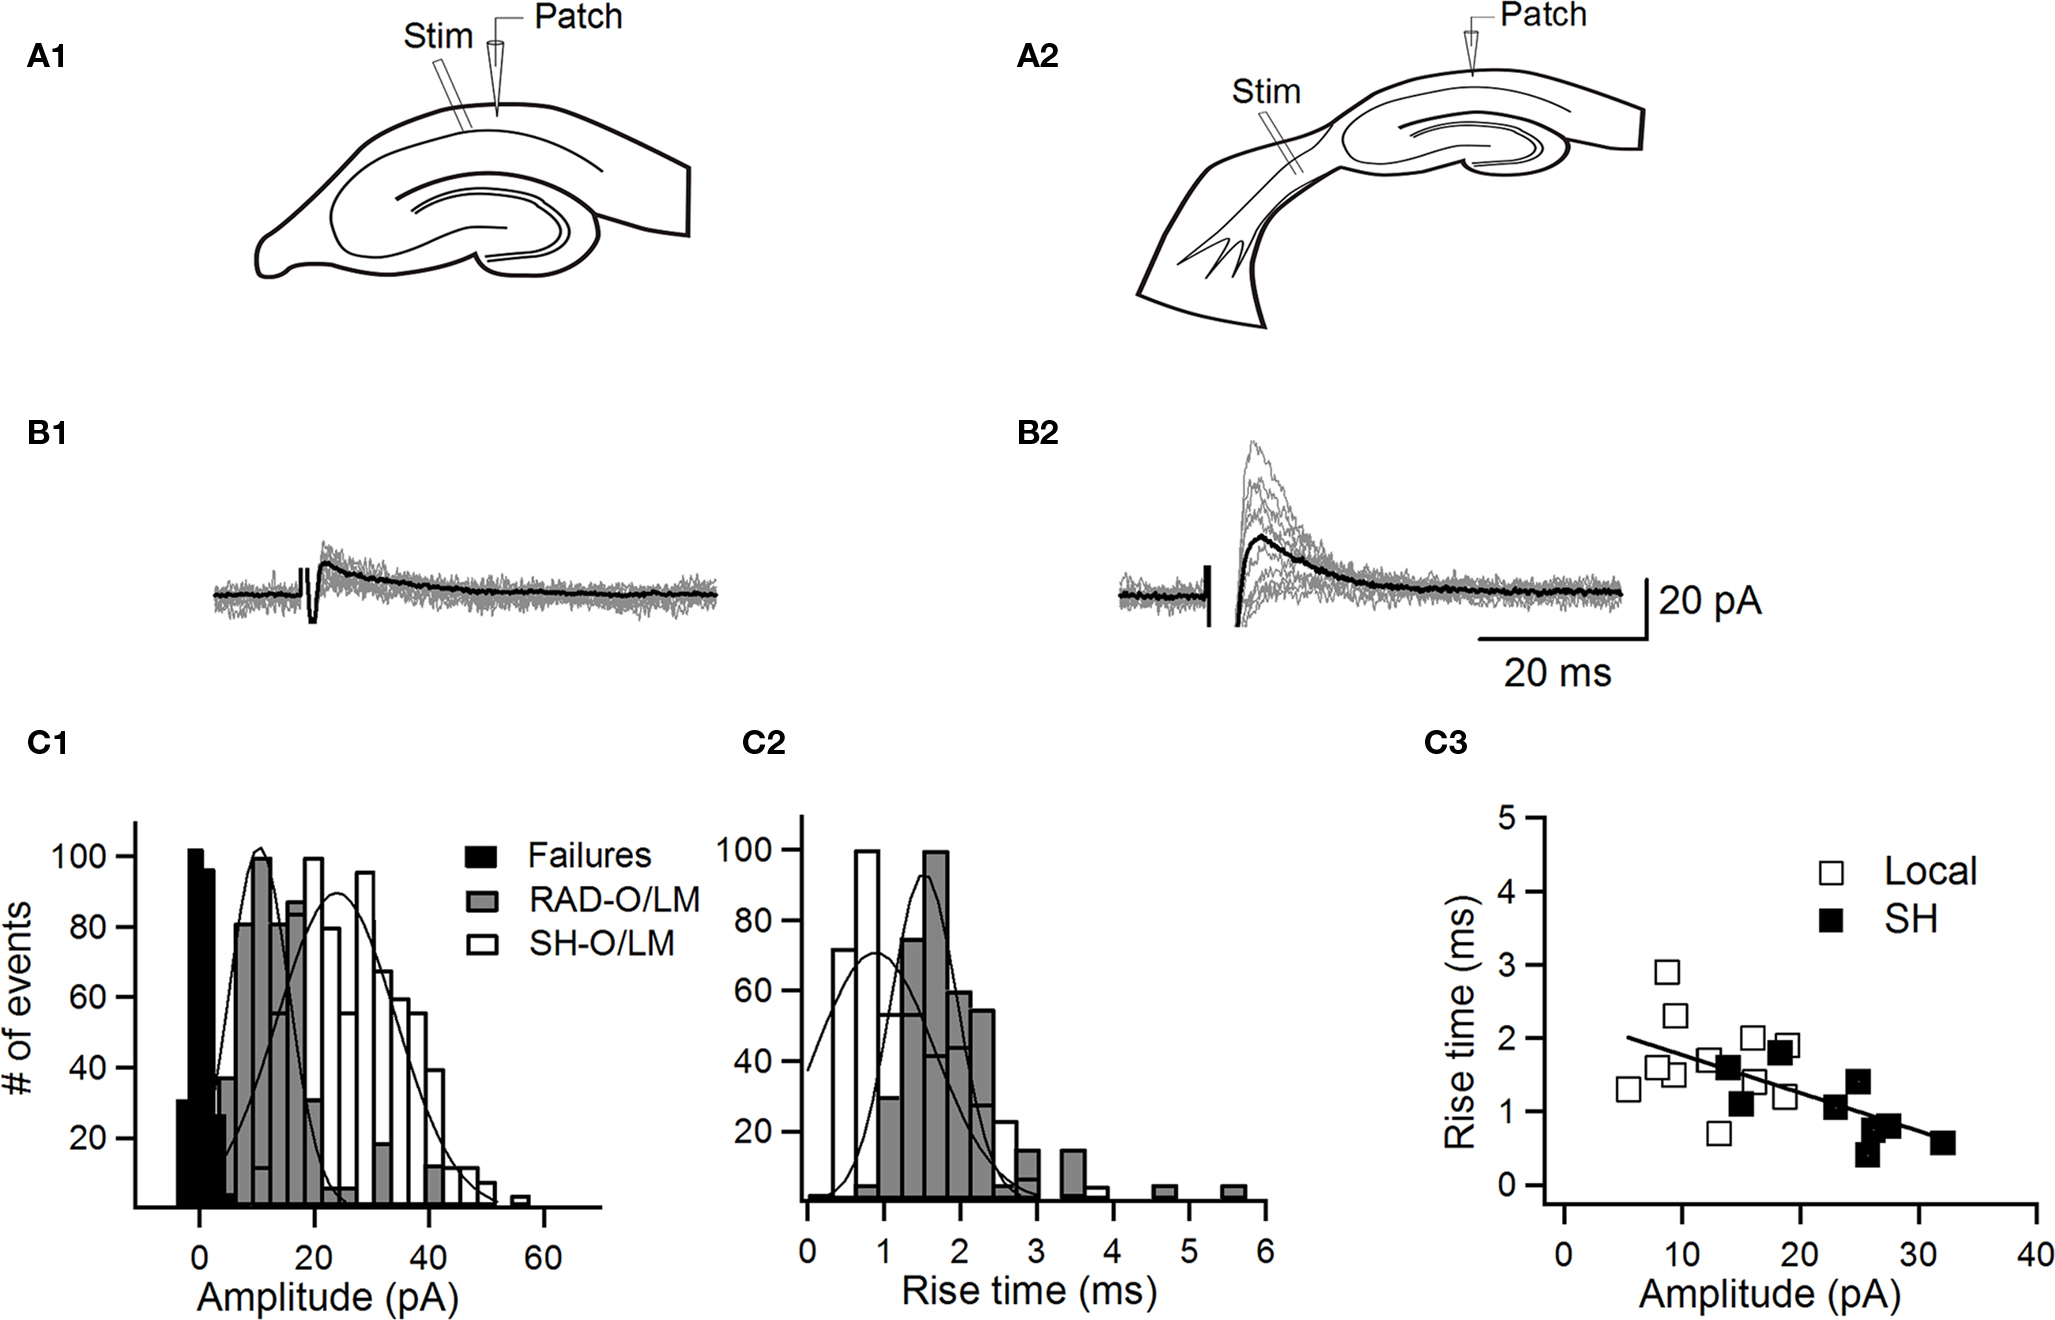
Figure 4. Input-specific properties of inhibitory synapses onto O–LM INs. (A) Schematic of the recording and stimulation configuration in hippocampal (A1) and septohippocampal (A2) slices. (B) Sample traces of IPSCs (10 consecutive traces with an average trace shown in black) evoked in O–LM INs by local minimal stimulation in PYR adjacent to st. radiatum (B1) and by minimal stimulation of the SH inhibitory projection (B2). (C) Graphs of normalized distribution histograms of IPSC peak amplitudes (C1), rise times (C2), and a relationship between the rise time and the IPSC peak amplitude (C3), with a line corresponding to a linear fit between the data points.
Anatomical Reconstruction and Immunocytochemistry
For anatomical reconstruction, neurons were filled with biocytin (Sigma) during whole-cell recordings. Slices with recorded cells were fixed overnight with 4% paraformaldehyde at 4°C. The next day, slices were rinsed in 0.1 M sodium phosphate buffer and stored at 4°C until processing. To reveal biocytin, slices were rinsed several times in Tris-buffered saline (TBS; pH = 7.4, t = 25°C), treated with hydrogen peroxide (0.3%) for 30 min, then rinsed again in TBS and permeabilized with 3% triton X-100 in TBS (Glickfeld and Scanziani, 2006) for 1 h. To reduce non-specific background staining, the slices were then incubated for 30 min in TBS containing 10% normal goat serum (NGS) and 0.5% bovine serum albumin (BSA). Finally, the slices were incubated overnight at 4°C with a streptavidin-conjugated Alexa-546 (dilution, 1:200; Jackson Immunoresearch, West Grove, PA, USA) in TBS containing 1% NGS and 0.5% BSA. The following day, sections were rinsed with TBS and mounted in Dako fluorescence medium (Dako Canada Inc, Mississauga, ON, Canada). Confocal images of biocytin-filled INs were obtained using a Leica TCS SP5 imaging system coupled to a 543-nm HeNe laser. IN Z-stacks were acquired with a 1- μm step. Final stacks containing different parts of INs were merged using Neurolucida 8.26.2 (MBF Bioscience, Williston, VT, USA), and selected cells were reconstructed.
For immunocytochemical analysis, animals were perfused with 4% paraformadehyde and the brain was sectioned to 40 μm. Sections were treated with hydrogen peroxide, permeabilized with 0.2% triton X-100 in TBS containing NDS (1%) and BSA (2%) and incubated overnight at 4°C with a rabbit VIP (dilution, 1:200; AbD Serotec) and a goat calretinin (dilution, 1:1,000; Santa Cruz) antibodies. The following day, sections were rinsed with TBS and incubated with an anti-rabbit Texas Red and anti-goat FITC secondary antibodies (dilution, 1:200; Jackson Immunoresearch) for 1.5 h. Sections were then rinsed in TBS and mounted in Dako fluorescence medium (Dako Canada Inc.). Images were captured using a Leica TCS SP5 system.
Results
Targeting of Local Inhibitory Connections to O–LM INs Using Laser Scanning Photostimulation by Glutamate Uncaging
Here, we focused on hippocampal CA1 O/A INs, with a cell body located at the border between the stratum oriens and the alveus, horizontally running spiny dendrites and an axon projecting to the stratum lacunosum-moleculare, i.e., the O–LM cells, which provide an important source of dendritic feedback inhibition to CA1 pyramidal neurons. Among 91 INs recorded, 73 neurons were labeled successfully with biocytin. Of these cells, 43 neurons were identified as O–LM INs based on anatomical properties; these cells were included in the present study (Figures 2C,3D). Anatomical data suggest that O–LM INs are locally innervated by type III ISIs (Acsády et al., 1996a,b). These cells have somas located in the stratum (st.) pyramidale–radiatum (PYR/RAD), radial dendrites that cross all layers, and axons that form a dense terminal plexus at the O/A border. In addition, other subtypes of PYR/RAD INs, with axons ramifying partially in the O/A and a preferential innervation of CA1 pyramidal neurons (e.g., basket cells, bistratified cells), may potentially contact O–LM INs. Thus, by simultaneously recording from O–LM cells and optically stimulating (by local two-photon glutamate uncaging) INs located in the RAD adjacent to the PYR, we first aimed to map the local inhibitory connections to O–LM INs and to identify their origin.
Given that the effective resolution of optical mapping experiments depends on both the structure and membrane properties of particular classes of neurons to be stimulated together with the uncaging experimental settings (the type and concentration of caged compounds, the intensity and duration of the laser pulse, and the depth from the slice surface; Callaway and Katz, 1993; Shepherd et al., 2003; Fino et al., 2009), we first characterized the photoexcitability of INs located on the border between the PYR and the RAD, and determined the optimal conditions required for reliable mapping of synaptic connectivity. PYR/RAD INs were recorded in whole-cell current-clamp mode at a depth of 50–150 μm from the slice surface (Figure 1). Two-photon Dodt-IRSGC imaging was used to set up the upper surface of the IN cell body as a focal plane (Figure 1A2). A puff pipette, filled with MNI-Glu (5 mM), was positioned ∼10 μm above the IN being recorded (Figure 1A1), and the compound was locally applied using brief micropressure pulses (2–5 psi, 3–10 ms). Following microinjection, MNI-Glu was immediately uncaged by illuminating a small area (diameter of ∼8 μm) bordered on top of the cell surface with laser pulses of different intensity and duration (Figures 1B1,D). Our data showed that laser power of 15–28 mW (with pulse duration of 113 ms) was efficient in eliciting EPSPs in PYR/RAD INs (Figure 1B1, left). Higher laser power (∼30–35 mW, with the same pulse duration) was required to evoke individual action potentials in these cells (Figures 1B1,D). Laser pulses of shorter duration (20–67 ms) also successfully triggered single spikes in these cells; however, this required a substantial increase in laser power (above 50 mW). Given that, after several trials, such high intensity of photostimulation could result in irreversible IN depolarization and photodamage, 30 mW/113 ms laser pulses were used in all subsequent uncaging experiments (Figures 1B2,C,2,3). We mapped the distribution of locations from which glutamate uncaging could trigger action potentials in individual PYR/RAD INs (Figures 1B2,C). For all cells (n = 4), action potentials were generated only by uncaging at perisomatic locations, and either EPSPs or no response was obtained from neighboring regions (Figures 1B2,C). Furthermore, MNI-Glu application without subsequent uncaging or uncaging alone evoked no response (Figure 1B3). These data indicate that the photostimulation approach used here offers an efficient way of achieving neuron photoexcitation with single-cell resolution; thus, it is well suited for mapping synaptic connections between specific types of neurons.
Next we used this approach to map and characterize the local GABAergic input to O–LM INs (Figures 2,3). We recorded O–LM INs in voltage-clamp mode at +10 mV, which in our recording conditions was near the EPSC reversal potential. The chloride reversal potential in our experiments was −71.9 ± 1.2 mV (n = 24); therefore, at +10 mV we were able to record large-amplitude outward IPSCs. In the case of connection, glutamate uncaging at PYR/RAD IN cell bodies evoked outward currents in O–LM INs, which had an onset latency of <7 ms (measured from the end of the uncaging pulse) and were completely blocked by the GABAA receptor antagonist bicuculline (10 μm; n = 6; Figure 2A), suggesting that these events were monosynaptic IPSCs. These uncaging-evoked IPSCs (uIPSCs) demonstrated large amplitudes, low failure rate and slow kinetics (amplitude: 67.1 ± 4.1 pA, failure rate: 28.6 ± 8.4, 20–80% rise time: 2.1 ± 0.2 ms, decay time constant: 26.0 ± 2.5 ms, n = 5; Figure 2B). The probability of finding a synaptically connected pair of INs was ∼22% (11 connected pairs from 51 tested).
To examine the origin of the local inhibitory input to O–LM INs, PYR/RAD INs that produced uIPSCs in O–LM cells following photostimulation were recorded in whole-cell current-clamp mode, filled with biocytin and anatomically reconstructed (Figure 2C). Our data showed that each PYR/RAD IN that connected to an O–LM IN had a soma at the border between the PYR and RAD or within the inner third of the RAD, bipolar orientation of dendritic arbors with 2–5 major dendrites spanning all CA1 layers and an axon projecting to the O/A. An example of such IN connected to an O–LM cell is shown in Figure 2C. Furthermore, as evidenced from the analysis of the interspike interval, all INs connected to O–LM cells showed an irregularly spiking or stuttering firing pattern at all levels of membrane depolarization (n = 4; Figure 2D).
Type III ISIs express vasoactive intestinal polypeptide (VIP) and calretinin (CR) (Acsády et al., 1996a,b; Gulyás et al., 1996). Thus, to examine whether the PYR/RAD INs connected to O–LM cells were type III ISIs, we repeated uncaging experiments using the VIP-eGFP transgenic mouse model. In slices obtained from these animals, VIP-positive cells (10–15 cells/slice) of different morphologies were present in all layers of CA1 hippocampal area (data not shown). Consistent with previous data (Acsády et al., 1996a,b), a population of bipolarly oriented VIP-positive INs was routinely found inside the PYR and at the PYR/RAD border, with dendrites crossing all layers and a dense axonal arborization within the O/A (5–7 cells/slice; Figure 3A). The majority of these cells were immunopositive for CR (17 out of 23; Figure 3B), indicating that they were ISIs. Next we examined their possible connectivity with O–LM INs. Our data showed that photostimulation of bipolarly oriented VIP-positive cells located at the PYR/RAD border by two-photon glutamate uncaging evoked monosynaptic uIPSCs of large amplitude, low failure rate and slow kinetics (amplitude: 60.5 ± 3.8 pA, failure rate: 24.4 ± 6.2, 20–80% rise time: 2.1 ± 0.2 ms, decay time constant: 28.3 ± 2.1 ms, n = 4; Figure 3C), whereas photostimulation of VIP-negative INs produced no response in O–LM cells (no connection out of 38 attempts). The probability of finding connected INs when stimulating bipolarly oriented VIP-positive cells was ∼36% (4 connected pairs from 11 tested). These data strongly suggest that one of the major local inhibitory inputs to O–LM INs originates from a population of bipolarly oriented VIP-positive INs. To further examine the properties of bipolarly oriented VIP-positive INs, these cells were recorded in whole-cell current-clamp mode, filled with biocytin and processed for anatomical reconstruction. Consistent with anatomical profile of type III ISIs (Acsády et al., 1996a,b;), bipolarly oriented VIP-positive INs recorded in our experiments had cell bodies located in the PYR or inner third of the RAD, 2–5 radially oriented dendrites crossing all layers, and an axon ramifying within O/A with a dense plexus at the border between the oriens and the alveus (Figure 3F). The passive and active membrane properties of these cells were similar to those of other types of hippocampal INs (Table 1). Furthermore, consistent with our data in wild-type animals, these cells exhibited the irregularly spiking firing pattern (Figures 3E,2D). Indeed, a large variability in both the spike frequency and the interspike interval were observed in all cells examined (Figure 3E). Together, these data indicate that PYR/RAD INs, that demonstrate an irregularly spiking firing pattern, express VIP and CR and reveal anatomical properties of type III ISIs, provide one of the major sources of local inhibition to O–LM INs.
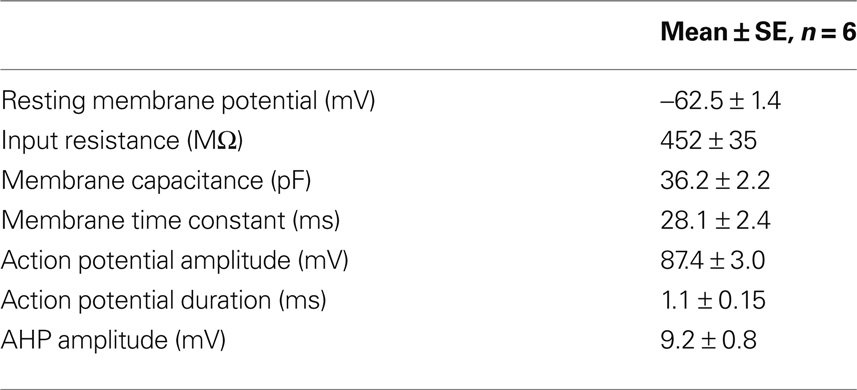
Table 1. Passive and active physiological properties of putative type III ISIs.
Input-Specific Properties of Inhibitory Synapses Onto O–LM INs
To characterize the dynamics of transmission at local inhibitory synapses on O–LM INs in more physiological conditions (standard ACSF, at −40 mV) and to compare it with synapses formed by a major extrinsic inhibitory projection from the medial septum, we applied next a paradigm of minimal electrical stimulation in hippocampal and combined SH slices (Figures 4–6). As O–LM INs receive a major local inhibitory input from INs located in the PYR/RAD (Figures 2,3) and given that relatively few SH fibers are present in the PYR (Freund and Antal, 1988; Eyre et al., 2007; Takács et al., 2008), in all subsequent experiments we selectively stimulated local inhibitory input with an electrode placed in the PYR close to the RAD (Figures 4A1,5A1,6A1). The SH IPSCs were evoked by stimulating the septal end of the fimbria (Toth et al., 1997; Figures 4A2,5A2,6A2). Although by stimulating the fimbria we could potentially activate hippocampal INs that project to the medial septum (HS cells) but give local collaterals in the CA1 O/A, the main local axonal targets of these cells are CA1 pyramidal neurons (Jinno et al., 2007; Takács et al., 2008). Moreover, a small subpopulation of HS cells that could potentially target GABAergic INs in the O/A is reported to be extremely vulnerable to the slicing procedure (up to 80% of these cells die during slicing; Gulyás et al., 2003; Takács et al., 2008). Thus, their recruitment was unlikely in our experimental conditions. In both slice preparations, the stimulation electrode was first positioned in the region of interest and then moved, under visual control, along the PYR/RAD border or the SH pathway while stimulating at a relatively high intensity (100–200 μ A) necessary to find a well-defined response. The stimulation intensity was then reduced to meet the criteria for minimal stimulation (see Material and Methods), which allowed a local activation of a single fiber (Jonas et al., 1993; Stevens and Wang, 1994; Raastad, 1995) and, accordingly, recording of unitary evoked IPSCs (eIPSCs; Figures 4B1,B2).
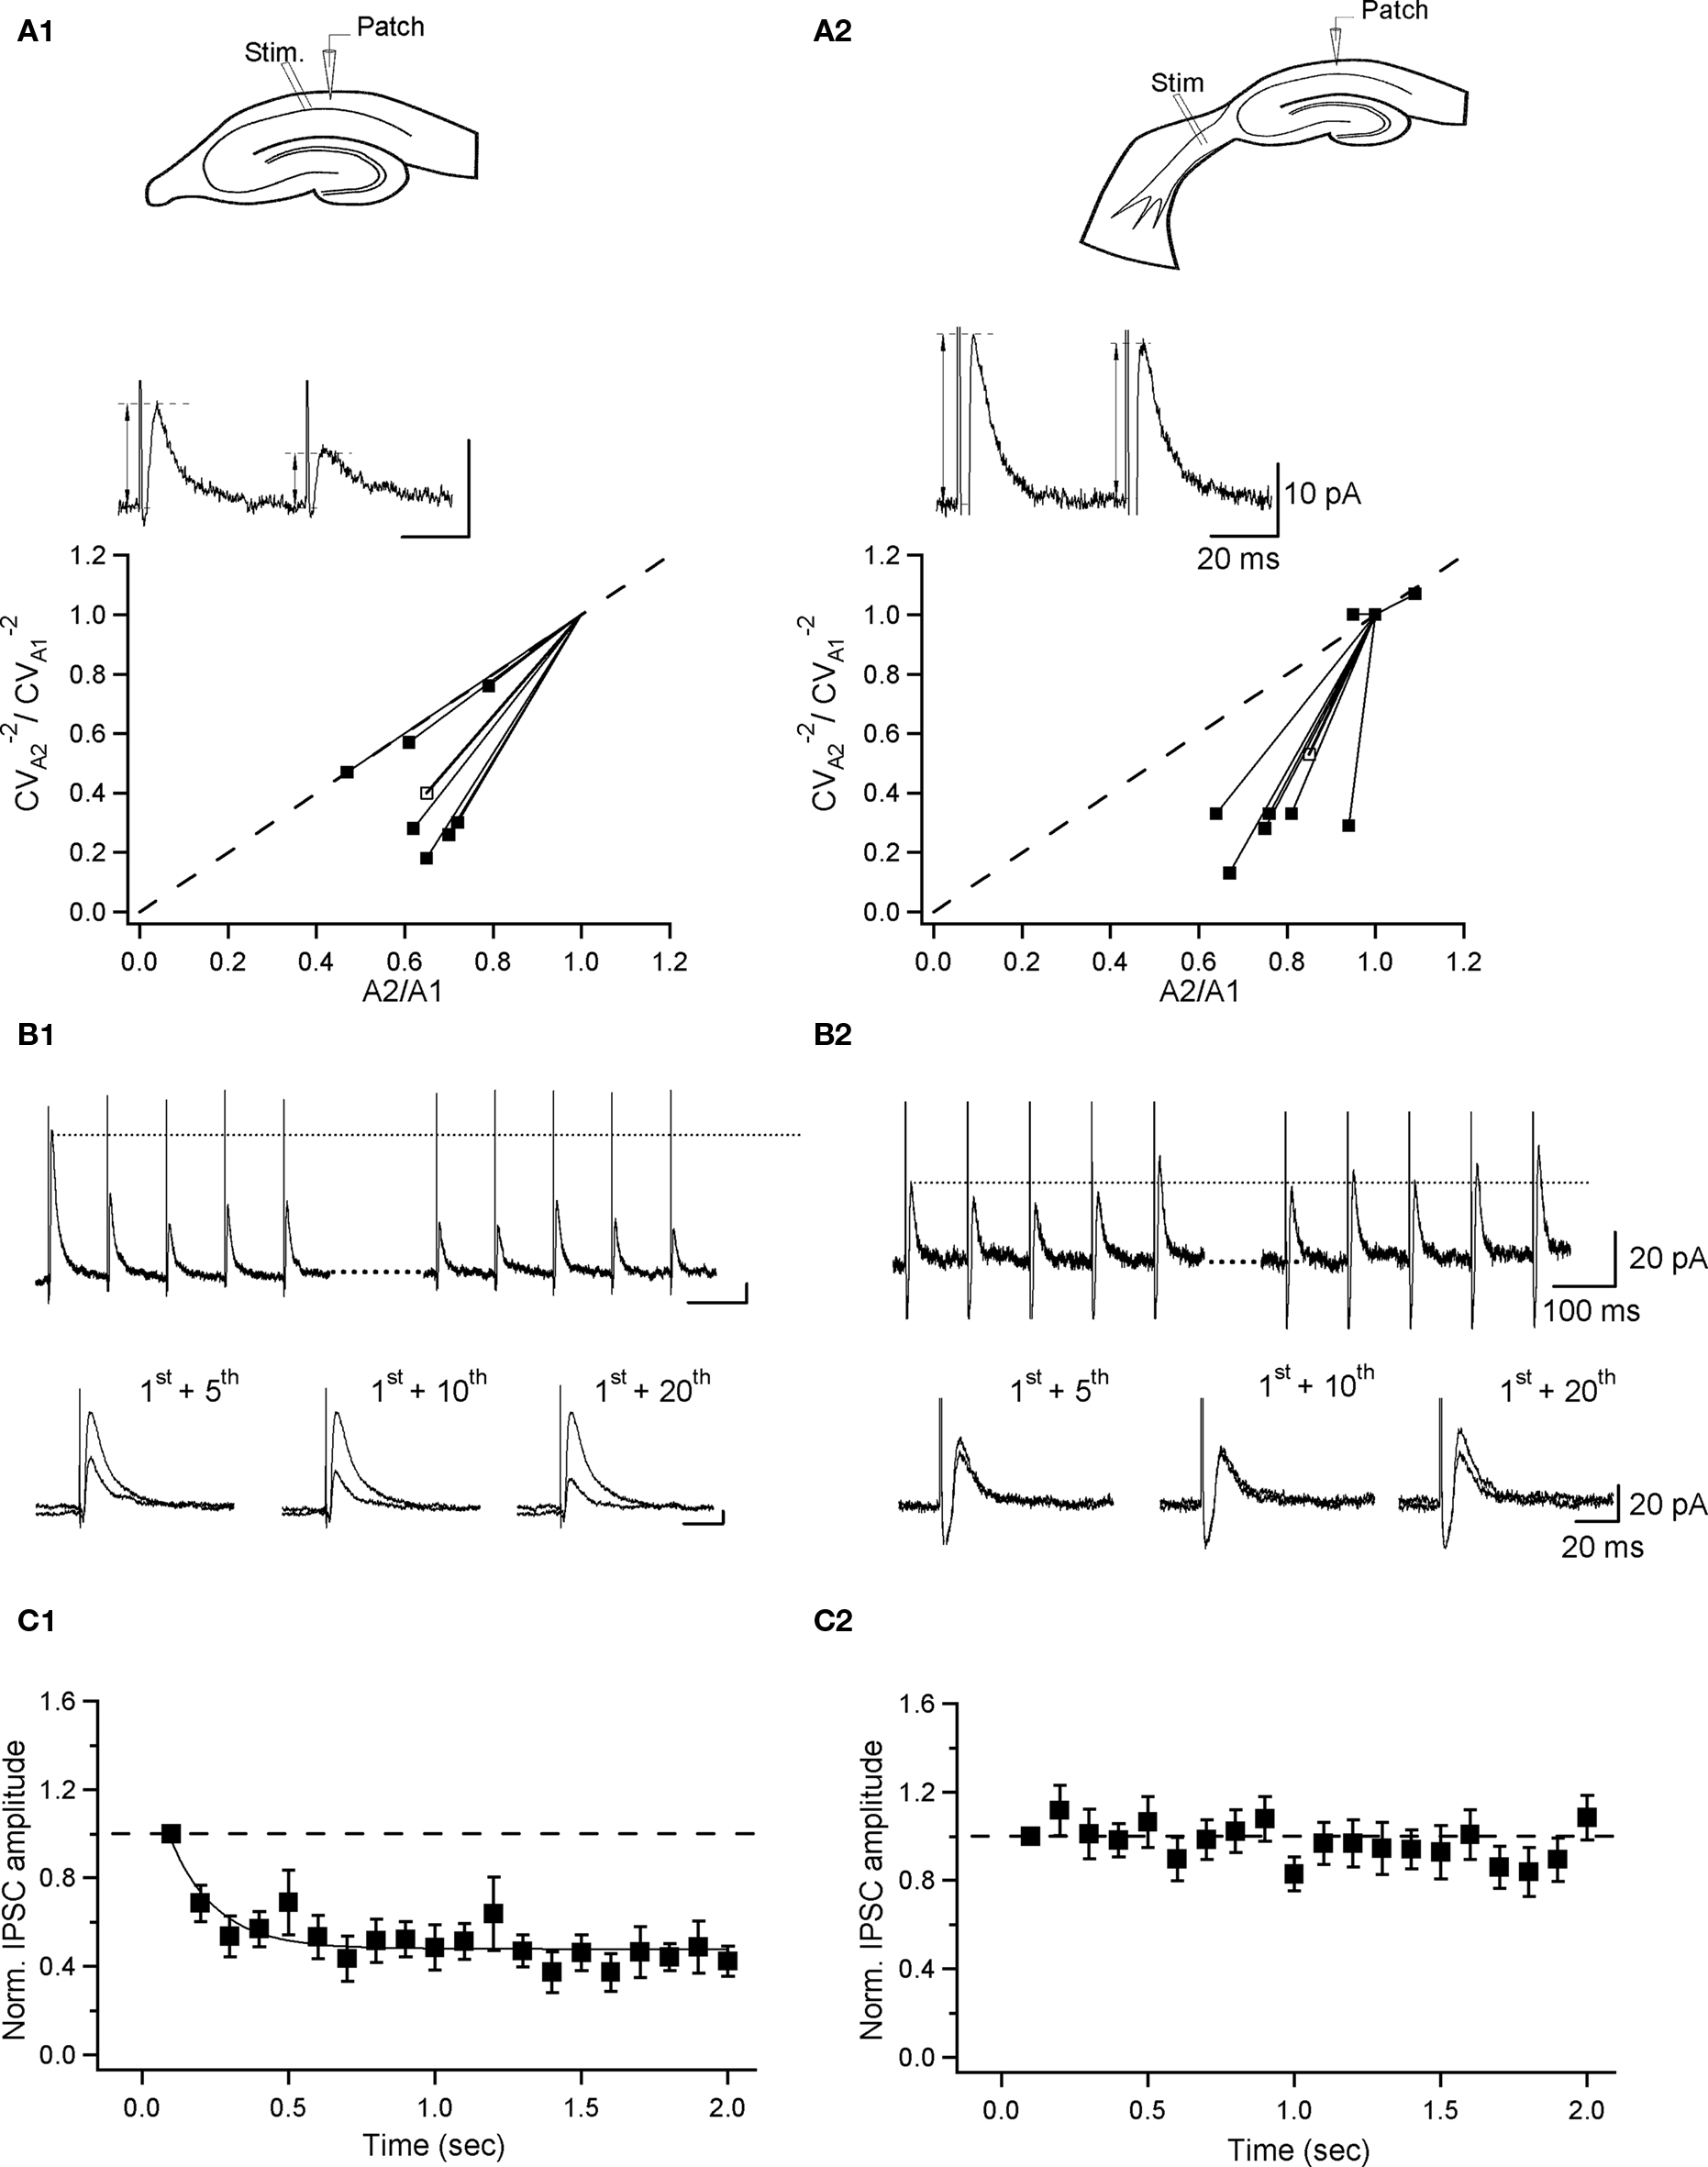
Figure 5. Distinct dynamics of inhibition at local and septohippocampal synapses. (A) Schematic of the recording and stimulation configuration in hippocampal (A1) and septohippocampal (A2) slices (top) and sample traces of eIPSCs (average of 10 sweeps; failures excluded) evoked by paired-pulse stimulation at local (A1) and SH (A2) synapses together with summary plots (bottom), showing the coefficient-of-variation analysis of paired-pulse depression of eIPSCs at two synapses. The inverse of the square of the coefficient of variation of the second response ( ) was plotted versus the mean peak amplitude; data were normalized by the
  and the mean of the first response, respectively. Thick lines with open symbols correspond to the average values. Interpulse interval was 50 ms. (B,C) Short-term plasticity of eIPSCs at two synapses during repetitive stimulation at 10 Hz. (B), IPSCs evoked by the first (left) and last (right) five stimuli in a train of 20 stimuli (top), and a superimposition of the first and fifth (bottom left), first and 10th (bottom middle) and first and 20th (bottom right) responses during the train; the traces represent averages of three sweeps. (C) Time course of eIPSC amplitude during 10-Hz train. The curve at C1 corresponds to a single exponential fit to the data points, with τ = 0.16 s. Note that there is a significant depression at local synapses (n = 6) and no change during the train at SH synapses (n = 7). Error bars throughout represent SEM.
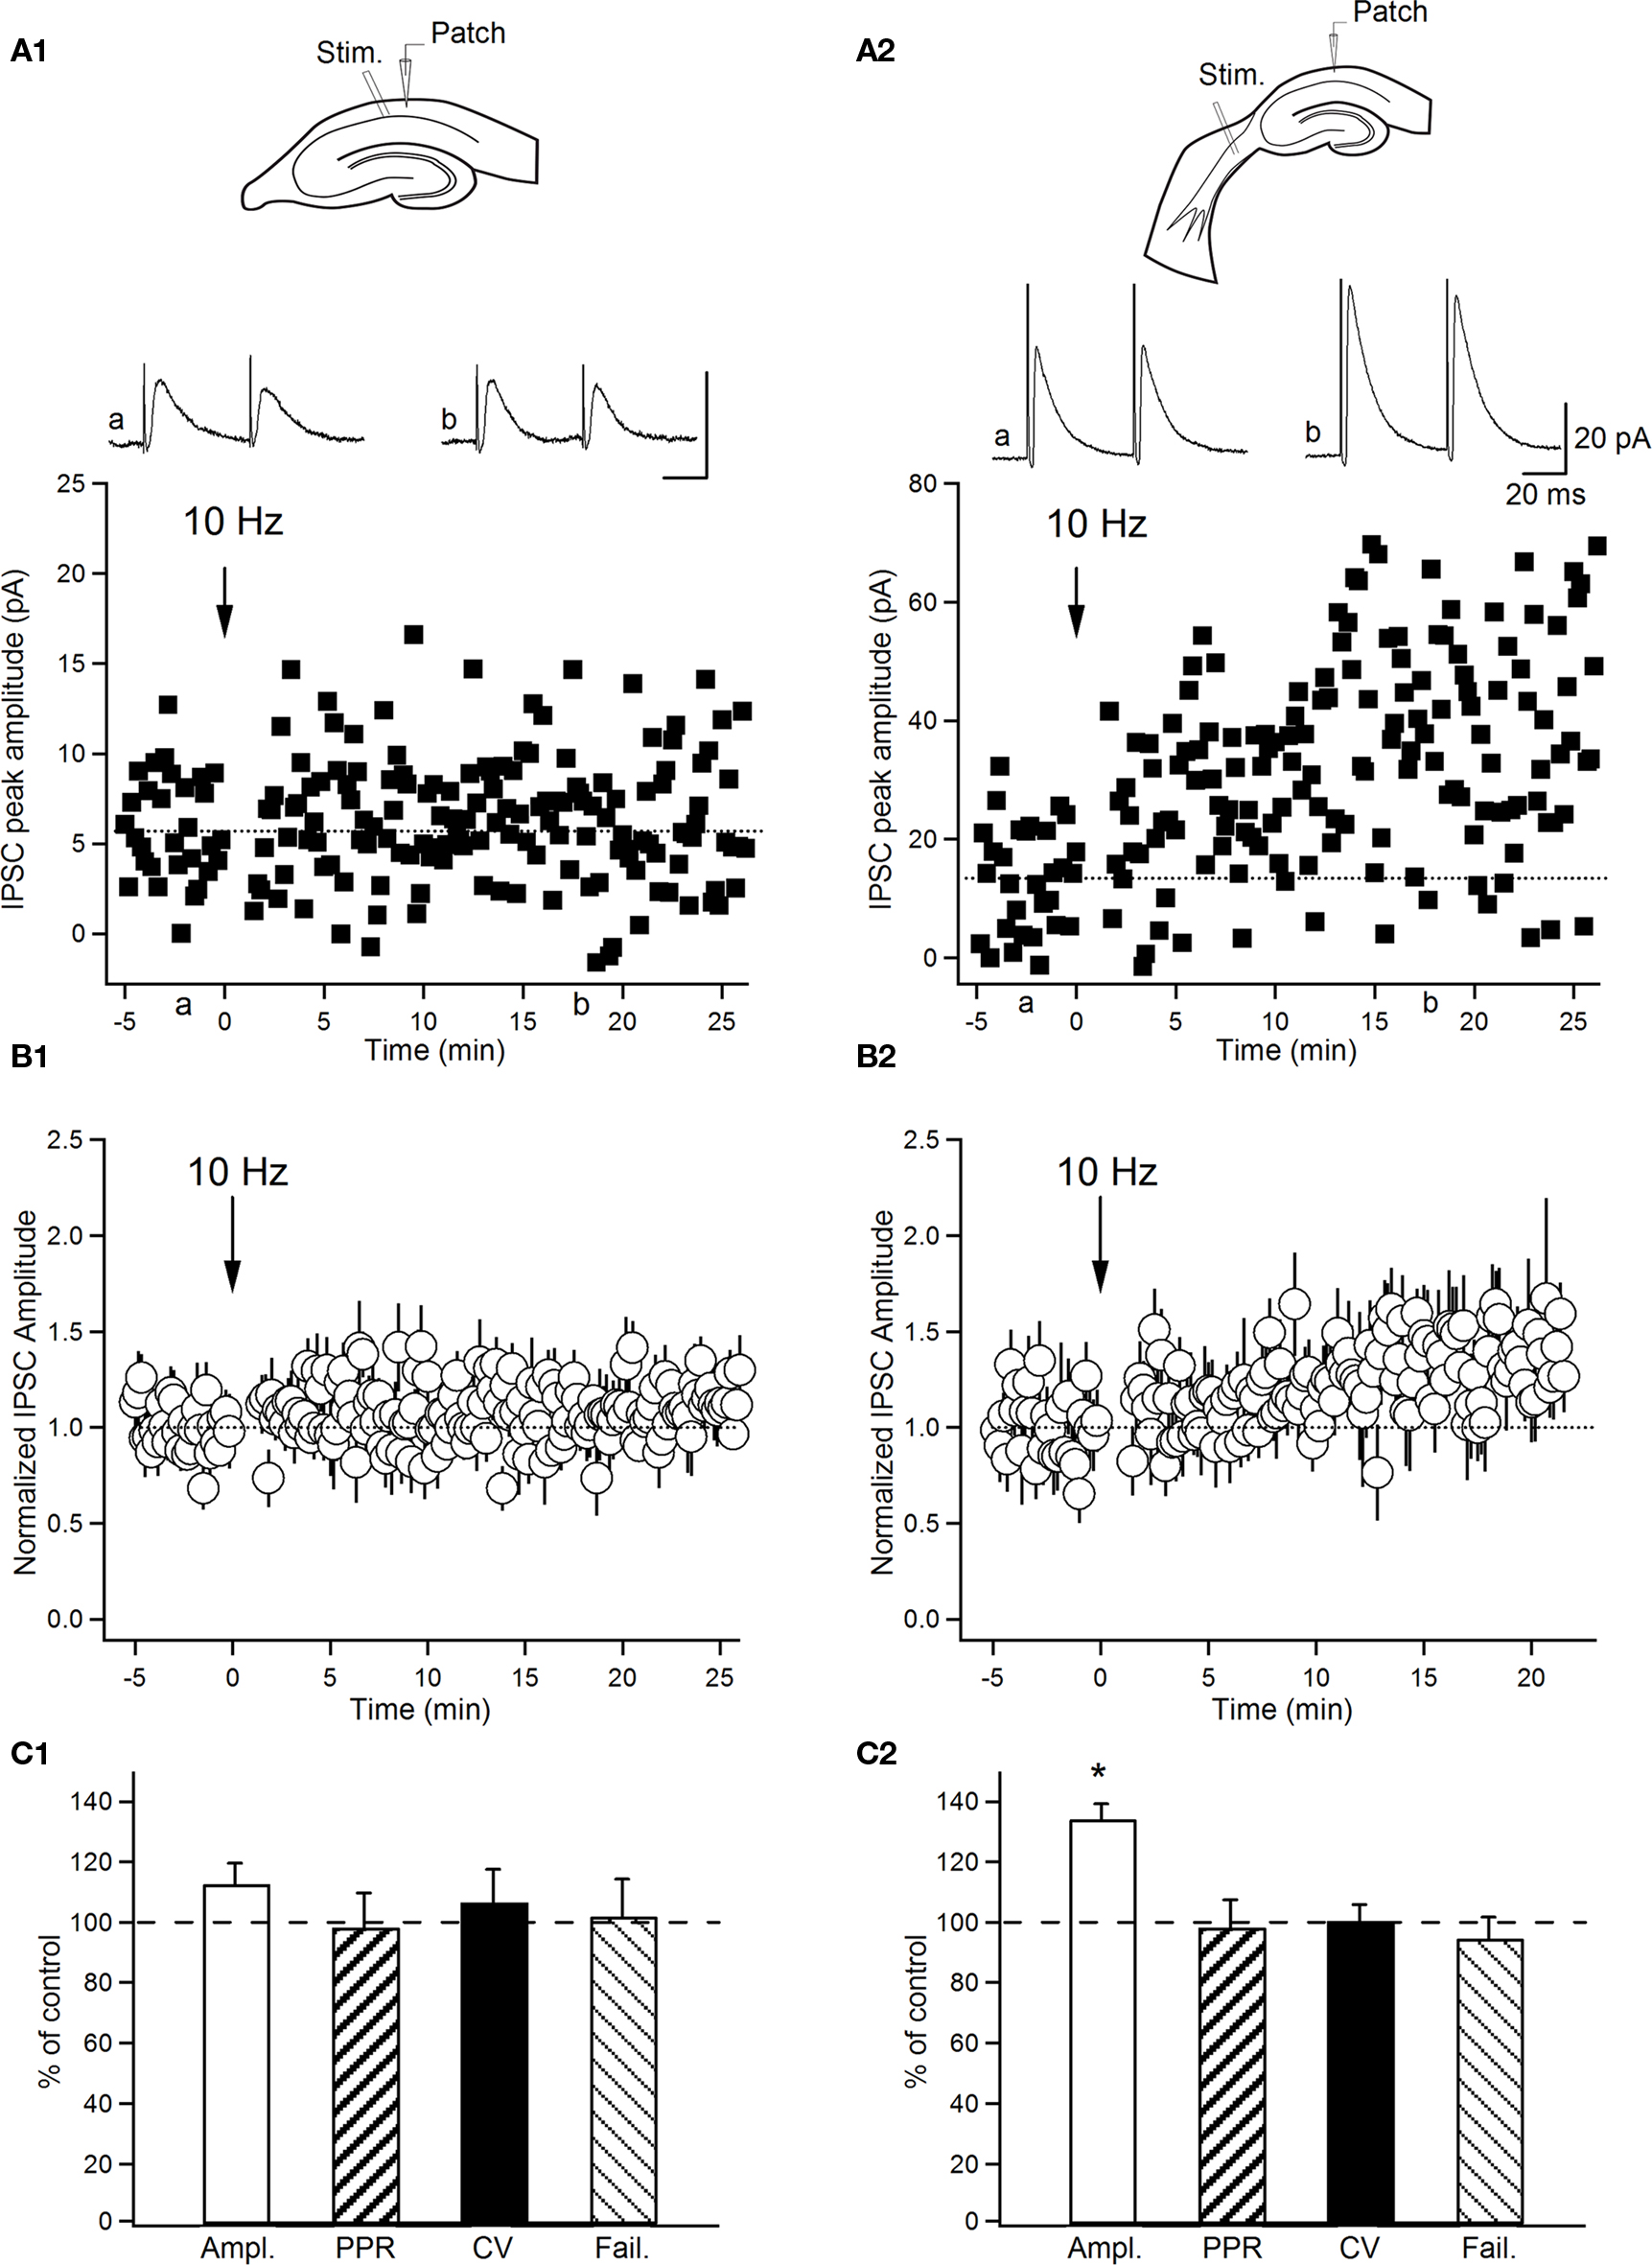
Figure 6. Input-specific expression of long-term plasticity at inhibitory synapses on O–LM INs. (A) Graphs of eIPSC amplitude versus time from representative INs. Average eIPSCs (average of 30 sweeps; failures included) in control (a) and 20 min after 10-Hz stimulation (b) are shown on top. (B) Normalized group data of eIPSC amplitude (normalized to the first 5 min of recordings) as a function of time. (C) Summary bar graphs of group data (C1, n = 5; C2, n = 5) for experiments illustrated in (B) showing changes in the eIPSC peak amplitude, the paired-pulse ratio (PPR), the coefficient of variation (CV) and the failure rate obtained 20 min after 10-Hz stimulation. Data are expressed as percentage of control parameters obtained before 10-Hz stimulation. *P < 0.05. Error bars throughout represent SEM.
First, we compared IPSCs evoked by minimal stimulation (eIPSCs) of the local input with uIPSCs. Our data showed that eIPSCs (recorded at +10 mV in high Ca2+/high Mg2+ ACSF containing DL-AP5, uncaging experimental conditions) were similar to those evoked by uncaging (uIPSC amplitude: 67.1 ± 4.1 pA, eIPSC amplitude: 67.6 ± 13.1 pA; uIPSC rise time: 2.1 ± 0.2 ms, eIPSC rise time: 3.2 ± 0.5 ms; uIPSC decay time constant: 26.0 ± 2.5 ms, eIPSC decay time constant: 28.6 ± 7.4 ms; P > 0.05, unpaired t-test), suggesting that IPSCs elicited by the two stimulation paradigms are likely to arise from the activation of the same inhibitory input. Second, IPSCs evoked by minimal stimulation of local versus SH inputs (at −40 mV in standard ACSF containing DL-AP5 and NBQX) differed significantly in several parameters (Table 2). SH-eIPSCs had significantly faster rise times and larger amplitudes, consistent with a perisomatic location of SH synapses (Table 2; Figures 4C1,C2). Indeed, the plot of the eIPSC rise times versus amplitudes revealed the presence of two populations of events that clustered with a little overlap (Figure 4C3), with local eIPSCs representing a small amplitude, kinetically slow group and SH eIPSCs forming a large amplitude, fast population. Moreover, when pooled together, the data revealed a significant negative correlation between the rise time and the peak amplitude of eIPSCs (r = −0.63, P = 0.0023, Pearson correlation). In addition, SH-eIPSCs had significantly larger PPR and CV (Table 2; Figure 5A), pointing to different properties of transmitter release at SH synapses.
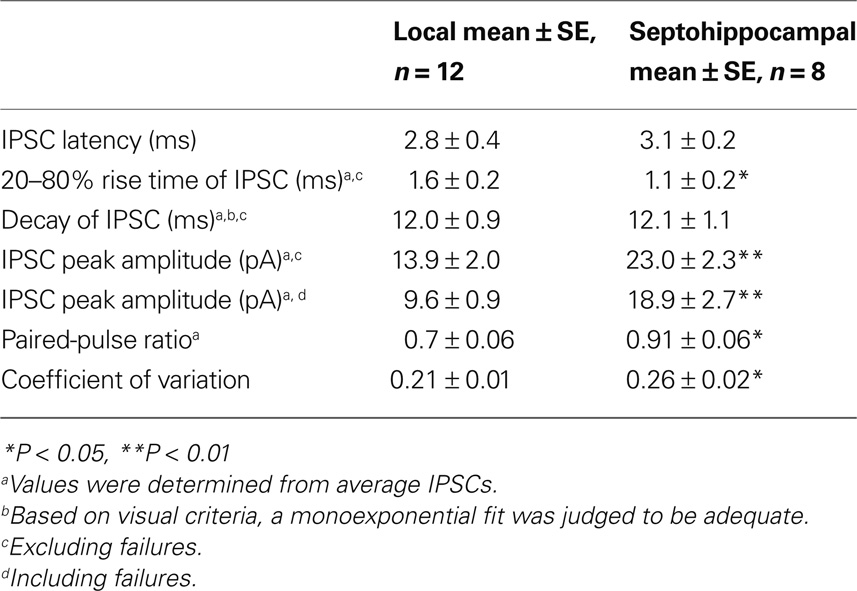
Table 2. Summary of IPSC properties at local and septohippocampal inhibitory inputs to O–LM INs.
Next we examined the dynamics of transmission at two inputs during repetitive presynaptic activity (Figure 5). Although both types of synapses formed onto O–LM INs demonstrated paired-pulse depression (PPD; 50 ms interval), depression of the second response was significantly less at SH synapses (Table 2; Figure 5A). To determine the expression site of PPD, we performed a coefficient-of-variation (CV) analysis (Faber and Korn, 1991). The inverse of the square of the CV for the second response was plotted against its mean amplitude and both values were normalized to the respective values of the first eIPSC. At both synapses, all data points (except one at Figure 5A2) were located below the identity line (Figure 5A), suggesting that PPD was generated primarily by presynaptic factors (Figure 5A) and not by postsynaptic mechanisms [such as GABAA receptor desensitization (Jones and Westbrook, 1995)]. Thus, significantly smaller PPD levels observed at SH synapses suggest a smaller initial release probability at septal terminals compared with local ones. Furthermore, the short-term plasticity of IPSCs evoked by repetitive stimulation (10 Hz), which mimicked the endogenous theta rhythm in the hippocampus, also differed between local and SH synapses (Figures 5B,C). In fact, eIPSCs showed a significant depression with a time constant of 0.16 s at local synapses (Figure 5C1) and no change at SH synapses (Figure 5C2). After five stimuli, the eIPSC amplitude decreased to 69 ± 15% (P < 0.05, n = 6) of the first eIPSC at local synapses (Figure 5B1) and remained unchanged (104 ± 13% of the first eIPSC, P > 0.05, n = 7) at SH synapses (Figure 5B2). The CV of eIPSC amplitude increased during the train at local synapses (first pulse: 0.34 ± 0.15; 20th pulse: 0.59 ± 0.1; P < 0.05, n = 5), indicating a presynaptic expression of short-term depression. Together, these data indicate that the SH input provides stronger and more persistent inhibition compared with the local input.
Synapse-Specific Long-Term Plasticity at Inhibitory Synapses Onto O–LM INs
The smaller amplitude and rapidly depressed IPSCs evoked at synapses formed by the local input suggest a very transient contribution of this input during ongoing hippocampal activity. From the other side, we assumed that repetitive activity at these synapses may induce plastic modifications resulting in selective amplification or even further depression of this input. To test this possibility, we assessed whether any form of long-lasting synaptic plasticity could be evoked at local synapses. For this, O–LM INs were first recorded in the whole-cell voltage clamp mode, and the eIPSC amplitude was analyzed before and after repetitive stimulation at 10 Hz (three times for 2 s with a 30-s interval). Our data showed no change in eIPSC amplitude at local synapses following 10-Hz stimulation (91.2 ± 6.4% of control, n = 6, P > 0.05). Given that the extensive washout of intracellular content during whole-cell recordings could affect the plasticity induction (Lamsa et al., 2005; Kullmann and Lamsa, 2008), next we examined plasticity at local synapses using perforated patch clamp recordings. However, like the data obtained with whole-cell recordings, eIPSC amplitude remained unchanged following 10-Hz stimulation of local input to O–LM INs recorded in the perforated patch mode (112.8 ± 3.7% of control, n = 5, P > 0.05; Figures 6A1,B1,C1). In contrast to local synapses, 10-Hz stimulation significantly increased the amplitude of eIPSCs at SH synapses (134.2 ± 5% of control, n = 5, P < 0.05; Figures 6A2,B2,C2), and this potentiation persisted for at least 30 min. LTP of eIPSCs was not associated with changes in PPR, CV, or failure rate (P > 0.05; Figure 6C2), suggesting a postsynaptic locus for its expression. These data demonstrate the long-lasting potentiation of GABAergic transmission induced by rhythmic stimulation at theta frequency selectively at SH synapses, pointing to the synapse-specific expression of long-term plasticity at inhibitory synapses on INs.
Discussion
Here, we investigated the input- and target-specific properties of transmission and plasticity of inhibitory synapses onto CA1 O–LM INs, an important element of the hippocampal feedback inhibitory circuit. First, using a combination of optophysiological approaches, we identified one of the major sources of local inhibition to O–LM cells, which originated from putative type III ISIs. Second, we compared the dynamics of transmission at the local input to O–LM INs versus the extrinsic one arising from the medial septum. Our major findings are that the two inputs: (a) control different subcellular domains of O–LM INs, with the SH GABAergic projection providing inhibition to the perisomatic zone and the local input controlling O–LM IN dendrites; (b) reveal different profiles of short-term plasticity, with local input showing considerable depression and SH projection demonstrating the ability to sustain activity during repetitive stimulation; and (c) show different capacities for long-term synaptic plasticity, with local input failing to demonstrate plastic modifications and SH input undergoing LTP. We conclude that SH GABAergic projection to O–LM INs provides strong, reliable and dynamically regulated source of inhibition that may represent an important mechanism in the control of the activity of these cells. From the other side, the transient inhibition provided by the local input from putative type III ISIs to O–LM IN dendrites may be well suited for the control of IN dendritic excitability and spike initiation (Martina et al., 2000), as well as synaptic input integration and plasticity (Pouille and Scanziani, 2004; Lamsa et al., 2007).
A large proportion of GABAergic inputs to hippocampal INs are of local origin from other INs that have no target selectivity (e.g., basket cells; Ribak, 1978) or from the three types of ISIs (Acsády et al., 1996a,b; Gulyás et al., 1996). Indeed, INs that primarily target pyramidal cells form a small fraction of synapses (5–15% of total contacts) with other GABAergic neurons of the same or different subtype (Buhl et al., 1995; Sik et al., 1995; Cobb et al., 1997; Bartos et al., 2001; Ali, 2007; Karson et al., 2009). In addition, ISIs preferentially innervate the dendrites of other GABAergic cells, providing a highly selective control over local inhibitory circuits (Acsády et al., 1996a,b). Here, we targeted local inhibitory inputs to O–LM INs using optical mapping approach, a powerful technique that allows to investigate connectivity between different types of neurons (Callaway and Katz, 1993; Dantzker and Callaway, 2000; Shepherd et al., 2003; Brill and Huguenard, 2009; Xu and Callaway, 2009). We found that type III ISIs provide one of the major sources of local inhibition to O–LM INs. Indeed, we did not observe other types of PYR/RAD INs to be connected to O–LM cells. Furthermore, we found that type III ISIs demonstrated an irregularly spiking firing pattern with passive and active membrane properties being similar to those of other types of hippocampal INs.
The SH GABAergic projection forms a major extrinsic inhibitory pathway, which may control the activity of several IN subpopulations via perisomatically located synapses (Freund and Antal, 1988). Consistent with these findings, we observed large-amplitude and fast IPSCs at SH synapses onto O–LM INs. Moreover, in agreement with previous results on the ultrastructural organization of SH GABAergic terminals, we found that SH input was capable to entrain sustained inhibitory episodes, making it ideally suited to suppressing O–LM IN activity. Indeed, anatomical data indicate that septal GABAergic terminals are significantly larger in all ultrastructural aspects (volume of terminal, synapse surface area, volume occupied by vesicles, number of vesicles) than their local counterparts (Eyre et al., 2007). It should be also mentioned that septal terminals contact a single postsynaptic target via multiple release sites (Eyre et al., 2007), implying reliable transmission and large inhibitory events at SH synapses. In contrast to SH synapses, repetitive stimulation at local synapses produced significant paired-pulse and multiple-pulse depression. The depression of transmission was because of presynaptic mechanisms and not because of postsynaptic GABAA-receptor desensitization (Jones and Westbrook, 1995). Indeed, CV analysis showed an increase in CV during PPD as well as during the multiple-pulse train, suggesting that presynaptic mechanisms of short-term depression operate at these synapses. Thus, the two synapses provide different patterns of inhibition due to the synapse-specific structural and functional organization.
Our results further demonstrate the input-specific expression of LTP induced by theta-like activity exclusively at SH synapses onto O–LM INs. Similar to excitatory synapses on INs, such synapse-specific expression of long-term plasticity at inhibitory synapses may require particular molecular mechanisms. For instance, differential implication of GABAB or metabotropic glutamate receptors (Patenaude et al., 2005), Ca2+ mechanisms (Komatsu, 1996; Kang et al., 1998) or the synapse-specific GABAA receptor subunit composition (Hájos and Mody, 1997) together with the subunit- and/or synapse-specific signaling mechanisms (e.g., CaMKII; Houston et al., 2009) may underlie this phenomenon and require further investigation. Interestingly, our data show that inhibitory synapses formed by local input onto O-LM INs exhibit LTP induced by theta-like activity later during the maturation (P30–40; Salesse et al., 2009). Such age-dependent expression of LTP is controlled by synaptic incorporation of the alpha 5 GABAA receptor subunit (Salesse et al., 2009), pointing to the subunit-specific mechanisms of LTP at inhibitory synapses onto O–LM INs. Together, our data point to clear differences in molecular organization between the two synapses and highlight the synapse-specific adaptive regulation of the inhibitory control of hippocampal inhibitory circuits.
The local and SH GABAergic projections originate from two principally different neuronal networks with distinct functional organization. The network features will determine the recruitment and the role of each of these inputs in vivo. Despite extensive investigation of hippocampal inhibition, very little is currently known about the physiological properties and functions of hippocampal ISIs. Based on anatomical data, type III ISIs should be driven by the three major excitatory pathways in the CA1 area: the perforant path, the Schaffer collaterals and CA1 local collaterals. Type I ISIs, which form multiple synaptic contacts with calretinin-positive cells, may be involved in the inhibitory control of type III ISIs. The dynamic properties, the magnitude of excitation, and the amount of inhibition received by these cells will determine the synapse-specific recruitment of type III ISIs during ongoing activity and, accordingly, their role in O–LM IN inhibition. These areas remain to be explored. The SH GABAergic neurons represent a population of parvalbumin-positive cells that have been classified onto two different subtypes: fast-firing and burst-firing neurons (Jones et al., 1999; Morris et al., 1999; Knapp et al., 2000; Sotty et al., 2003; Simon et al., 2006; Manseau et al., 2008). They are excited by local glutamatergic neurons (Manseau et al., 2005) and receive inhibitory inputs from local GABAergic INs (Borhegyi et al., 2004) and from the hippocamposeptal pathway (Manseau et al., 2008). A subset of MS GABAergic neurons express hyperpolarization-activated and cyclic nucleotide-gated non-selective cation (HCN) channels (Varga et al., 2008) and exhibit prominent Ih (Sotty et al., 2003; Manseau et al., 2008; Varga et al., 2008) and rebound spiking driven by the rhythmic inhibition. Remarkably, two distinct populations of medial septum GABAergic cells have been revealed during hippocampal theta oscillations in vivo: one that demonstrates highly regular bursting activity that is tightly coupled to the trough of the pyramidal-layer extracellular theta wave and another that is preferentially active at the peak of the theta oscillation (Dragoi et al., 1999; Borhegyi et al., 2004). Furthermore, it has been suggested that the positive-peak preferring septal INs target dendritic inhibition to CA1 pyramidal cells (e.g., O–LM INs; Borhegyi et al., 2004). On the other hand, the activity of most MS INs is suppressed during hippocampal sharp-wave (SPW) ripples (Dragoi et al., 1999), suggesting that the SH input may exert its powerful influence on O–LM INs during theta oscillations and not during SPW ripple episodes.
How can the activity of O–LM INs be shaped by the activation of the two inhibitory inputs in vivo? O–LM INs demonstrate cell type-specific patterns of activity during network oscillations (Klausberger et al., 2003). Indeed, these cells fire during the trough of pyramidal-layer theta oscillations and are suppressed during the positive peak of the theta oscillation and during SPW ripples (Klausberger et al., 2003), which suggests a differential coordination of their activity via local and SH inhibitory loops. The strongly sustained inhibition provided by the SH input should enable efficient hyperpolarization and decrease in activity of O–LM INs during the positive peak of the theta oscillation. In contrast, during SPW ripples, when the medial septum INs are suppressed, a local inhibitory input from putative type III ISIs may be responsible for silencing the O–LM INs. Indeed, given that in O–LM cells the spike initiation occurs in dendrites (Martina et al., 2000), the local input providing dendritic inhibition should be highly efficient in the control of O–LM IN dendritic excitability and spike generation. Furthermore, as during SPW ripples CA1 pyramidal cells fire intensely (Klausberger et al., 2003), the combination of postsynaptic hyperpolarization provided by the local inhibitory input with activation of excitatory inputs is likely to meet the requirements for the induction of anti-Hebbian LTP at excitatory synapses on O–LM INs (Lamsa et al., 2007). In addition, the transient inhibition provided by the local input should allow the O–LM INs to recover quickly and to respond later during repetitive firing of CA1 pyramidal cells, thus integrating their inputs over time (Pouille and Scanziani, 2004).
Conflict of Interest Statement
The authors declare that the research was conducted in the absence of any commercial or financial relationships that could be construed as a potential conflict of interest.
Acknowledgments
We thank Tatiana Pokidchenko for taking part in some experiments. This work was supported by the Canadian Institutes of Health Research, the Natural Sciences and Engineering Research Council of Canada (NSERC Discovery Grant), and the Savoy Foundation. Lisa Topolnik is the recipient of a University Faculty Award from NSERC. Simon Chamberland was supported by a fellowship from the Fonds de la Recherche en Santé du Québec.
References
Acsády, L., Arabadzisz, D., and Freund, T. (1996a). Correlated morphological and neurochemical features identify different subsets of vasoactive intestinal polypeptide-immunoreactive interneurons in rat hippocampus. Neuroscience 73, 299–315.
Acsády, L., Görcs, T. J., and Freund, T. (1996b). Different populations of vasoactive intestinal polypeptide-immunoreactive interneurons are specialized to control pyramidal cells or interneurons in the hippocampus. Neuroscience 73, 317–334.
Ali, A. B. (2007). Presynaptic inhibition of GABAA receptor-mediated unitary IPSPs by cannabinoid receptors at synapses between CCK-positive interneurons in rat hippocampus. J. Neurophysiol. 98, 861–869.
Bartos, M., Vida, I., Frotscher, M., Geiger, J., and Jonas, P. (2001). Rapid signaling at inhibitory synapses in a dentate gyrus interneuron network. J. Neurosci. 21, 2687–2698.
Bland, B., Oddie, S., and Colom, L. (1999). Mechanisms of neural synchrony in the septohippocampal pathways underlying hippocampal theta generation. J. Neurosci. 19, 3223–3237.
Borhegyi, Z., Varga, V., Szilágyi, N., Fabo, D., and Freund, T. (2004). Phase segregation of medial septal GABAergic neurons during hippocampal theta activity. J. Neurosci. 24, 8470–8479.
Brill, J., and Huguenard, J. R. (2009). Robust short-latency perisomatic inhibition onto neocortical pyramidal cells detected by laser-scanning photostimulation. J. Neurosci. 29, 7413–7423.
Buhl, E. H., Cobb, S. R., Halasy, K., and Somogyi, P. (1995). Properties of unitary IPSPs evoked by anatomically identified basket cells in the rat hippocampus. Eur. J. Neurosci. 7, 1989–2004.
Callaway, E. M., and Katz, L. C. (1993). Photostimulation using caged glutamate reveals functional circuitry in living brain slices. Proc. Natl. Acad. Sci. U.S.A. 90, 7661–7665.
Cobb, S. R., Halasy, K., Vida, I., Nyiri, G., Tamás, G., Buhl, E. H., and Somogyi, P. (1997). Synaptic effects of identified interneurons innervating both interneurons and pyramidal cells in the rat hippocampus. Neuroscience 79, 629–648.
Dantzker, J. L., and Callaway, E. M. (2000). Laminar sources of synaptic input to cortical inhibitory interneurons and pyramidal neurons. Nat. Neurosci. 3, 701–707.
Dragoi, G., Carpi, D., Recce, M., Csicsvari, J., and Buzsaki, G. (1999). Interactions between hippocampus and medial septum during sharp waves and theta oscillation in the behaving rat. J. Neurosci. 19, 6191–6199.
Eyre, M. D., Freund, T., and Gulyás, A. (2007). Quantitative ultrastructural differences between local and medial septal GABAergic axon terminals in the rat hippocampus. Neuroscience 149, 537–548.
Faber, D. S., and Korn, H. (1991). Applicability of the coefficient of variation method for analyzing synaptic plasticity. Biophys. J. 60, 1288–1294.
Fino, E., Araya, R., Peterka, D. S., Salierno, M., Etchenique, R., and Yuste, R. (2009). RuBi-Glutamate: two-photon and visible-light photoactivation of neurons and dendritic spines. Front. Neural Circuits 3:2. doi: 10.3389/neuro.04.002.2009.
Freund, T., and Antal, M. (1988). GABA-containing neurons in the septum control inhibitory interneurons in the hippocampus. Nature 336, 170–173.
Glickfeld, L., and Scanziani, M. (2006). Distinct timing in the activity of cannabinoid-sensitive and cannabinoid-insensitive basket cells. Nat. Neurosci. 9, 807–815.
Gulyás, A., Görcs, T. J., and Freund, T. (1990). Innervation of different peptide-containing neurons in the hippocampus by GABAergic septal afferents. Neuroscience 37, 31–44.
Gulyás, A., Hájos, N., and Freund, T. (1996). Interneurons containing calretinin are specialized to control other interneurons in the rat hippocampus. J. Neurosci. 16, 3397–3411.
Gulyás, A. I., Hájos, N., Katona, I., and Freund, T. F. (2003). Interneurons are the local targets of hippocampal inhibitory cells which project to the medial septum. Eur. J. Neurosci. 17, 1861–1872.
Hájos, N., and Mody, I. (1997). Synaptic communication among hippocampal interneurons: properties of spontaneous IPSCs in morphologically identified cells. J. Neurosci. 17, 8427–8442.
Houston, C. M., He, Q., and Smart, T. (2009). CaMKII phosphorylation of the GABAA receptor: receptor subtype- and synapse-specific modulation. J. Physiol. 87, 2115–2125.
Jinno, S., Klausberger, T., Marton, L. F., Dalezios, Y., Roberts, J. D., Fuentealba, P., Bushong, E. A., Henze, D., Buzsáki, G., and Somogyi, P. (2007). Neuronal diversity in GABAergic long-range projections from the hippocampus. J. Neurosci. 27, 8790–8804.
Jonas, P., Major, J., and Sakmann, B. (1993). Quantal components of unitary EPSCs at the mossy fibre synapse on CA3 pyramidal cells of rat hippocampus. J. Physiol. 472, 615–663.
Jones, G. A., Norris, S. K., and Henderson, Z. (1999). Conduction velocities and membrane properties of different classes of rat septohippocampal neurons recorded in vitro. J. Physiol. 517, 867–877.
Jones, M. V., and Westbrook, G. L. (1995). Desensitized states prolong GABAA channel responses to brief agonist pulses. Neuron 15, 181–191.
Kang, J., Jiang, L., Goldman, S. A., and Nedergaard, M. (1998). Astrocyte-mediated potentiation of inhibitory synaptic transmission. Nat. Neurosci. 1, 683–692.
Karson, M. A., Tang, A. H., Milner, T. A., and Alger, B. E. (2009). Synaptic cross talk between perisomatic-targeting interneuron classes expressing cholecystokinin and parvalbumin in hippocampus. J. Neurosci. 29, 4140–4154.
Klausberger, T., Magill, P., Márton, L. F., Roberts, J. D., Cobden, P. M., Buzsáki, G., and Somogyi, P. (2003). Brain-state- and cell-type-specific firing of hippocampal interneurons in vivo. Nature 421, 844–848.
Knapp, J. A., Morris, N. P., Henderson, Z., and Matthews, R. T. (2000). Electrophysiological characteristics of non-bursting, glutamate decarboxylase messenger RNA-positive neurons of the medial septum/diagonal band nuclei of guinea-pig and rat. Neuroscience 98, 661–668.
Komatsu, Y. (1996). GABAB receptors, monoamine receptors, and postsynaptic inositol trisphosphate-induced Ca2+ release are involved in the induction of long-term potentiation at visual cortical inhibitory synapses. J. Neurosci. 16, 6342–6352.
Kullmann, D. M., and Lamsa, K. P. (2008). Long-term synaptic plasticity in hippocampal interneurons. Nat. Rev. Neurosci. 8, 687–699.
Lamsa, K. P., Heeroma, J. H., and Kullmann, D. M. (2005). Hebbian LTP in feed-forward inhibitory interneurons and the temporal fidelity of input discrimination. Nat. Neurosci. 8:916–924.
Lamsa, K. P., Heeroma, J. H., Somogyi, P., Rusakov, D. A., and Kullmann, D. M. (2007). Anti-Hebbian long-term potentiation in the hippocampal feedback inhibitory circuit. Science 315, 1262–1266.
Manseau, F., Danik, M., and Williams, S. (2005). A functional glutamatergic neurone network in the medial septum and diagonal band area. J. Physiol. 566, 865–884.
Manseau, F., Goutagny, R., Danik, M., and Williams, S. (2008). The hippocamposeptal pathway generates rhythmic firing of GABAergic neurons in the medial septum and diagonal bands: an investigation using a complete septohippocampal preparation in vitro. J. Neurosci. 28:4096–4107.
Martina M, Vida I, Jonas P. (2000). Distal initiation and active propagation of action potentials in interneuron dendrites. Science 287, 295–300.
Morin, F., Beaulieu, C., and Lacaille, J.-C. (1996). Membrane properties and synaptic currents evoked in CA1 interneuron subtypes in rat hippocampal slices. J. Neurophysiol. 76, 1–16.
Morris, N. P., Harris, S. J., and Henderson, Z. (1999). Parvalbumin-immunoreactive, fast-spiking neurons in the medial septum/diagonal band complex of the rat: intracellular recordings in vitro. Neuroscience 92, 589–600.
Oren, I., Nissen, W., Kullmann, D. M., Somogyi, P,, and Lamsa, K. P. (2009). Role of ionotropic glutamate receptors in long-term potentiation in rat hippocampal CA1 oriens-lacunosum moleculare interneurons. J. Neurosci. 29, 939–950.
Patenaude, C., Nurse, S., and Lacaille, J-C. (2001). Sensitivity of synaptic GABA(A) receptors to allosteric modulators in hippocampal oriens-alveus interneurons. Synapse 41, 29–39.
Patenaude, C., Massicotte, G., and Lacaille, J.-C. (2005). Cell-type specific GABA synaptic transmission and activity-dependent plasticity in rat hippocampal stratum radiatum interneurons. Eur. J. Neurosci. 22, 179–188.
Pouille, F., and Scanziani, M. (2004). Routing of spike series by dynamic circuits in the hippocampus. Nature 429, 717–723.
Raastad, M. (1995). Extracellular activation of unitary excitatory synapses between hippocampal CA3 and CA1 pyramidal cells. Eur. J. Neurosci. 7, 1882–1888.
Ribak, C. E. (1978). Aspinous and sparsely-spinous stellate neurons in the visual cortex of rats contain glutamic acid decarboxylase. J. Neurocytol. 7, 461–478.
Salesse, C., Pokidchenko, T., and Topolnik, L. (2009). “The alpha5 GABAA receptor subunit controls the developmental switch in the dynamics of GABAergic transmission onto hippocampal CA1 oriens-lacunosum moleculare interneurons,” Program No. 416.15/B119, 2009 Neuroscience Meeting Planner. Chicago, IL: Society for Neuroscience, 2009. Online.
Shepherd, G. M., Pologruto, T. A., and Svoboda, K. (2003). Circuit analysis of experience-dependent plasticity in the developing rat barrel cortex. Neuron 38, 277–289.
Sik, A., Penttonen, M., Ylinen, A., and Buzsáki, G. (1995). Hippocampal CA1 interneurons: an in vivo intracellular labeling study. J. Neurosci. 15, 6651–6665.
Simon, A. P., Poindessous-Jazat, F., Dutar, P., Epelbaum, J., and Bassant, M. H. (2006). Firing properties of anatomically identified neurons in the medial septum of anesthetized and unanesthetized restrained rats. J. Neurosci. 26, 9038–9046.
Sotty, F., Danik, M., Manseau, F., Laplante, F., Quirion, R., and Williams, S. (2003). Distinct electrophysiological properties of glutamatergic, cholinergic and GABAergic rat septohippocampal neurons: novel implications for hippocampal rhythmicity. J. Physiol. 551, 927–943.
Stevens, C. F., and Wang, Y. (1994). Changes in reliability of synaptic function as a mechanism for plasticity. Nature 371, 704–707.
Takács, V. T., Freund, T. F., and Gulyás, A. I. (2008). Types and synaptic connections of hippocampal inhibitory neurons reciprocally connected with the medial septum. Eur. J. Neurosci. 28, 148–164.
Toth, K., Freund, T., and Miles, R. (1997). Disinhibition of rat hippocampal pyramidal cells by GABAergic afferents from the septum. J. Neurosci. 500, 463–474.
Varga, V., Hangya, B., Kránitz, K., Ludányi, A., Zemankovics, R., Katona, I., Shigemoto, R., Freund, T. F., and Borhegyi, Z. (2008). The presence of pacemaker HCN channels identifies theta rhythmic GABAergic neurons in the medial septum. J. Physiol. 586, 3893–3915.
Keywords: GABAergic circuits, medial septum, interneuron-specific interneuron, synapse, plasticity, mouse
Citation: Chamberland S, Salesse C, Topolnik D and Topolnik L (2010) Synapse-specific inhibitory control of hippocampal feedback inhibitory circuit. Front. Cell. Neurosci. 4:130. doi: 10.3389/fncel.2010.00130
Received: 17 July 2010;
Accepted: 20 September 2010;
Published online: 15 October 2010
Edited by:
Enrico Cherubini, International School for Advanced Studies, ItalyReviewed by:
Gianmaria Maccaferri, Northwestern University, USAEnrico Cherubini, International School for Advanced Studies, Italy
Copyright: © 2010 Chamberland, Salesse, Topolnik and Topolnik. This is an open-access article subject to an exclusive license agreement between the authors and the Frontiers Research Foundation, which permits unrestricted use, distribution, and reproduction in any medium, provided the original authors and source are credited.
*Correspondence: Lisa Topolnik, Axis of Cellular and Molecular Neuroscience, CRULRG, 2601 Ch. De La Canardière, Québec, PQ, Canada G1J 2G3. e-mail: Lisa.Topolnik@crulrg.ulaval.ca