Taste quality and intensity of 100 stimuli as reported by rats: the taste–location association task
- The John B. Pierce Laboratory and the Department of Neurobiology, Yale University School of Medicine, New Haven, CT, USA
The interpretation of neural activity related to sensory stimulation requires an understanding of the subject’s perception of the stimulation. Previous methods used to evaluate the perception of chemosensory stimuli by rodents have distinct limitations. We developed a novel behavioral paradigm, the taste–location association task, to complement these methods. First we tested if rats are able to learn associations between five basic taste stimuli and their spatial locations. This spatial task was based on four prototypical tastants and water. All four rats trained to perform the task reached levels of performance well above chance. Control trials demonstrated that the rats used only taste cues. Further, the learned stimulus set was resistant to interference, allowing for generalization experiments performed subsequently. We tested the rats’ gustatory generalizations of 100 tastants to the five trained stimuli, both regarding their taste qualities as well as intensity ratings. The taste profiles generated by these experiments contribute to the understanding of how perception of the specific taste stimuli relate to the perception of the five basic taste qualities in intact behaving rats. In this large taste space we found that intensity plays a major role. Furthermore, umami stimuli were not reported as being similar to other basic tastants. Our new paradigm enables neurophysiological studies of taste-based learning and memory in awake, freely moving animals.
Introduction
The neural basis of flavor perception has only recently begun to be investigated in humans using functional imaging, and in monkeys using single-unit recording methods. While these methods have advanced understanding of flavor processing, there is a need to complement these approaches with multi-site recording and imaging methods that offer the ability to manipulate neural circuits (e.g., with optogenetic methods) in order to assess their roles in flavor perception. To this end we felt a need to establish a rodent model for taste and flavor research that incorporates novel neural and behavioral methodologies.
Behavioral methods that accurately assess stimulus perception are crucial for the development of valid and sensitive animal models of sensory processes. Two paradigms have been used successfully to query the rat about its suprathreshold taste perception by way of taste similarities. The first involves the generalization of conditioned taste aversions (CTAs). After ingestion of a reference taste (conditioned stimulus, CS), the animal is made sick by intraperitoneal LiCl injection (unconditioned stimulus, US), and the degree of intake suppression of a range of stimuli is tested on subsequent days (Nachman, 1963; Tapper and Halpern, 1968; Ninomiya et al., 1984; Frank, 1985). Smith and colleagues investigated the relationship between brainstem taste neuron responses and CTA-generalizations (Smith et al., 1979). Yamamoto and colleagues investigated the degree of correspondence between various coding schemes applied to responses of chorda tympani fibers and cortical gustatory neurons, and behavioral similarity among taste stimuli (Yamamoto et al., 1985; Yamamoto and Yuyama, 1987).
The second approach, called the “Morrison task” (Morrison, 1967; Ganchrow and Erickson, 2000), consisted of a 2-bar operant generalization task. The perceptual similarity between tastants was related to the similarity of neural response patterns to these tastants (Ganchrow and Erickson, 2000). This task was expanded by Spector and colleagues (Grobe and Spector, 2008). It has the general advantage over CTA-generalization tasks in that it does not require aversive/toxic US–CS conditioning, and far fewer animals are needed to investigate the response similarity among a large number of stimuli. However, the Morrison task is labor intensive and only pair-wise comparisons can be tested on each trial.
We chose to investigate an alternative approach for studying flavor perception based on work by Youngentob and colleagues (Youngentob et al., 1990, 1991), who established a multi-odor identification task using rats. In their method rats identify up to 10 odorants by choosing one of the odor-associated tunnels that contain a response lick cup. Rats learned to perform this confusion matrix task at high levels of accuracy (∼95% correct) and remained accurate (>70% correct) across a 40-fold range of odor concentrations (Youngentob et al., 1990). This behavioral paradigm has been successfully applied to relate rodent odor perception to optically recorded epithelial odor–response patterns (Kent et al., 1995, 2003) and to 2-DG spatial response patterns in the olfactory bulb (Youngentob et al., 2006). The approach has also successfully established the perceptual effects of OMP gene deletion in mice (Youngentob et al., 2001).
Similar to the approach developed by Youngentob et al. (1990, 1991) for odorants, here we describe and test a new paradigm for the study of taste processing. This paradigm is designed to enable the future study of cross-modal flavor generalizations in real-time while performing chronic electrophysiological recordings. In the present study, first we asked if rats can associate a taste quality in the mouth with a specific location outside. This question was never tested before. Then, we tested if rats can learn to simultaneously associate five different taste qualities with five different places. We show that rats can learn to go to and lick one of five water spouts after having received one of five taste stimuli from a manifold at the center of a circular arena. Cue-control trials showed that the behavior was taste-guided. To our knowledge this is the first demonstration of (non-devaluative) taste–location associative learning in rodents. Further, we report the rats’ gustatory generalizations of ∼100 tastants to the five trained stimuli, regarding their taste qualities as well as intensity ratings. The taste profiles generated by these experiments contribute to the understanding of how perception of the specific taste stimuli relate to the perception of five basic taste qualities in intact behaving rats and establish the most complete taste space of a non-human animal to date.
Materials and Methods
Animals
Four female Long–Evans rats initially weighing ∼200 g were used. Rats were on a 22 h water deprivation schedule for the entire experiment. To maximize the rats’ cognitive abilities they were group-housed in an enriched environment. The cage consisted of a “Ferret Nation” cage (model 141, Midwest, Muncie, IN, USA). The dimensions were 36′′L × 25′′W × 38 1/2′′H, and the cage had two levels connected via stairs. The cage was painted with Rustoleum for rust prevention and improved for daily transport with larger coasters. A custom plastic base contained bedding and a running wheel (“Safety Wodent Wheel – Senior”) enhanced with a more stable base. It also contained several pieces of 4′′ PVC pipe connectors as well as wood chewing blocks (“Block Bites”). The environment was further enriched with paper napkins placed on top of the cage. Rats were identified by tattooed numbers on their tail and outer ears. Twenty months later they were individually housed because of the appearance of pododermatitis in two rats (see Results). All procedures were approved by the John B. Pierce Animal Care and Use Committee.
Testing Arena
The testing arena consists of a round box of 23′′ diameter, with a transparent polycarbonate side of 210 mm height (Figure A1 in Appendix). A metal grid floor was located 50 mm above the base of the box. At five evenly spaced locations along the perimeter wall were lick spouts, connected to a lickometer (Med Associates, St. Albans, VT, USA) and water-tube from a gustometer. Spouts were numbered 1–5 in clockwise fashion, with spout 1 on the right of the manifold. These spouts were located 60 mm above the grid floor. A taste manifold was lowered into the center of the arena from the center of the metal grid ceiling. (The taste manifold was inverted above the metal grid floor from day 157 onward, as discussed later). This manifold used an optical lickometer (Schoenbaum et al., 2001). The test arena, used throughout the experiment, was filled with fresh bedding weekly and the grid was wiped clean after each rat and cleaned and dried daily. The testing arena, gustometer valves, and PC monitor were placed on top of a steel table.
Gustometer
The gustometer and procedure was fully automated using Labview. The gustometer consisted of a set of taste bottles, pressurized by nitrogen and connected via 2-way valves to a taste manifold and the five surrounding water reward spouts.
Tastants used as training stimuli consisted of deionized water, 0.3 M NaCl, 5 mM quinine HCl, 30 mM HCl, and 0.5 M sucrose, dissolved in deionized water (Table 1). They were stored in media-bottles using Omnifit (Danburry, CT, USA) Omni-lok caps and connectors. The inlets connected to 2.5 PSI source of nitrogen [Airgas (Salem, NH, USA), BIP, 99.999%]. The outlets were connected to gustometer two-way valves via nylon connectors. All tubing was made of Teflon (PTFE, 1/8′′ OD, 1/16′′ ID). All chemicals were reagent grade and obtained from Sigma-Aldrich (St. Louis, MO, USA). All stimuli were at room temperature (22°C).
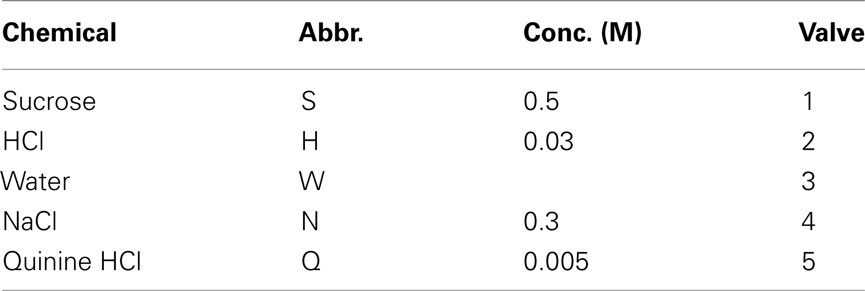
Table 1. Learned set of taste stimuli.
All valves [2-way Neptune Research (West Caldwell, NJ, USA), Teflon body] were individually calibrated by adjusting their energizing time in order to provide 20 ± 0.5 μl of fluid upon licking. They were energized by drive-current minimizing (and hence heat-minimizing) valve driver boards (Neptune Research). After a 1 s delay liquid was removed from the taste manifold by vacuum applied at 5l/min for 2 s and rinsed for 1 s with deionized water 300 ms after the vacuum onset (to prevent cross-contamination). The next lick on the next trial refilled the manifold’s dead-space. The surrounding reward spouts presented 40 ± 5 μl of deionized water once upon correct licks were made. To reduce the occurrence of orthonasal olfaction the lick spout was surrounded by a stainless steel conical ring. The ∼2-mm concentric space between the ring and spout is continuously vacuumed at 5 l/min. Before the start of daily testing all tubing was flushed to remove air and spouts were cleaned and dried.
Behavioral Procedure
Rats were gradually trained to lick a stimulus from taste manifold at the center of the testing arena and then lick from one of five water spouts surrounding the manifold.
A trial started with a 250ms beep of 5 kHz every 1 s. When the rat licked from the central taste manifold the beeping stopped and a tastant was presented. If the rat did not subsequently lick any of the surrounding reward spouts within 15 s the trial timed out and a new trial started. If the rat licked the correct reward spout water was presented and a new trial started after a 0.5-s delay. If the rat licked a wrong reward spout no water was presented, a tone of 2 kHz played for 250 ms and a new trial was started after a 10-s additional delay as mild punishment. Irrespective of whether the animal would lick the stimulus or not each stimulus presentation was followed by vacuuming and rinsing of the stimulus manifold to clean out the stimulus, thereby removing any chance of cross-contamination. All relevant trial parameters as well as the rats’ responses were automatically stored on the PC in a text file for subsequent analysis in Microsoft Excel 2007.
Behavioral Training
Room lights were always turned off during the daily sessions. A door to a bright room was however always left open. During 3-day familiarization, each rat was placed in test chamber for 30 min and allowed to lick water from the central taste manifold. Next, the rat was guided to alternate between the central manifold and surrounding reward water spout 1 (Tables 2 and 3). An LED was lit underneath spout 1 after licking water from the central manifold. A new trial started after licking spout 1 or after timing out (15 s). No other spout was responsive.
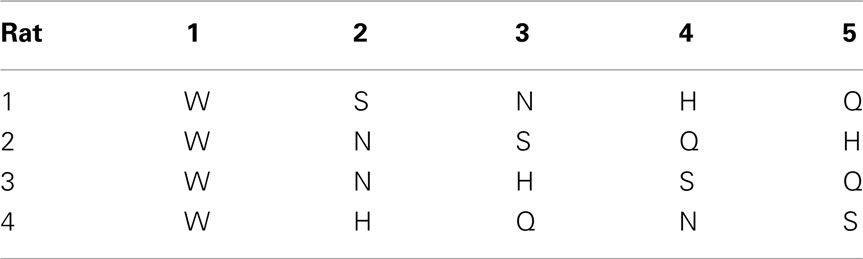
Table 2. Order of introducing tastants for each rat.
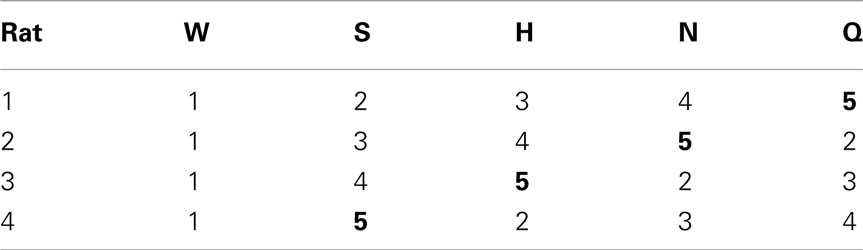
Table 3. Taste-to-spout mapping for each rat.
After several days, rats alternated between the taste manifold and the water spout at least 60% of the trials (Figure A2 in Appendix). The second stimulus was then introduced, the taste quality of which varied across the four rats (Table 2). The stimulus presentation likelihood was evenly distributed across all stimuli until day 78. At this point we did not introduce quinine as it would be presented in about 50% of the trials, and this raised concerns regarding its aversive properties. Across rats, we introduced quinine as third taste (rat 4), fourth taste (rat 2), or fifth taste (rat 1 and rat 3; Table 2). Where rats had to go to obtain water reward after having licked the secondly introduced tastant was also varied across rats (Table 3). For example, rat 1 had to go to spout 2 after sucrose, and rat 2 to spout 3 after NaCl, both having to go to spout 1 after water. As before, an LED lit up to guide the rat toward the correct spout. We accordingly introduced all five tastants to the four rats, each rat having their own unique taste–location mapping.
We gradually removed the LED cues that guided the rats to go toward the correct spout. Table 4 describes how the LED guidance associated with the first stimulus (water) was discontinued when the performance for the third stimulus (second tastant, T2) was at least 60% (square symbols in Figure A2 in Appendix). Once all LED guidance was discontinued we continued training for a total of 200 training sessions. The Video in Supplementary Material shows 15 consecutive trials of rat 1 on test day 215.
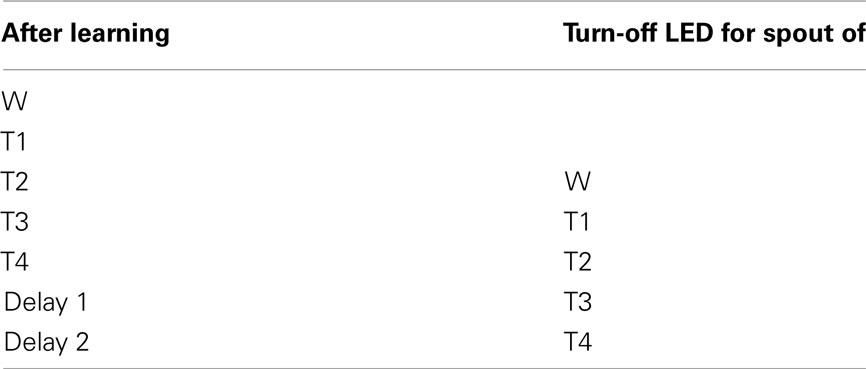
Table 4. LED guidance turn-off schedule.
Behavioral Testing
Rats were always tested in the same order (rat 1–4). It was taken out of the home cage, weighed, and placed on the grid of the testing arena, after the Labview software was started. After a testing session of 45 min the rat was taken out of the arena and was placed into a regular cage with a bottle of water available for ad lib drinking. Then the next rat’s session was started. At the end of this next rat’s session we moved the previous rat into the group cage. This was continued until all four rats had gone through all these stages.
During a session tastants were presented in randomized (non-blocked) order. We did not limit the number of times the same stimulus could consecutively be presented. Starting test day 78 we employed an “error feedback” based on the performance errors of the preceding day to increase the frequency of the stimuli that were mostly poorly identified. For each rat on any session the % chance to be presented with stimulus A was calculated as follows (PCa is percent correct for stimulus A during the previous session for an individual rat):
As rats performed several hundred trials per session the actually presented stimulus fractions approached these calculated target fractions. Equation 1 was adjusted when other stimuli were tested, to sum to either 70% or 90% (see below). None of the rats were tested/trained during the following four breaks (4/13/10-4/26/10, 5/26/10-6/8/10, 6/21/10-7/15/10, and 9/2/2010-10/14/2010).
Cue Controls
To verify that the spout choices were mediated by the taste of the stimuli and not other cues (e.g., the sound of a valve of the gustometer), we presented the same stimuli also on new lines of the gustometer on two occasions: day 109–111 and day 185–189 (Figure A2, bottom and Figure 2). During the first instance, we presented HCl, NaCl, and water at 10% incidence each on each day (30% of total presentations). Initially we opted not to choose sucrose, as it was distinctly more viscous and required longer valve-open times (other valve times were identical). Correct performance on sucrose control trials would hence not have allowed us to conclude that the choices were taste-guided.
On the second control set we presented only one cue-control stimulus daily on a new gustometer line on days 180–185 for H, N, W, Q, and S, respectively, at 10% of the total stimulus presentations. During a third set of tests (day 194–197) we presented generalization stimuli, being the training stimuli (Table 1), but at 10% of the original concentrations on 10% of trials each day: 0.03 M NaCl on day 194, 0.5 mM quinine HCl on day 195, 3 mM HCl on day 196 and 0.05 M sucrose on day 197 (Figure 1B).
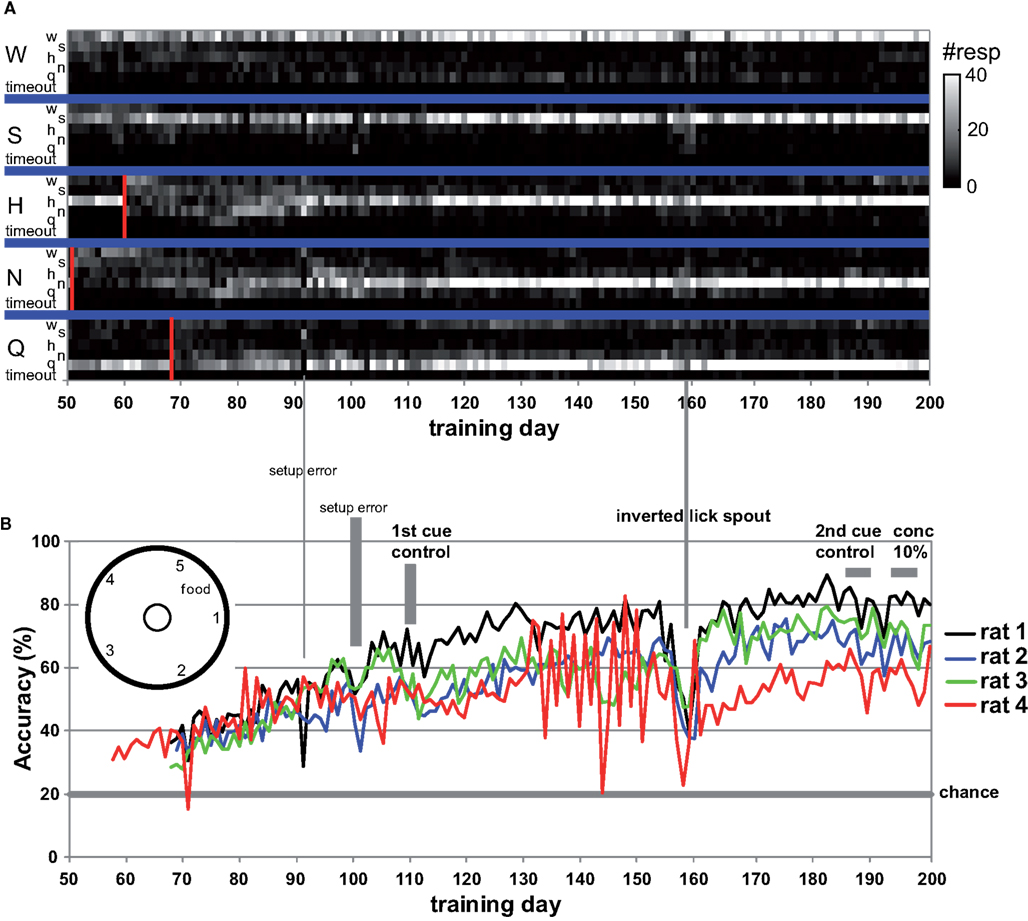
Figure 1. (A) The number of times rat 1 chose a spout (small letters) or timed out per day for each taste presented at the central manifold (capitalized). All LEDs were turned off from day 69 onward, each marked by a red bar. (B) Average taste-guided performance of each rat. Cue-control generalization to training stimuli is indicated. Lick spout was mounted on bottom at indicated day for more natural lick behavior. Chance performance is 20%. Two setup errors are highlighted with a vertical bar, one affecting only rat 1.
On all control presentations reward was available irrespective of which spout they licked. This was chosen so that, in a subsequent study, we could evaluate to what extent the performance would be disturbed by moderately changing the reward contingencies, which would be necessary in case of generalization studies using similar stimuli. For example, to test generalization to a different concentration of the training tastants, any response would have to be rewarded in order not to bias subsequent generalizations.
Improvements Made during Training
We inverted the lick manifold on test day 157 (Figure 1, bottom), so it was mounted on the base plate penetrating through a hole in the bottom grid. The open top has the further advantage of allowing future tethered electrophysiological recordings. We also drilled a micro-well in the tip of the manifold’s spout in order to hold about 40 μl of fluid. This allowed for a more natural licking position and much reduced usage of paws to collect fluid.
General Analysis
The data were analyzed daily to determine the next day’s stimulus presentation ratios and for daily feedback in case errors occurred, to measure progress, and to evaluate the effect of intended changes. Cluster analysis, multidimensional scaling (MDS), and factor analyses were performed in Systat 10.2 and was based on the Pearson correlations between the average response correlations across test stimuli (i.e., similarity between the patterns as reported in Figures 3–7). For MDS we used the Kruskal (mono) loss function with r2 metric. MANOVA was performed in SPSS (v 19). Results are presented as mean ± SEM except where noted otherwise, and the alpha-level was set at 0.05.
Results
Training
Rats readily learned to alternate between the central taste manifold and the surrounding lick spouts within a few days. Figure A2 in Appendix shows the accuracy (Percent Correct) of rat 1 and 2. Within three weeks they did so for 3 of the five stimuli, while guided by the LEDs (see Methods). Typically, discontinuing the use of a spout-associated LED (Table 4) led to a temporary performance reduction for the associated stimulus, which was initially more severe as more stimuli were introduced.
LED guidance to the reward spouts was completely discontinued at test day 68, 69, 68, and 58 for rat 1–4, respectively. From that point onward rats relied solely on the stimulus taste, in that no other cues were present, with exception of the higher viscosity and longer valve-open time for sucrose (see Methods). The effect of LED use termination is shown for rat 1 in Figure 1A: for several tens of sessions after LED guidance termination of the HCl test stimulus (day 60) and quinine (day 68) the response profile becomes fuzzy, extending to incorrect reward spouts. In all cases, the profiles recover to become crisp and accurate.
Given the five response options, 20% accuracy is considered chance level. All four rats were responding above chance level (average 35%, range 28–42%) when LED guidance was discontinued around day 70 (Figure 1B), and performance steadily increased at 0.5% per day to an average accuracy of 64% at day 130 (range 59–75%). A setup error, during which we erroneously rinsed the manifold with HCl (day 100–102), and the first cue-control generalization test temporarily reduced performance.
Asymptotic Performance
After test day 130 performance reached a plateau. However, rat 4 was unable to acquire the correct association between NaCl and spout 3. This animal failed to perform above 50% accuracy after the LED guidance was discontinued (between day 58 and 80). Unlike the other three rats, for whom we never again used any of the LEDs, LED guidance was introduced again for rat 4 for the NaCl stimulus on test day 81, 83, 85, 88, and 91, as well as for various stimuli between day 122 and 154 (explaining the large day-to-day variability in Figure 1, bottom). Only from day 167 onward did rat 4 perform above 50% (Figure 1B).
We observed that rats occasionally used their paws to collect the stimulus. This could lead to stimulus contamination and thereby limit performance. On day 157 we inverted the taste manifold, mounting it on the base plate of the arena instead of hanging down from the lid. Performance temporarily dropped, but fully recovered ∼20 days later. Paw use was nearly completely halted. It did not appear to ultimately enhance accuracy, being at 72% at day 200 (range 67–80%). For comparison to the results of Youngentob et al. (1990) we include Table 5, displaying the mean, SD, and range for each rat over training days 181–200. Across all rats performance accuracy (PC) was 70 ± 10%. Actual behavior of rat 1 during 15 trials using this setup on test day 215 is shown in the Video S1 in Supplementary Material.
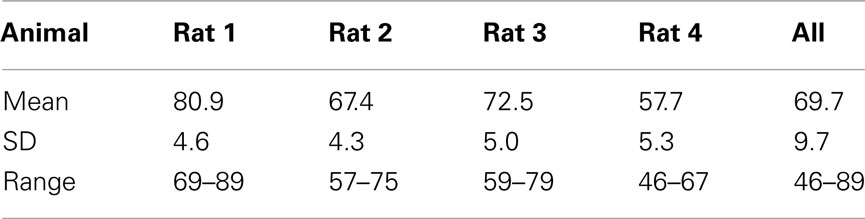
Table 5. Performance on days 181–200 (compare to Youngentob et al., 1990, Table 2).
Cue Controls and Generalization
As described in the Methods section, we applied taste–cue-controls on two occasions: days 109–111 (W, H, and N, 10% each, 30% of total trials per day) and 185–189 (one daily, H, N, W, Q, and S, respectively, at 10% total). For the first set of controls on day 109, there was no difference in accuracy between the original stimulus (55.7 ± 18%) and the control stimulus presented in new bottles and gustometer lines (54.4 ± 16.2%; P = 0.350, n = 12, 1-sided paired t-test). Hence, it was clear that the rats used taste cues but not sound cues to determine their choice of reward spout for these three stimuli. Furthermore, rats performed well above chance level (P < 10−4; 1-sided paired t-test vs. 20%). These data also showed evidence of interference, in that accuracy dropped from 58.3 ± 2.2% at day 108 to 50.0 ± 5.2% on day 112 (Figure 1B), suggesting that employing 30% of presentations as (always rewarded) generalization stimuli is too large a fraction to maintain performance.
The results of the second control set of all five stimuli are shown in Figure 2. The top graph shows the mean percentage of the trials, averaged across the four rats, that the rats chose a spout mapped to a training stimulus during the session it was presented. For example, upon presenting the cue-control water stimulus, rats chose the reward spout mapped to water 67.5 ± 12.3% of the total number of water control trials (mean ± SEM), and chose the spout mapped to sucrose only 3.2 ± 2.3% of the time (Figure 2A). All responses were well above chance level (67.5, 77.8, 76.5, 56.8, and 47.6% correct, respectively for W, S, H, N, Q, means across four rats; P < 10−12, paired two sample t-test for means, vs. 20%, n = 20). This would not have been the case if rats were depending on non-gustatory cues. As shown in Figure 1 (B, “2nd cue control”) these control tests had a mild downward effect on accuracy but this was rapidly reversed.
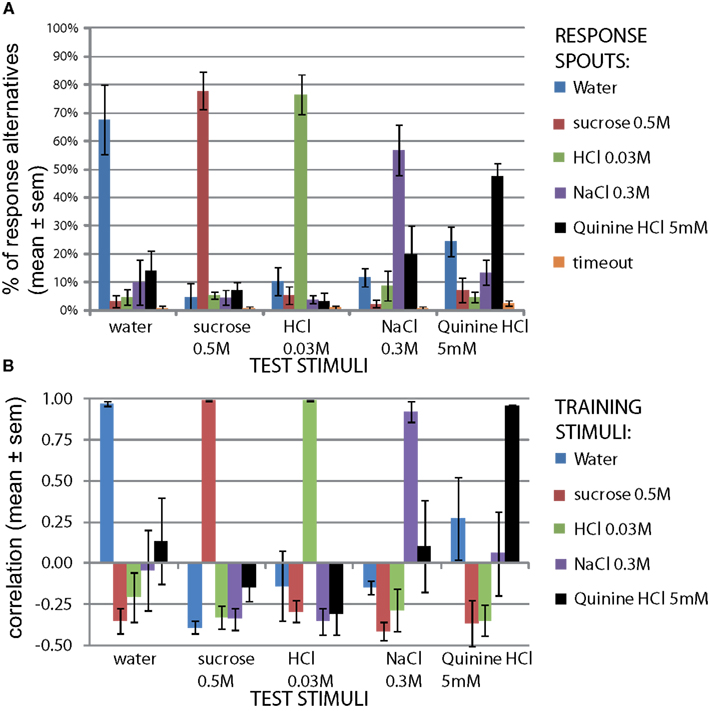
Figure 2. Reward spout choices are taste-guided. To verify rats used taste cues to guide their lickspout responses, the same stimuli as the train stimuli were presented on three new valves. One such stimulus was presented per day (10% of all trials). (A) Distribution of responses to each stimulus (mean ± SEM, n = 4 rats). (B) Correlation of response pattern for each stimulus with response pattern of original train stimuli on the same day (mean ± SEM, n = 4 rats). The calculation of the correlation is clarified in Figure A3 in Appendix.
We next asked how similar these response profiles are to the actual training set, to provide a quantitative similarity measure of these cue-control responses in particular, and as a generally useful method to study generalization. For this similarity measure we calculated the Pearson correlation coefficient between each response profile for a cue-control/test stimulus and the response profile to each trained stimulus (Figure 2B). This method is explained in Figure A3 in Appendix. As expected, the control stimulus response profiles and trained stimulus response profiles were very similar to each other. The mean correlations for water, sucrose, HCl, NaCl, and quinine were all above 90%. As there is some mutual confusion between water and quinine (r = 0.13 ± 0.26 and r = 0.27 ± 0.25, of water to quinine-mapped spout and of quinine stimulus to water-mapped spout, respectively), the quinine stimulus may have been of low intensity. These correlations form a reference for the generalization experiments mentioned below. We expect that accuracy can be no higher than that of the cue controls.
Concentration Generalization
Stimulus intensity is a fundamental sensory dimension. We evaluated the rats’ generalization to the basic training stimuli from 0.5 log unit above training concentration down to 10.5 log units below, in 0.5 log unit steps (Figure 3A). Sucrose was evaluated only at lower concentrations than the reference training concentration, where the profile at 0.5 log unit below reference (0.167 M) remained similar to the reference. At 16.7 mM the rats’ sucrose report dropped rapidly as water report increased to r = 0.81. MANOVA showed a highly significant effect of sucrose concentration only on sucrose report (F3,15 = 46.7, P < 0.001) and on water report (F3,15 = 26.5, P < 0.001). This profile was quite similar to the other three stimuli, showing stable responses 0.5 log units around the reference concentration (r > 0.9, except 1 M NaCl and 1.67 mM quinine). Below 0.5 log units the report to the presented stimulus dropped to r = −0.1–0.51 (1 log unit) and r = −0.49–0.29 at the lowest concentration, while that of water increased to r = 0.70–0.81. At these lower concentrations only HCl was selected (r = 0.08–0.26), suggesting these taste stimuli were perceived mainly as fairly pure tastes of varying intensity with only a mild sournote. Concentration had a significant effect on the reported equivalent lickspout for all basic stimuli (see Figure 3A; HCl: F4,19 = 27.8, P < 0.001; NaCl: F4,19 = 8.2, P < 0.001; quinine: F4,19 = 5.2, P < 0.01; MANOVA). We further established that MANOVA across all these 19 stimuli showed a significant effect of concentration (normalized to training concentration), molecular identity, and their interaction on the entire response set (F20, 224 = 4.6, P < 0.001, F15,165 = 19.9, P < 0.001, and F55,285 = 2.8, P < 0.001, respectively). Thus, our paradigm yields robust datasets with as few as four animals.
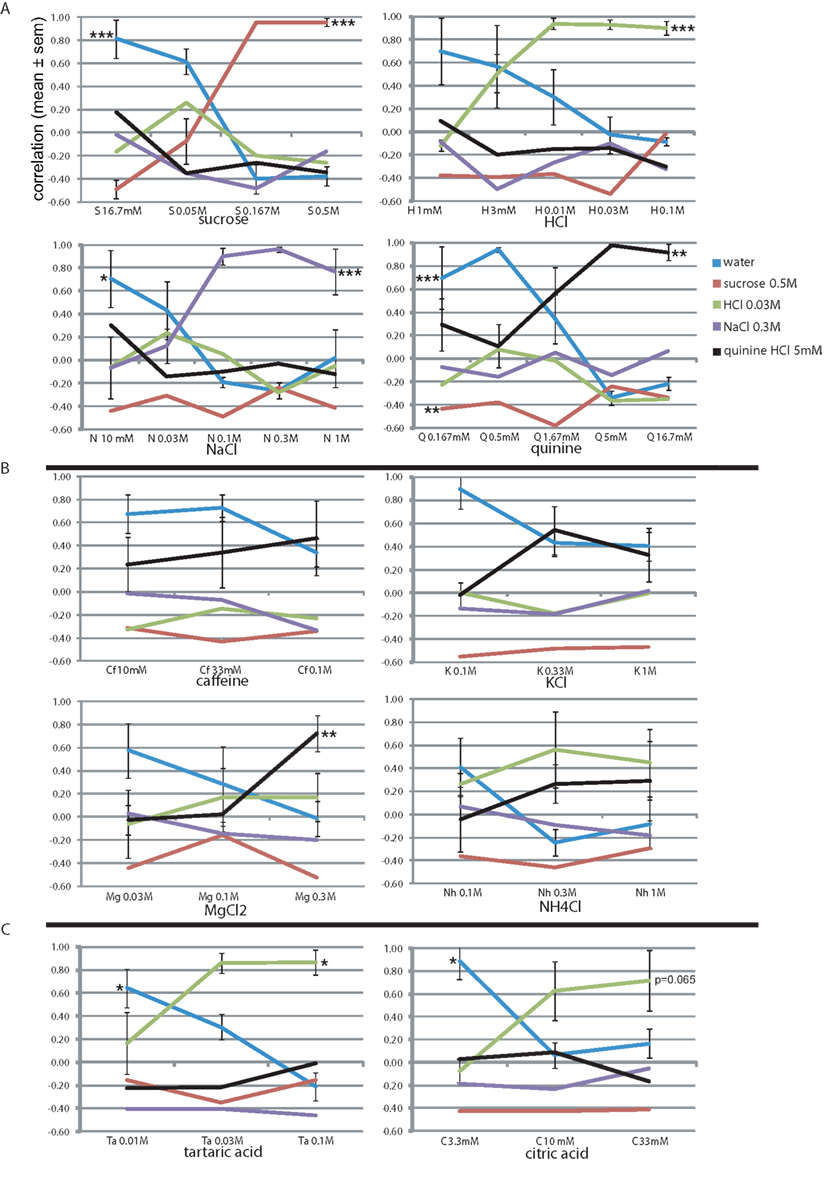
Figure 3. Concentration–response generalization curves. The correlation-based similarity between the response profile to each stimulus (see Table 6 for abbreviations) at each concentration and each of the stimuli (Table 1). See text for details. *P < 0.05, ** P < 0.01, *** P < 0.001 (MANOVA on concentration). (A) The four trained stimuli. Concentrations of the learned set are boldfaced. (B) Bitter tastants. (C) Sour tastants.
Bitter Tastants
We further evaluated the rats’ generalization to four stimuli, loosely termed “bitter tastants” (Table 6). Figure 3B shows that caffeine, often used as prototypical bitter stimulus in rat experiments, only evoked a mild bitterness response profile at 10, 33, and 100 mM (r < 0.46), showed no positive relationship to any other tastant, and a relatively high correlation to water (r = 0.34–0.67). This may be considered a weak, but pure bitter (i.e., quinine-like) taste to these rats. A very similar concentration profile was evident for KCl (Figure 3B). Magnesium chloride was highly similar to quinine at 0.3 M (r = 0.72) with minor HCl-like taste (r = 0.17), dropping to nearly pure water response at 30 mM. Ammonium chloride (Nh) was reported as moderately sour (r = 0.45–0.56) and mildly bitter (r = 0.27–0.29) at 0.3 and 1 M and as a weaker mixture thereof at 100 mM. We found no evidence of pure and intense quinine-like stimuli among these tastants. Concentration had a significant effect on the reported quinine-likeness for MgCl2 (F2,11 = 8.3, P < 0.01; see Figure 3B).
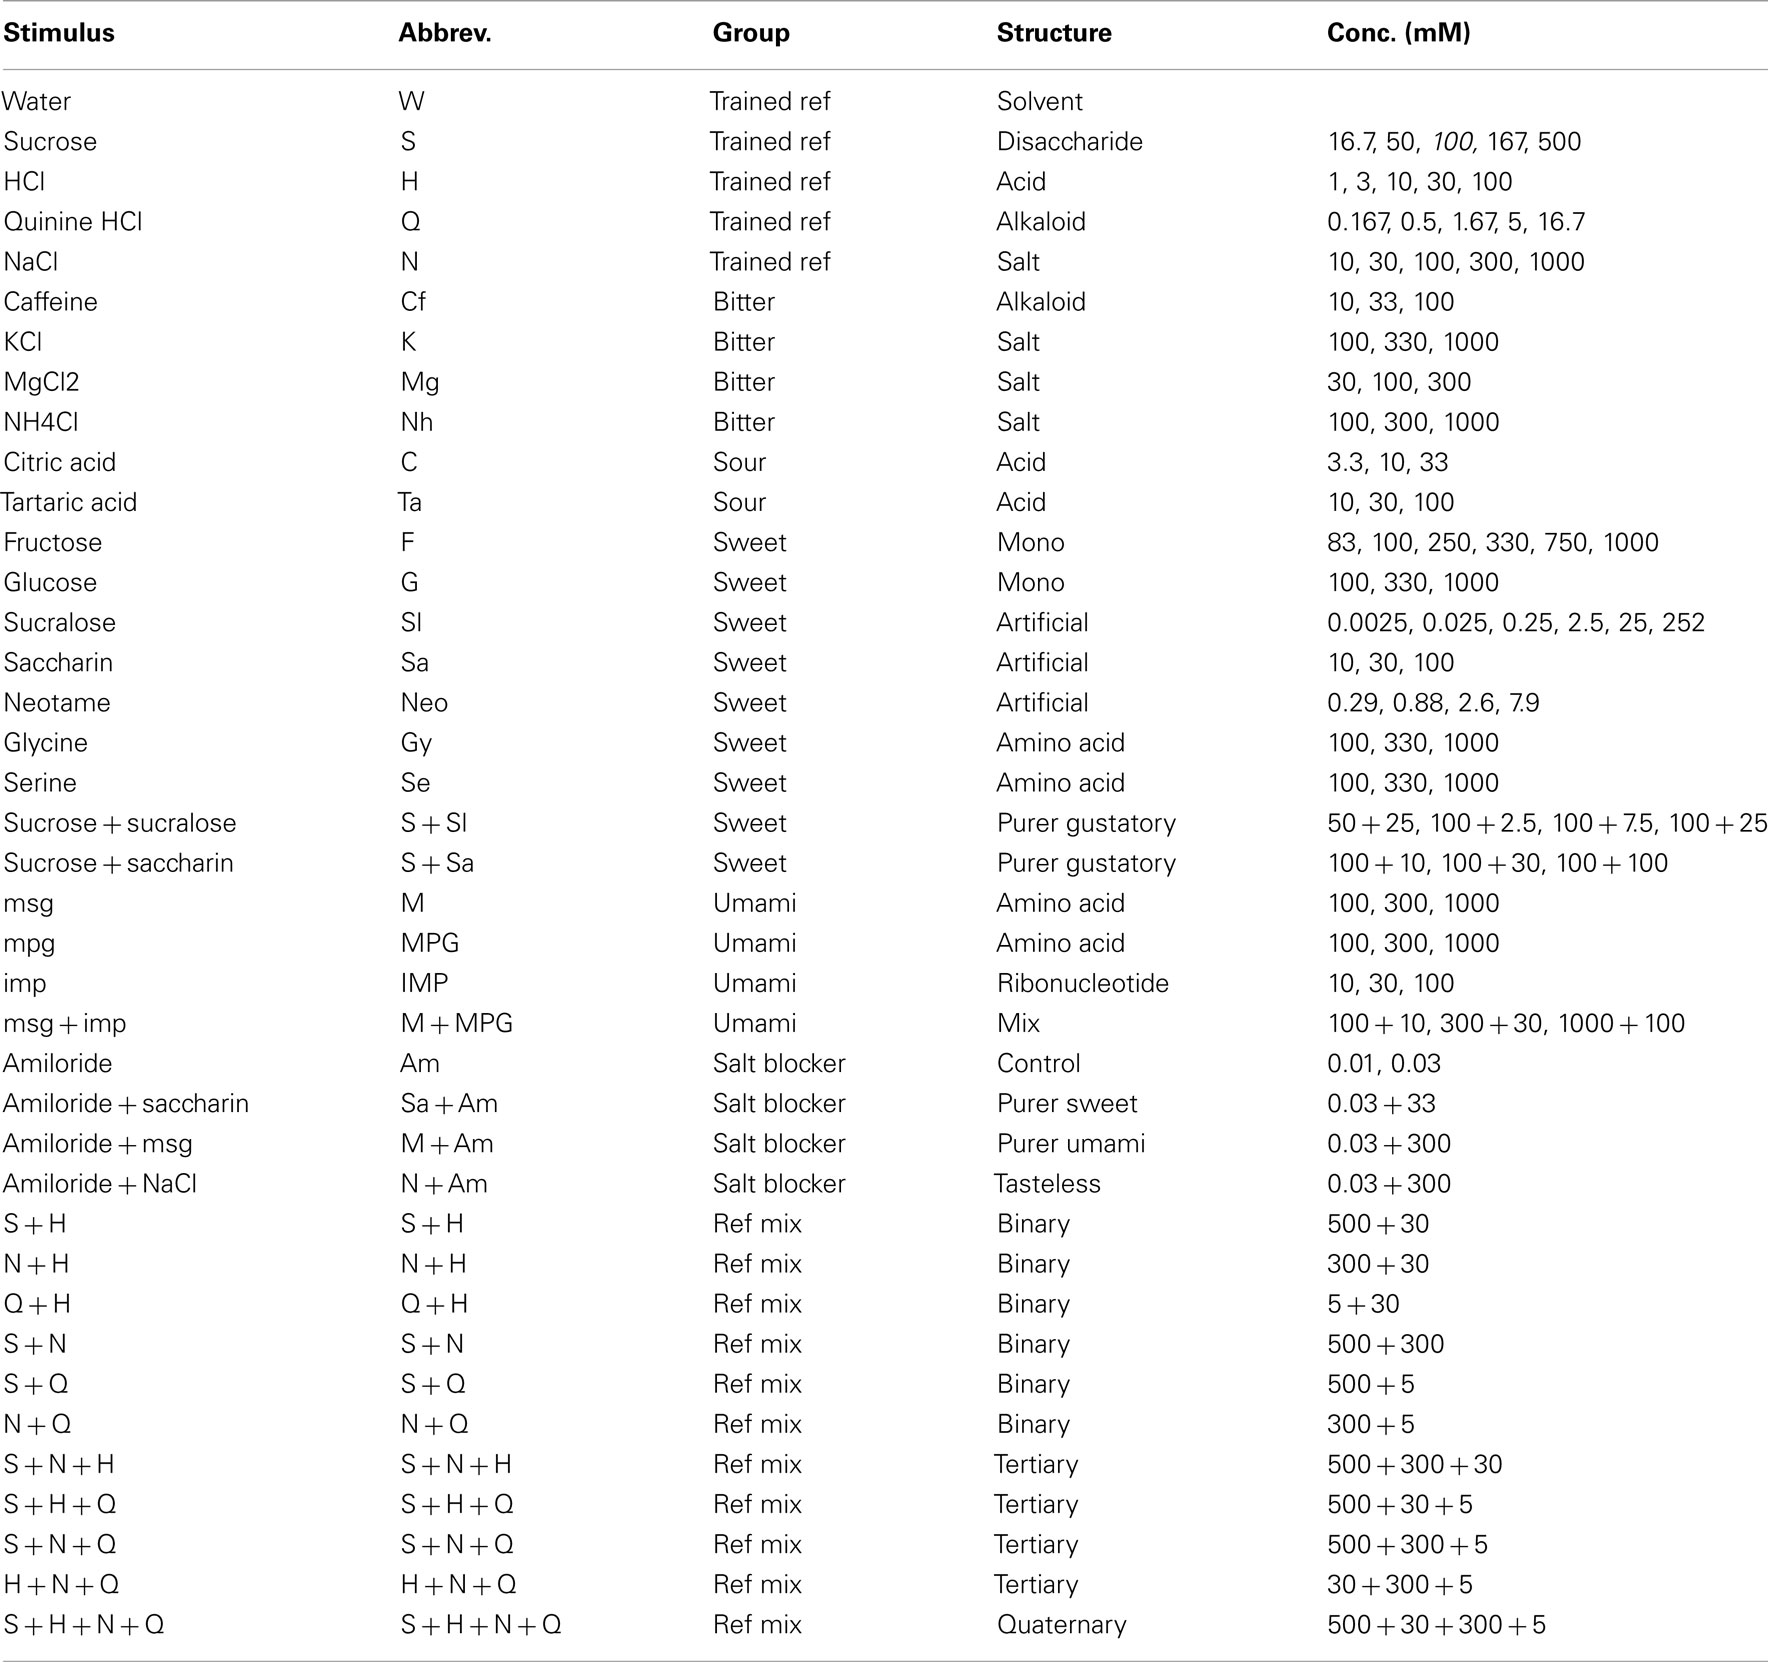
Table 6. Stimulus list.
Sour Tastants
Unlike the bitter stimuli, the sour tastants generalized purely to HCl (Figure 3C). Report to tartaric acid was similar to HCl (r = 0.86 at 30 and 100 mM). This concentration–response profile was very similar to citric acid, the latter reaching only r = 0.63 and r = 0.71 similarity to HCl at 10 and 33 mM, respectively. Of the tastants, only quinine reached positive correlation with these sour-like stimuli (r < 0.09). Concentration had a significant effect on the reported HCl-likeness for tartaric acid (F2,11 = 5.3, P < 0.05) and nearly so for citric acid (F2,11 = 3.8, P = 0.065); see Figure 3B).
Sweet Tastants
To explore the rats’ generalization to monosaccharides we presented them with glucose (0.1, 0.33, and 1 M) and fructose (0.083–1 M). As expected, both yielded near-identical response patterns to sucrose (r = 0.99 at 1 M, Figure 4A), and had steeply declining curves with decreasing concentration (r = 0.12 and 0.48 at 0.33 M for glucose and fructose, respectively). Note that we presented three pairs of similar concentrations of fructose, to which the rats responded similarly. Water was chosen at r = 0.90 at or below 0.1 M of the sugars. Concentration had a significant effect on the sucrose report for both glucose (F2,15 = 29.9, P < 0.001) and frucose (F5,23 = 11.1, P < 0.001) as well as water report (see Figure 4A).
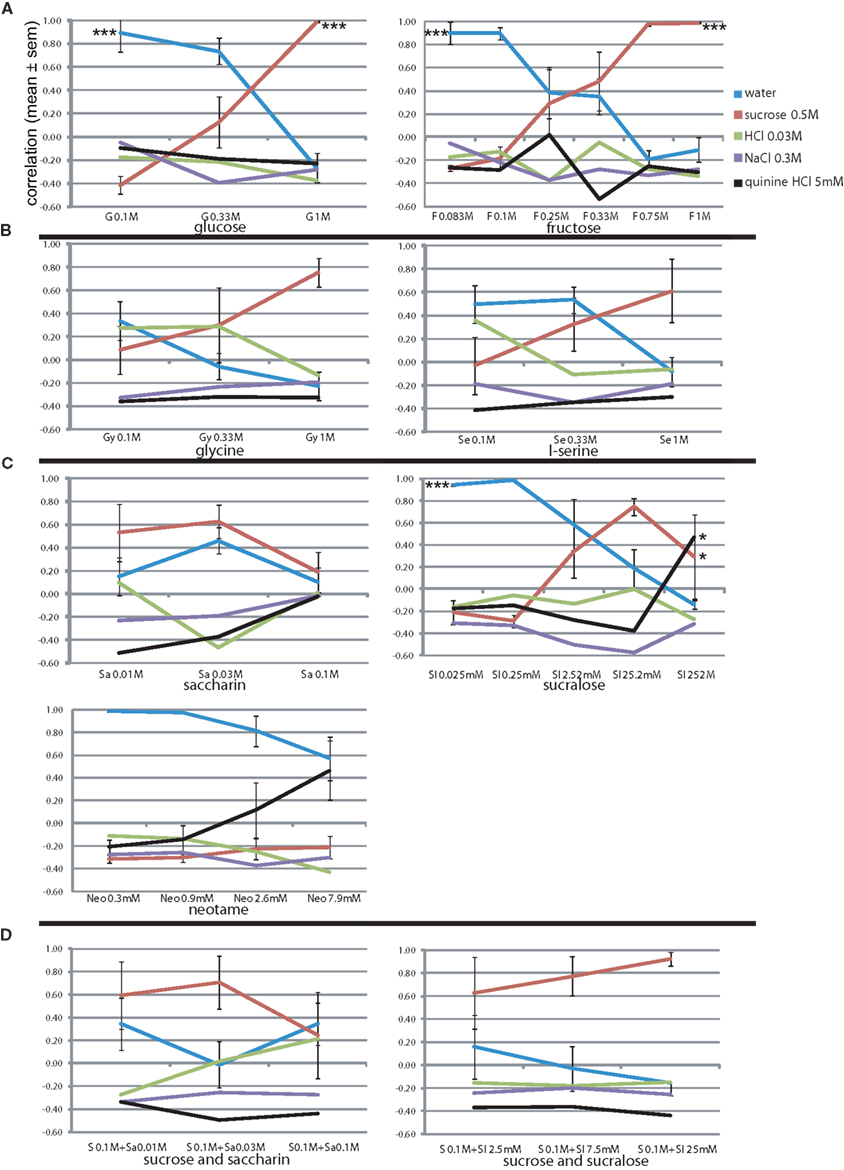
Figure 4. Concentration–response generalization curves of sweet tastants. *P < 0.05, **P < 0.01, ***P < 0.001 (MANOVA on concentration). (A) Sugars. (B) Amino acids. (C) Artificial sweeteners. (D) Sucrose mixtures.
We also presented the rats with amino acids that have been suggested to be sweet to rats (Figure 4B). Indeed, l-glycine at 1 M yielded r = 0.76, and l-serine a more moderate correlation of 0.61, while similarity to other response options did not go above r = 0, indicating a rather pure sweetness (i.e., saccharin-likeness). At lower concentrations l-glycine appeared to be sweet–sour (HCl r = 0.28–0.29) of decreasing intensity (increasing water similarity). L-serine also became mildly sour at the lowest concentration on 0.1 M (r = 0.36 with HCl, r = 0.50 with water). These amino acids did not contain HCl.
Variable results have been reported for the apparent sweetness of artificial sweeteners between strains and sexes. Our rats reported saccharin as moderately sweet (Figure 4C), peaking at the intermediate concentration (0.03 M, r = 0.63 to sucrose), but with a rather high watery component (r = 0.46). We tested a 4-log unit range of sucralose, and rats reported a fairly exclusively high correlation with sucrose of r = 0.75 at intermediate concentration of 25.2 mM (water: r = 0.19, rest < 0.00). This apparent sweetness dropped at a relatively shallow slope, being r = 0.34 1 log unit below and r = 0.29 1 log unit above this peak sweetness concentration. Neotame was exclusively moderately bitter, peaking at r = 0.47 at 7.9 mM (water: r = 0.57). Rats did not report taste similarity below 1 mM Neotame (r < −0.11, water r > 0.98). Concentration had a significant effect on the sucralose reported sucrose-likeness (F4,19 = 4.1, P < 0.05), quinine-likeness (F4,19 = 4.2, P < 0.05) and water-likeness sucrose-likeness (F4,19 = 13.9, P < 0.001; see Figure 4C).
To generate a more purely sweet gustatory stimulus with low caloric value, we attempted to create a stimulus that would have a viscosity closer to water (η = 1.0 cP) than 0.5 M sucrose (or 1 M fructose and glucose), but would retain most of the sweetness of these stimuli. The artificial sweeteners by themselves did not show sufficient sweetness intensity or purity. We chose 0.1 M sucrose as our base (Figure 3B) and mixed it with various concentrations of artificial sweeteners shown to be sweet (Figure 4D: saccharin and sucralose). Figure 4D shows that the addition of 0.1 M sucrose to the series of saccharin of Figure 4C barely raised the sucrose-likeness over that of saccharin alone (sucrose correlations: 0.59 vs. 0.53, 0.71 vs. 0.63, and 0.25 vs. 0.19 from low to high concentrations). It may have enhanced sweet intensity as reportedly the water-likeliness dropped from r = 0.46 to −0.01, which in part was also due to a rise in similarity with HCl. Much more synergistic was the combination of sucrose with sucralose (Figure 4D). Sucrose similarity peaked at r = 0.92 at 25 mM sucralose with 0.1 M sucrose, higher than r = 0.75 without sucrose (Figure 4C), and did not generalize to other stimuli (r < −0.15), satisfying our goal of a pure strong sweet of low viscosity and 1/5th the caloric content of our reference of 0.5 M sucrose. At 2.5 and 7.5 mM the intensity dropped very gradually, like sucralose itself, with correlation with 0.5 M sucrose dipping to r = 0.77 and r = 0.63.
Umami Tastants
Umami is considered a fifth basic taste, and was not part of the training set. If it is indeed a basic taste, none of the four prototypical tastants of the learned set should be chosen by the animals when presented with pure umami stimuli. We first presented 0.1, 0.3, and 1 M monosodium glutamate (MSG, M; Figure 5), with its equimolar sodium ion. The animals seemed to report some increasing NaCl similarity (r = 0.43, 0.80, and 0.89, respectively), although generally this was lower than that of NaCl as test stimulus at 0.1 and 0.3 M NaCl (r = 0.90 and 0.96, Figure 3A), except at 1 M NaCl (r = 0.77, Figure 3A), likely due to absence of the smaller chloride ion. Other responses remained low (r < 0.00, Figure 5). Concentration had a significant effect only on the reported water-likeness (F2,11 = 5.0, P < 0.05).
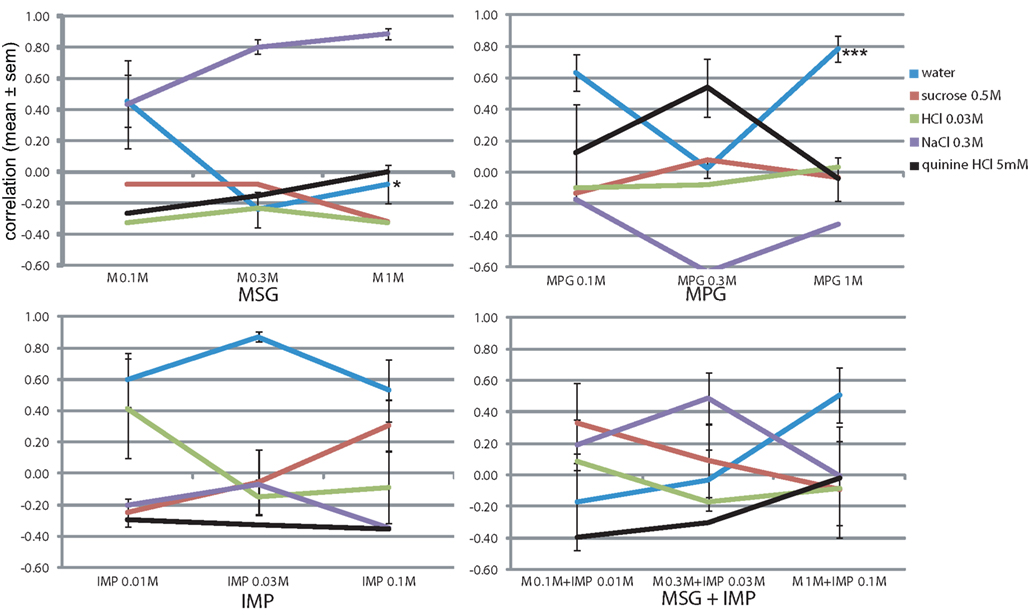
Figure 5. Concentration–response generalization curves of umami stimuli. *P < 0.05, ** P < 0.01, *** P < 0.001 (MANOVA on concentration).
Rats did not report saltiness when using monopotassium glutamate (MPG, having a K+ ion instead of Na+ ion, Figure 5). Their taste response peaked at 0.3 M with a quinine-likeness of r = 0.54 and very mild sucrose band of r = 0.08. At 0.1 and 0.33 M the profile is quite similar to that of KCl (Figure 3B), but at 1 M no bitterness was reported here (r = −0.04, Figure 5) vs. r = 0.33 there (Figure 3B). For MPG as well concentration had a significant effect only on the reported watery taste (F2,11 = 20.6, P < 0.001).
IMP by itself yielded variable mild HCl responses at 0.01 M (r = 0.42 ± 0.32, Figure 5) and variable mild sucrose-likeness at 0.1 M (r = 0.31 ± 0.16, Figure 5), with no taste component at the intermediate concentration (r < −0.05). Highly variable responses were also obtained for mixtures of increasing concentrations of both IMP and MSG, with sucrose responses peaking at 0.1 M MSG and 0.01 M IMP (r = 0.32 ± 0.26, Figure 5) and NaCl peaking at 0.3 M MSG and 0.03 M IMP (r = 0.49 ± 0.16). Remarkably, no tastant was chosen reliably at the peak concentration of the mixture despite the presence of 1 M sodium (tastant likeness r < 0.00, Figure 5). The water response was only moderate at this high concentration (r = 0.51 ± 0.18), suggesting the presence of some taste component. These results substantiate the notion that umami is a distinct prototypical gustatory stimulus.
Amiloride
To evaluate the effect of the sodium salt of two of our tastants (MSG and Na-saccharin) we presented the rats with mixtures of the sodium channel blocker amiloride (Figure 6). We first tested the amiloride for taste components, and the rats indeed reported a mild bitterness (r = 0.31 at 10 μM and r = 0.37 at 30 μM). When 30 μM amiloride was mixed with 0.1 and 0.3 M NaCl, it nearly completely abolished the saltiness (r = −0.07 ± 0.25 and r = 0.10 ± 0.32, Figure 6), while amiloride’s bitterness was also no longer evident (r < −0.05). MSG (0.3 M) mixed with 30 μM amiloride had a similar behavioral taste profile as 0.3 M NaCl with amiloride: very low similarity to any taste stimuli, i.e., NaCl (r = 0.14) and quinine (r = 0.27) and others r < −0.32. Low water similarity does suggest the presence of some taste, but none that could be expressed in terms of the four basics. Sodium saccharin mixed with 30 μM amiloride (Figure 6) yielded a mixed mildly sweet (r = 0.43) and bitter(r = 0.18) profile less pure than the sweet (r = 0.63) sodium saccharin alone (Figure 4C).Concentration had a significant effect only on the reported watery taste (F5,23 = 4.6, P < 0.01) and sucrose-likeness (F5,23 = 4.8, P < 0.01).
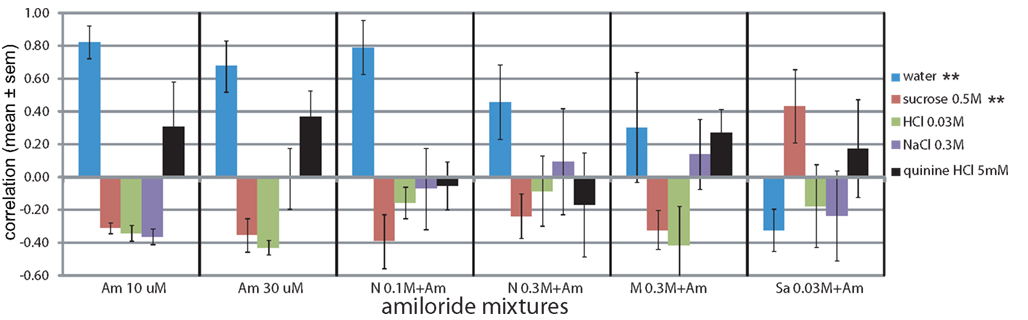
Figure 6. Amiloride addition blocks generalizations to salt. *P < 0.05, **P < 0.01, ***P < 0.001 (MANOVA on concentration).
Mixtures
We evaluated the rats’ report of mixtures of the standard training stimuli (Figure 7). Secondary mixtures are shown in Figure 7A. The mean difference between the similarity of the two stimuli that were part of the mixture was 0.26 ± 0.08, and the mean SD was 0.18 ± 0.05 (e.g., for H + N: H r = 0.45 and N r = 0.17, difference of 0.28, SD of 0.19). The mean similarity to each tastant across all three mixtures that it was part of was: S r = 0.58 ± 0.04, H r = 0.42 ± 0.03, Q r = 0.40 ± 0.19, and N r = 0.33 ± 0.09 (e.g., H in H + N r = 0.45, in H + Q r = 0.37 and in H + S r = 0.43, mean = 0.42). Thus the elements of the mixture were typically reported to be recognized at mild-moderate similarity, with S and H being most resistant to mixture suppression and N the least, in secondary mixtures. Only quinine (r = 0.04) did not survive the mixture with sucrose (r = 0.63; mixture suppression). MANOVA across the stimuli showed a significant effect on the reported NaCl-likeness (F5,23 = 3.4, P < 0.05), sucrose-likeness (F5,23 = 3.9, P < 0.05), and most strongly on quinine-likeness (F5,23 = 8.7, P < 0.001).
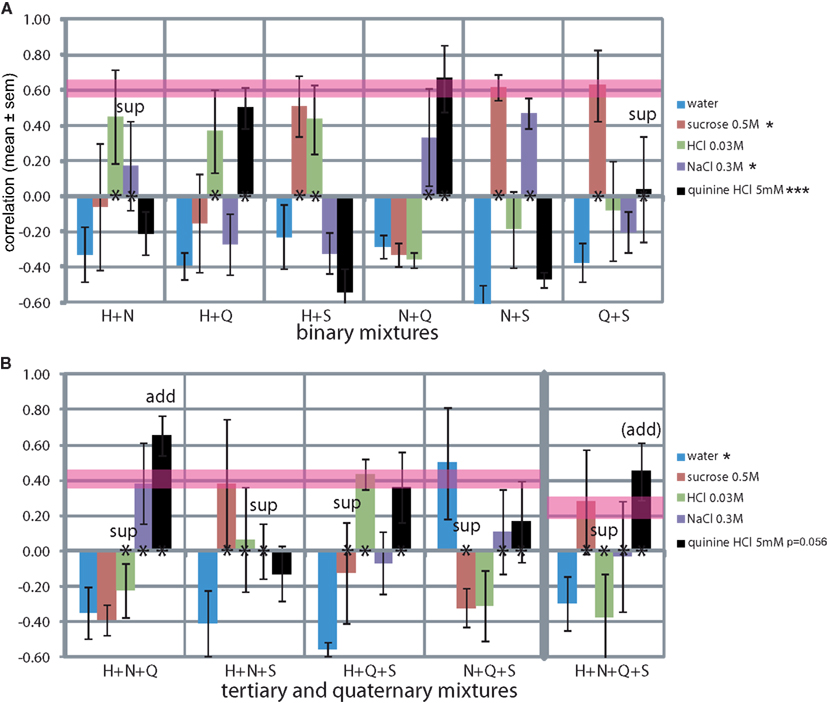
Figure 7. Generalization curves of mixtures of the trained stimuli. (A) Binary mixtures. *P < 0.05, **P < 0.01, ***P < 0.001 (MANOVA on stimuli). (B) Tertiary and quaternary mixtures. *P < 0.05, **P < 0.01, ***P < 0.001 (MANOVA on tertiary stimuli). Asterisks at y = 0 indicate the elements of the mixture. Pink horizontal lines are drawn to indicate theoretical maximum similarities assuming an even distribution of responses across the “correct” spouts associated with the elements of the mixture (binary r = 0.61 ± 0.05, tertiary r = 0.41 ± 0.06, quaternary r = 0.25 ± 0.07). “sup”: suppression of the element, “add”: additivity of (domination by) the element. See Discussion for Monte Carlo derivation.
Tertiary mixtures and the quaternary mixture are shown in Figure 7B. The mean ± SD between the similarities of the three stimuli that were part of the mixture was 0.32 ± 0.04. Thus, the recognition of the elements was significantly more variable in tertiary and the ternary mixtures than the secondary mixtures (t-test, P < 0.05). Typically only one (S in H + N + S) or two (H and Q in H + Q + S) of the elements were “recognized,” increasing the variance in response among all three or four elements of the mixture. MANOVA across the stimuli showed a significant effect on the reported watery taste (F3,15 = 5.8, P < 0.05) and nearly so on quinine-likeness (F3,15 = 3.3, P = 0.056).
The mean similarity to each tastant across all four mixtures that it was part of was: S r = 0.05 ± 0.23, H r = −0.03 ± 0.18, Q r = 0.40 ± 0.10, and N r = 0.12 ± 0.09, altogether significantly lower than in the secondary mixtures (t-test, P < 0.05), see Discussion. Clearly, quinine was the most resilient to mixture suppression and HCl and sucrose the least in more complex mixtures, quite a reversal from the secondary mixtures.
Water similarity was consistently low for all mixtures at r = −0.38 ± 0.04, excluding one outlier at r = 0.50 for the N + Q + S mixture. We could not find a reason for this outlier. Rats did not respond to taste mixtures by licking the water-associated spout.
Combined Analysis
Having collected response profiles from the same four rats a total of 100 distinct stimuli, we were in a unique position to explore a comprehensive “taste space” for rodents using statistical multivariate dimension reduction. Figure 8 shows a cluster analysis of all 100 stimuli (see Table 6 for abbreviations). At an inter-correlation level of r = 0.0 five groups are apparent: sour-like stimuli [H(Q)], water-like stimuli (W), salty-like stimuli (N), bitter/mixed stimuli (HNQS), and sweet-like stimuli with a salty side band S(N). What stands out is the large number of stimuli part of the water cluster, which at an inter-correlation of 0.57 (Figure 8) divides into three subgroups: water-like (W1 and W2, consisting of the lowest concentrations of tastants), amino acid like (AA, low concentration sweeteners and umami). Seven of the ten umami stimuli belong to the W group. All amiloride stimuli fall in this group as well. The H(Q) group divides into H and HQ, the former containing the reference HCl stimulus (red), the latter the HQ (blue) and HQS mixture (green). The N group does not subdivide from r = 0 to r = 0.57 and contains the train set NaCl stimulus. HNQS divides into Q and QS, containing Q, NQ, QS, HNQ, and HNQS. A large number of stimuli fall into the S(N) group, which separates into NS (containing NS and HNS) and S (containing most higher concentration sweeteners).
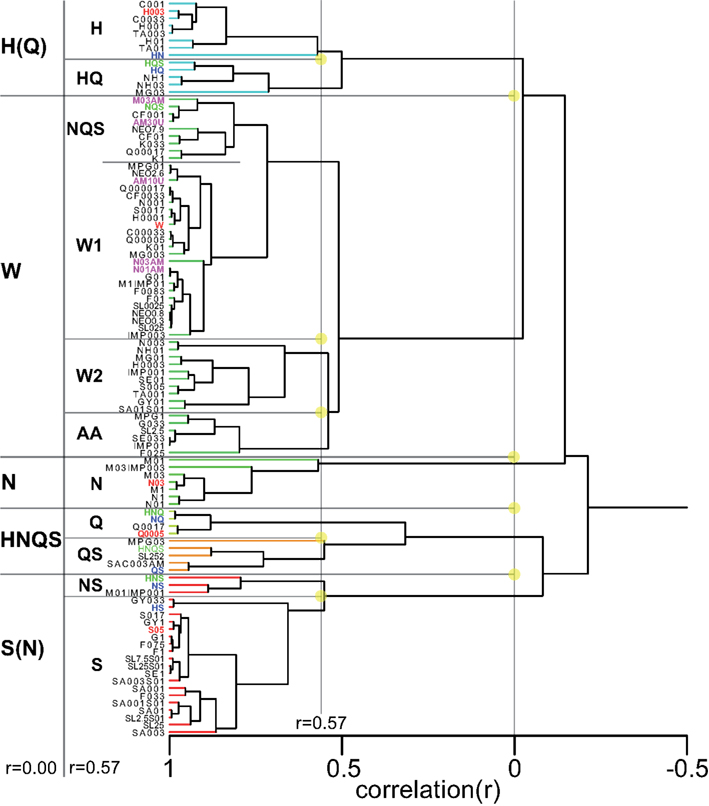
Figure 8. Cluster analysis across all 100 stimuli. Prototypical trained stimuli are indicated in red font. Binary mixtures in dark blue, tertiary, and quaternary in green. Amiloride in cyan. Five clusters are derived at an inter cluster correlation between ∼r = 0.0 and ∼r = 0.3. The largest cluster contains the weakest stimuli and water.
Figure A4 in Appendix shows a cluster diagram based on only the concentration series of the basics. Like Figure 8 this shows a large water group (W), clearly consisting of the lowest concentrations of tastants and water itself (plus outlier NQS). This water group exists at a large range of inter-correlation levels (roughly r = 0.05–0.4) when a total of five groups are evident (S, H, W, N, and Q), each containing the reference stimulus it is labeled with. The water-like group merges with the sour-like group, while the salty group merges with the bitter-like group, then HW merges with NQ, to merge last with S (Figure 4 in Appendix).
Figure 9 shows a good 3D taste space solution across all 100 stimuli (r2 = 0.93). A 2D solution explained 15% less of the variance (r2 = 0.78, not shown). The space is notably spherical (shown in all three projections), and not of a tetrahedron shape often hypothesized in considerations of the “existence” of four basic tastes. This notion is somewhat tempered by the tendency of MDSs based on correlations to form “donut-like” shapes (Erickson et al., 1993). The stimuli and overall shape are more clearly depicted in Video S2 in Supplementary Material, which shows the 3D MDS being rotated. Solutions of meaningful subsets of the stimuli explained only little of the data with high stress and are hence not shown. For example, an MDS of all four basics including MSG and all their concentrations and water reached only r2 = 0.23.We further established that MANOVA across all 100 the stimuli showed a significant effect of stimulus on the entire response set (F490, 1525 = 3.1, P < 0.001), as well as on each reported taste category separately (F98, 403 = 3.0 – 6.4, P < 0.001).
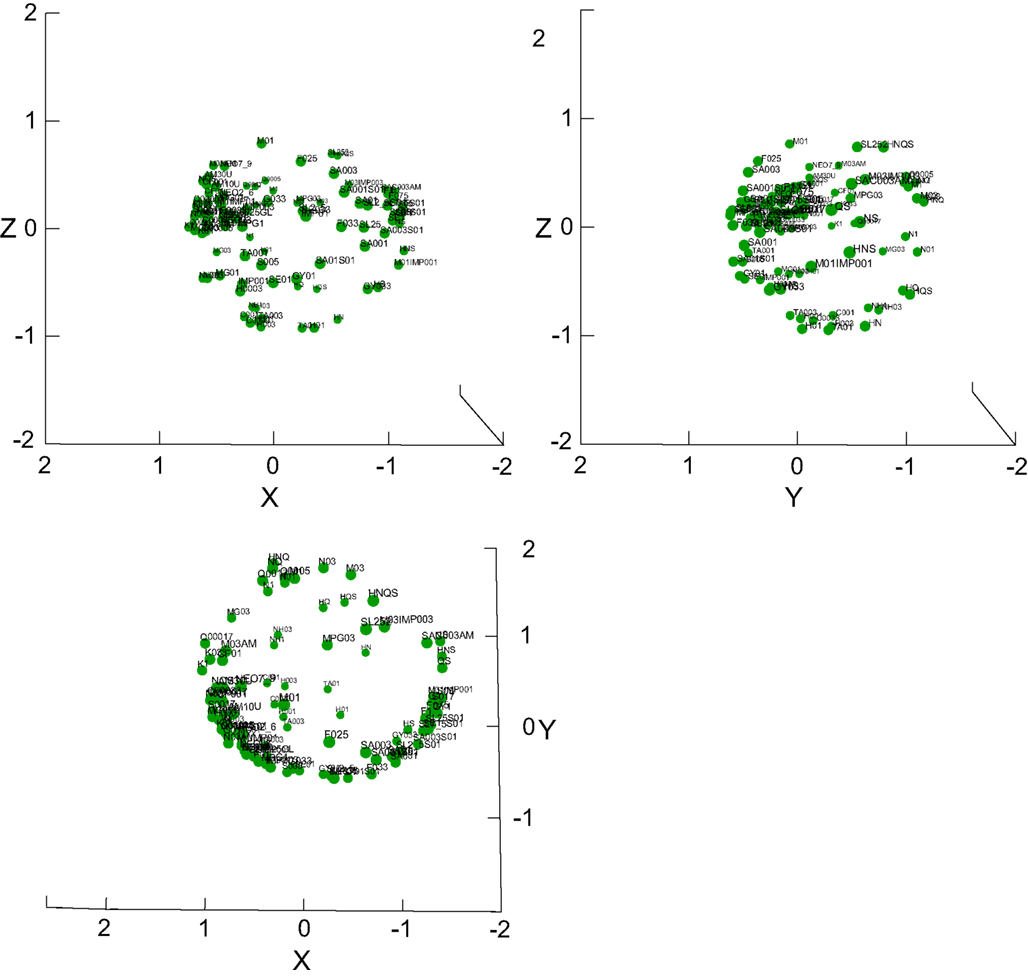
Figure 9. 3D MDS taste space of all stimuli. Three projections of the 100-stimulus taste space are provided, showing that it is shaped like a sphere, not a tetrahedron. See also Video S2 in Supplementary Material for a rotating version of this MDS.
Guided by the cluster analysis (Figure 8), we wanted to quantify the importance of intensity in the overall dataset. Principal component analysis with varimax rotation yielded four components with eigenvalues over 1, explaining 40, 30, 18, and 12% of the variance. The water similarity ratings of the stimuli correlated highly (r = 0.94) with the first factor. The first factor also correlated somewhat negatively with sucrose similarity (r = −0.56). The second factor correlated with NaCl similarity (−0.47), the third highly with HCl (r = 0.89), and the fourth with NaCl (r = −0.72) and quinine (r = 0.39). Thus, stimulus intensity explains about 35% of the entire dataset (0.942 × 40%).
Intra and Inter-Individual Variation
The test–retest repeatability across the four animals was high. For example, Figure 2B shows that the test–retest correlation among trained stimuli was 0.97 ± 0.01, where 93 ± 2% variance was explained. Figure 4A shows another example, where responses between similar concentrations of fructose yielded quite similar responses (e.g., 0.083 M vs. 0.1 M, 0.25 M vs. 0.33 M, and 0.75 M vs. 1 M).
Recall
The rats all showed good performance even after long delays between sessions and even at old age. Regressing the duration of these break between tests (including surrounding testing days) and their performance showed that the performance was 72.3% – the break duration (days)*0.33% (r2 = 0.74), or about 10% (absolute) per month. In three of four cases performance recovered to pre-break levels within one session, and within two sessions for the other. For the last break of 42 days the performance dropped from 75 ± 2 to 60 ± 4% (P < 0.001, 1-sided unpaired t-test), recovering the next day to 71 ± 4% (n.s.). Note that this performance remains well above chance level (20%). No generalization data was ever collected within 3 days after these long breaks.
Discussion
We present data showing, for the first time, that rats are able to learn cross-modal taste–location associations, simultaneously for five primary taste qualities water inclusive. This study also establishes the most complete taste space of a non-human animal regarding not only taste qualities but also intensity ratings. The taste profiles generated by these experiments contribute to the understanding of how perception of the specific taste stimuli relate to the perception of five basic taste qualities in intact behaving rats. Because this method involved no induced conditioning, no use of drugs but only positive reinforcement of spontaneous learning and memory, the data should be representative of animals’ natural taste perception. Another advantage of the present method over other available methods is the use of the same set of animals across a array of stimuli, thus minimizing the effect of between-animal variation and other variables.
Our taste location association paradigm offers several advantages over other taste generalization methods (Smith and Theodore, 1984; Yamamoto et al., 1985; Yamamoto and Yuyama, 1987; Gautam and Verhagen, 2010). Unlike the CTA tasks, we do not use negative reinforcement ensuring that discrimination is based entirely on the gustatory quality of the taste stimuli. Our non-aversive task is also less stressful to the animal eliminating any potential undesirable artifacts. Naturally aversive tastants such as quinine can also complicate interpretation of CTAs when used as test stimuli. The taste location association paradigm circumvents this, as the hedonic value of the taste stimuli does not play a role in the generalization assessments.
Like CTA, the Morrison task employs one group of animals per comparison stimulus, such that no single animal makes all comparisons between test stimuli and training set (Morrison, 1967; Ganchrow and Erickson, 2000; Grobe and Spector, 2008). The present paradigm requires only four rats to measure behavioral generalization to tens of stimuli, each rat expressing the similarity of a test stimulus to all trained stimuli (four basic tastants and water in our case). Therefore, besides a reduction in the number of animals needed to evaluate multiple taste stimuli, using the same set of animals to make comparisons across different taste stimuli minimizes inter-individual differences. While it took our rats a considerable time to learn the paradigm compared to the aforementioned tasks, now that we have optimized this method, future studies can be undertaken in combination with measures and/or manipulations of brain activity to provide extensive information about taste quality perception and the neural coding thereof.
We briefly compare our data to those of Grobe and Spector (2008), which is the most developed and relevant method of mapping the gustatory perceptual space in rodents. They use an operant taste generalization procedure adapted from the work by Morrison where rats were trained to discriminate a standard stimulus from the remaining four basic taste qualities and then tested for generalization of test compounds to the standard stimuli. Their data show that rats behaviorally generalized novel concentrations of the basic taste stimuli to their respective standards. They found that sugars generalized to sucrose, bitter compound denatonium generalized to quinine while tartaric acid generalized to the sour citric acid. These results are similar to what we obtained using our taste location association paradigm (Figures 3C and 4A). They also found that animals treated water as quinine-like, which is possibly why at low concentrations of the test stimuli a slight quinine component was often seen. This was not obvious in our data (Figure 3A). Grobe and Spector also found that KCl produced a complex generalization profile with notable quinine and citric acid components. At a comparable concentration we found KCl to be a weak but pure bitter stimulus, though at higher levels also HCl-like (Figure 3B). The other notable difference was seen with MSG, which they found generalized to a mixture of sucrose and NaCl. Our data show that MSG generalized to NaCl alone and a sucrose component was reported only in presence of IMP (Figure 5). These differences may be attributed to possible strain and/or sex differences as we used female Long–Evans rats, while in the Grobe and Spector study male Sprague Dawley rats were used and it is known that strain and sex differences can underlie differing taste responses in rats (Tobach et al., 1974; Kondoh et al., 2000; Curtis et al., 2004; Tordoff et al., 2008). We therefore think our study compares favorably with data obtained from Grobe and Spector and represents a viable alternative paradigm to determine taste quality perception in rodents.
The overall accuracy was ∼70%, which is well above chance. However, this level of performance was lower than the 5-odor olfactory-location tunnel task (∼94%) developed by Youngentob et al. (1990). It took the rats 70 days to perform above chance and an additional 100 days to reach asymptote. This is considerably longer than for the odor-tunnel task, which required approximately 3 weeks to acquire (S. Youngentob, personal communication). These performance differences may be based on functional differences between the taste and olfactory modalities. Rozin first posited in 1982 that the sense of smell has two functions, one being more interoceptive and proximal (retronasal smell of food) and the other more exteroceptive and distal (orthonasal smell; Rozin, 1982). The sense of taste, however, lacks this duality, and is exclusively interoceptive and proximal (e.g., food in the mouth) and hence might be difficult to associate with a place outside the body. We could hence expect that the distal sense of smell would be better positioned to form associations with distinct exteroceptive locations than either retronasal smell or gustation.
The neural circuitry involved in this task likely is centered around the entorhinal cortex and hippocampus, known to be involved in the encoding of episodic memory in general (Rolls, 2000; Buzsaki, 2005; Hasselmo and Brandon, 2008), as well as conjunctions between place and stimuli in particular (Komorowski et al., 2009). For example, reward–allocentric place associations have been reported in hippocampal neurons of rhesus monkeys (Rolls and Xiang, 2005). The hippocampus has been shown to be necessary for rapid food-location matching task in monkeys (Hampton et al., 2004). In rats, hippocampal neurons encoding the specific odor-place combinations have been reported (Wood et al., 1999). Only recently have hippocampal neurons been found that encode taste information depending on location using a visual cue guided lick task in two chambers (Ho et al., 2011). Our paradigm is highly suitable to more directly assess the role of the rodent’s position on hippocampal neuronal responses to tastants.
Our new taste–location association paradigm is a useful tool in exploring the perceptual similarity between the learned set of basic tastes and other stimuli, including concentration gradients of the same compounds, different taste compounds, as well as odorants and the effect of flavor experience on generalization. As with the odor–location task of Youngentob et al. (1990), the behavioral response profiles across the reward spouts allows the generation of similarity matrices and multidimensional scaling.
Our circular response arena is designed to enable tethered chronic neural recordings, as there are no obstacles between the rat and the open top of the arena. This may be a limitation for the odor–location task as published, in that rats have to enter a tunnel. In light of the current findings it appears that a tunnel may not be needed for that task. Nonetheless, the tunnels and their Y-shaped orientation relative to the odor sampling may help rats to orient themselves, possibly leading to faster task-acquisition. Due to the lengthy training period it would be most useful to employ a larger batch of animals if subsequent neurophysiological recordings are attempted, with 10 rodents being about the practical maximum unless test periods are shortened and/or one has more than one apparatus.
Both of these cross-modal paradigms have the added benefit of a reduction in the number of animals needed to evaluate multiple stimuli, as compared to CTA-generalization tasks. The latter requires about four rats per test stimulus to assess generalization between basic tastes. Like CTA, the Morrison task employs one group of animals per comparison stimulus, such that no single animal makes all comparisons between test stimuli and training set (Morrison, 1967; Ganchrow and Erickson, 2000; Grobe and Spector, 2008). The present paradigm requires only four rats to measure behavioral generalization to tens of stimuli, each rat expressing the similarity of a test stimulus to all trained stimuli (four basic tastants and water in our case).
Intensity
Taste intensity is one of the gustatory dimensions that include quality, hedonics, and time, but has been studied remarkably little in rodents. Water was included in the 5-stimulus response set to convey a measure of taste intensity. Our data suggests that rats do use the scale as we intended and was not used to “dump” stimuli deviating from the basic training set into the water response category. Intensity was found to play a major role in our stimulus set, explaining 35% of the response variance, even though most stimuli were well suprathreshold and their individual concentrations varied by only 1 log unit. Yamamoto et al. showed behavioral similarity profiles across 5 NaCl concentrations (0.01–1 M) to four basic tastes (no water) using CTA-generalization in rats (Yamamoto and Yuyama, 1987). The tuning of their concentration–response curve was remarkably similar to our findings (Figure 3A). They reported that the response profiles could be best explained by a spatial code (across region profile) in the taste cortex, followed by an across neuron profile for the chorda tympani nerve fibers. Generally, gustatory intensity is encoded by neural response magnitude (Ganchrow and Erickson, 1970; Scott and Perrotto, 1980). Scott and Giza showed relatively fine intensity discriminations via CTA-generalization, with just noticeable differences of 10–18% (Scott and Giza, 1987). Spector and colleagues subsequently showed that the chorda tympani interestingly is not crucial for suprathreshold intensity discriminations in rats, despite strong contribution to detection threshold concentrations (Colbert et al., 2004). Our taste–location task informs us about stimulus intensity, but across a relatively narrow range (∼1 log unit) as compared to, e.g., CTA-generalization as performed by Scott and Giza where lick counts vary logarithmically across three orders of concentrations (Scott and Giza, 1987). Our taste location task can be modified to expand the range by using four concentrations of one chemical as training stimulus, e.g. 100, 10−1, 10−2, 10−3M NaCl and water, and test many stimuli against them.
Umami
While the exact number of detectable qualitative taste categories varies across species, umami has come to be considered as the fifth basic taste. MSG is known to elicit an umami taste and also exhibits a taste synergism with 5′ ribonucleotides such as IMP, i.e., when low concentrations of IMP are mixed with MSG, the taste intensity of the mixture is greater than the sum of the components (Ninomiya et al., 1992).
Using our paradigm, we hypothesized that umami would not generalize to any of the four primary taste qualities that the rats were trained on. MSG showed a high correlation to NaCl due to the dominant taste of the sodium ions (Figure 5). Use of the sodium channel blocker amiloride along with MSG showed no overwhelming similarity to any of the training taste stimuli (Figure 6). We also used MPG to control for the taste of sodium. A moderate similarity with quinine was seen with 0.1 and 0.3 M MPG, similar to what was seen with KCl (Figure 3B). However at the highest concentration of 1 M MPG this bitterness was absent and MPG did not generalize to any of the four prototypical tastants. IMP alone as well as the mixtures of IMP + MSG at low concentrations elicited a mild sweetness, this mirrors what has been found by behavioral and electrophysiological studies (Yamamoto et al., 1991; Heyer et al., 2004; Grobe and Spector, 2008). CTA-generalization tests between MSG and sucrose and the suppression of glutamate and IMP synergistic taste responses recorded in the chorda tympani nerve by a sweet taste inhibitor suggests that MSG may have taste characteristics that are shared with sucrose (Sako and Yamamoto, 1999). It is believed that rats may perceive the taste of umami as sucrose-like due to convergence of the two pathways, either at the level of the taste receptor or further downstream the gustatory pathway. The mixture of IMP and MPG at a high concentration did not specifically generalize to any of the four basic tastes (Figure 5).
Our results clearly show that while umami shares some perceptual similarity with sucrose, it also elicits a unique taste in rats distinguishable from any of the basic taste stimuli. However, there remains the possibility that it may taste like a mixture of the basic taste qualities, as is the case for ethanol in mice (Blizard, 2007). Indeed, MSG with amiloride correlated strongly with the tertiary mixture N + Q + S (Figures 6 and 7B, r = 0.81, MANOVA, P > 0.7).The taste–location association paradigm can therefore be used to behaviorally categorize and elucidate the perceptual qualities of other unconventional taste modalities such as the taste of free fatty acids (Mattes, 2011).
Sweet Amino Acids
Behavioral studies in rodents show that sucrose and L-amino acids are known to share some qualitative features. CTA to sucrose can generalize to glycine, L-serine, and L-alanine (Schiffman et al., 1981; Kasahara et al., 1987; Delay et al., 2007). Our tests showed that glycine and L-serine had a predominant sweet component (Figure 4B), which especially stood out at higher concentrations. While L-amino acids are known to primarily bind to the umami T1R1/T1R3 receptor (Chaudhari et al., 2000), it is thought that that the perceptual similarity to sucrose may be due to the presence of multiple receptors that detect both MSG and L-amino acids or convergence along the afferent neural pathway.
Artificial Sweeteners
Saccharin is considered a poor sugar substitute for rats and at its maximally preferred concentration it is only as attractive as dilute sucrose (Smith and Sclafani, 2002). Indeed, while saccharin had a predominant sucrose component, it was not as intense as pure sucrose (Figure 4C). Combining saccharin with a dilute sucrose also did not enhance the sweetness (Figure 4D). There is also considerable variability among species in terms of their preference for artificial sweeteners that can be attributed to polymorphisms in the sweet taste receptor genes. Neotame, while sweet to humans, apes and old world monkeys is not sweet to new world monkeys and rodents (Liu et al., 2011). In our study we found that rats generalized Neotame to a quinine-like taste (Figure 4C). Sucralose is known to have an aversive off-taste that reduces its palatability to rats but to humans it tastes predominantly sweet with little or no after taste (Bello and Hajnal, 2005). Our data reflects this, as at a higher concentration of sucralose sweet-like taste decreased and bitter-like taste increased (Figure 4C). We created a low viscosity mixture of dilute sucrose (0.1 M) and sucralose. The addition of sucrose had a synergistic effect as the bitter taste was suppressed as a result of sucrose blocking the bitter off-taste and the sucrose-likeness was enhanced. We were therefore able to make this sucralose mixture more attractive to rats while maintaining its low caloric value and keeping its viscosity closer to that of other taste solutions.
Mixtures
We presented permutated mixtures of the basic training set to help understand how the rats use the “scale”: they conceivably could report with high water response to non-pure tastes. If not, we could take water report as a measure of intensity. We found that the rats indeed did not “dump” stimuli that deviated from the training set regarding taste quality (Figure 7): water similarity was well below r = −0.2 except for 1 outlier NQS.
Although water similarity can be used as intensity measure, the strength of the similarity with a non-water tastant cannot by itself serve that purpose. This is due to the limited correlation level that can be achieved when responses are distributed across stimuli. For example, in the H + S and the N + S mixtures the response similarities were similarly high between the components at r = 0.5–0.6. The maximum correlation possible in this case is r = 0.61 when responses are evenly distributed across, and only across the two elements, assuming an even distribution across incorrect responses to the training set (e.g., 100 licks to correct stimulus and ∼10 licks each to all incorrect stimuli). This is 0.41 for three elements and 0.25 for a quaternary mixture.
We confirmed that these “maxima” are reasonable by using Monte Carlo simulations of 10,000 “sessions” per analysis (in Matlab). For the training set, the correct response was fixed and the responses to the four incorrect spouts varied between 0 and 15% (rel. to the correct response) with a uniformly randomized response incidence. For the test set (mixtures), we varied the “incorrect” responses (e.g., W, N, or S for an Q + H mixture) between 0 and 15% (rel. to the correct response incidence) per session (e.g., for the prior binary mixture 100 and 100 licks to the “correct” element-associated locations Q and H, and 10, 2, and 18 licks to incorrect spouts W, N, and S). We found that for one element r = 0.99 ± 0.01, for a two element mixture r = 0.61 ± 0.04, for three r = 0.41 ± 0.05, and four 0.25 ± 0.05 (mean ± SD). When up to 15% random licks were also added to the element itself we found only a slightly higher variation (for one element r = 0.99 ± 0.01, for two r = 0.61 ± 0.05, for three r = 0.41 ± 0.06, and four 0.25 ± 0.07). These levels are indicated as pink lines in Figure 7, where the width of the line represents the standard deviation. Deviations above the maxima do occur and are due to averaging across the four rats. In conclusion, water similarity is inversely proportional to stimulus intensity and tastant similarity is proportional to stimulus quality.
We also included the mixtures in order to address whether some stimuli would reliably standout of mixtures (suppression) or whether the mixtures would show homogenous additivity. We found evidence of mixture suppression, mainly in the more complex mixtures. Two cases of suppression for binary mixtures were found (i.e., no overlap of the response with the maxima in Figure 7): of N in the H + N mixture and of quinine in the Q + S mixture. For the more complex mixtures we found H in H + N + Q, of N in H + N + S, S in H + Q + S and in NQS, and H in the quaternary mixture. Evidence of additivity could be seen in HNQ, where the mixture was rated as Q well above expectation, and nearly so in the quaternary mixture, again suggesting additivity.
Conflict of Interest Statement
The authors declare that the research was conducted in the absence of any commercial or financial relationships that could be construed as a potential conflict of interest.
Acknowledgments
We would like to thank John Buckley for programming the behavioral PC interface in Labview, and Michael Fritz, Ron Goodman, and Tom D’Alessandro for designing and constructing the arena and optical lickspout. We thank Gordon Terwilliger (necropsy), Michael Schadt (histology and histochemistry) and Carmen Jane Booth, DVM, PhD (clinicopathologic and histopathologic analysis) from the Yale Mouse Research Pathology (Section of Comparative Medicine, Yale University). We thank Dr. Ivan deAraujo for helpful discussions regarding sweet stimuli. We would like to thank Drs. Mark Laubach and Barry Green for helpful comments on an earlier version of the manuscript. This work was supported by NIH/NIDCD grants R01DC009994 and R01DC011286 to Justus V. Verhagen.
Supplementary Material
The Video S1 and S2 for this article can be found online at: http://www.frontiersin.org/Behavioral_Neuroscience/10.3389/fnbeh.2012.00019/abstract
Video S1. (wmv format, duration: 1:39): This video shows the performance of rat 1 on 15 consecutive trials (trial 36–50) on test day 215. The five water reward spouts were numbered. It also shows (upper right insert) the custom Labview software interface. Actual behavioral choices can be directly compared to the taste–location map of rat 1. On trial 42 the rat chooses the wrong spout.
Video S2. (wmv format, duration: 0:44): The 3D MDS solution of Figure 9 being rotated for clear view of its shape and stimuli. The dense group of stimuli consists of the low concentration “watery” stimuli, equivalent to the large “W” cluster of Figure 8.
References
Bello, N. T., and Hajnal, A. (2005). Male rats show an indifference-avoidance response for increasing concentrations of the artificial sweetener sucralose. Nutr. Res. 25, 693–699.
Blizard, D. A. (2007). Sweet and bitter taste of ethanol in C57BL/6J and DBA2/J mouse strains. Behav. Genet. 37, 146–159.
Buzsaki, G. (2005). Theta rhythm of navigation: link between path integration and landmark navigation, episodic and semantic memory. Hippocampus 15, 827–840.
Chaudhari, N., Landin, A. M., and Roper, S. D. (2000). A metabotropic glutamate receptor variant functions as a taste receptor. Nat. Neurosci. 3, 113–119.
Colbert, C. L., Garcea, M., and Spector, A. C. (2004). Effects of selective lingual gustatory deafferentation on suprathreshold taste intensity discrimination of NaCl in rats. Behav. Neurosci. 118, 1409–1417.
Curtis, K. S., Davis, L. M., Johnson, A. L., Therrien, K. L., and Contreras, R. J. (2004). Sex differences in behavioral taste responses to and ingestion of sucrose and NaCl solutions by rats. Physiol. Behav. 80, 657–664.
Delay, E. R., Mitzelfelt, J. D., Westburg, A. M., Gross, N., Duran, B. L., and Eschle, B. K. (2007). Comparison of L-monosodium glutamate and L-amino acid taste in rats. Neuroscience 148, 266–278.
Erickson, R. P., Rodgers, J. L., and Sarle, W. S. (1993). Statistical analysis of neural organization. J. Neurophysiol. 70, 2289–2300.
Frank, M. E. (1985). Sensory physiology of taste and smell discriminations using conditioned food aversion methodology. Ann. N. Y. Acad. Sci. 443, 89–99.
Ganchrow, D., and Erickson, R. P. (2000). Taste quality and intensity: lessons from the Morrison technique. Physiol. Behav. 69, 121–133.
Ganchrow, J. R., and Erickson, R. P. (1970). Neural correlates of gustatory intensity and quality. J. Neurophysiol. 33, 768–783.
Gautam, S. H., and Verhagen, J. V. (2010). Evidence that the sweetness of odors depends on experience in rats. Chem. Senses 35, 767–776.
Grobe, C. L., and Spector, A. C. (2008). Constructing quality profiles for taste compounds in rats: a novel paradigm. Physiol. Behav. 95, 413–424.
Hampton, R. R., Hampstead, B. M., and Murray, A. E. (2004). Selective hippocampal damage in rhesus monkeys impairs spatial memory in an open-field test. Hippocampus 14, 808–818.
Hasselmo, M. E., and Brandon, M. P. (2008). Linking cellular mechanisms to behavior: entorhinal persistent spiking and membrane potential oscillations may underlie path integration, grid cell firing, and episodic memory. Neural Plast. 2008, 658323.
Heyer, B. R., Taylor-Burds, C. C., Mitzelfelt, J. D., and Delay, E. R. (2004). Monosodium glutamate and sweet taste: discrimination between the tastes of sweet stimuli and glutamate in rats. Chem. Senses 29, 721–729.
Ho, A. S., Hori, E., Thi Nguyen, P. H., Urakawa, S., Kondoh, T., Torii, K., Ono, T., and Nishijo, H. (2011). Hippocampal neuronal responses during signaled licking of gustatory stimuli in different contexts. Hippocampus 21, 502–519.
Kasahara, T., Iwasaki, K., and Sato, M. (1987). Taste effectiveness of some D- and L-amino acids in mice. Physiol. Behav. 39, 619–624.
Kent, P. F., Mozell, M. M., Youngentob, S. L., and Yurco, P. (2003). Mucosal activity patterns as a basis for olfactory discrimination: comparing behavior and optical recordings. Brain Res. 981, 1–11.
Kent, P. F., Youngentob, S. L., and Sheehe, P. R. (1995). Odorant-specific spatial patterns in mucosal activity predict perceptual differences among odorants. J. Neurophysiol. 74, 1777–1781.
Komorowski, R. W., Manns, J. R., and Eichenbaum, H. (2009). Robust conjunctive item–place coding by hippocampal neurons parallels learning what happens where. J. Neurosci. 29, 9918–9929.
Kondoh, T., Mori, M., Ono, T., and Torii, K. (2000). Mechanisms of umami taste preference and aversion in rats. J. Nutr. 130, 966S–970S.
Liu, B., Ha, M., Meng, X. Y., Kaur, T., Khaleduzzaman, M., Zhang, Z., Jiang, P., Li, X., and Cui, M. (2011). Molecular mechanism of species-dependent sweet taste toward artificial sweeteners. J. Neurosci. 31, 11070–11076.
Mattes, R. D. (2011). Accumulating evidence supports a taste component for free fatty acids in humans. Physiol. Behav. 104, 624–631.
Morrison, G. R. (1967). Behavioural response patterns to salt stimuli in the rat. Can. J. Psychol. 21, 141–152.
Nachman, M. (1963). Learned aversion to the taste of lithium chloride and generalization to other salts. J. Comp. Physiol. Psychol. 56, 343–349.
Ninomiya, Y., Higashi, T., Katsukawa, H., Mizukoshi, T., and Funakoshi, M. (1984). Qualitative discrimination of gustatory stimuli in three different strains of mice. Brain Res. 322, 83–92.
Ninomiya, Y., Kurenuma, S., Nomura, T., Uebayashi, H., and Kawamura, H. (1992). Taste synergism between monosodium glutamate and 5’-ribonucleotide in mice. Comp. Biochem. Physiol. A Comp. Physiol. 101, 97–102.
Rolls, E. T., and Xiang, J.-Z. (2005). Reward-spatial view representations and learning in the primate hippocampus. J. Neurosci. 25, 6167–6174.
Rozin, P. (1982). “Taste-smell confusions” and the duality of the olfactory sense. Percept. Psychophys. 31, 397–401.
Sako, N., and Yamamoto, T. (1999). Analyses of taste nerve responses with special reference to possible receptor mechanisms of umami taste in the rat. Neurosci. Lett. 261, 109–112.
Schiffman, S. S., Sennewald, K., and Gagnon, J. (1981). Comparison of taste qualities and thresholds of D- and L-amino acids. Physiol. Behav. 27, 51–59.
Schoenbaum, G., Garmon, J. W., and Setlow, B. (2001). A novel method for detecting licking behavior during recording of electrophysiological signals from the brain. J. Neurosci. Methods 106, 139–146.
Scott, T. R., and Giza, B. K. (1987). A measure of taste intensity discrimination in the rat through conditioned taste aversions. Physiol. Behav. 41, 315–320.
Scott, T. R., and Perrotto, R. S. (1980). Intensity coding in pontine taste area: gustatory information is processed similarly throughout rat’s brain stem. J. Neurophysiol. 44, 739–750.
Smith, D. V., and Theodore, R. M. (1984). Conditioned taste aversions: generalization to taste mixtures. Physiol. Behav. 32, 983–989.
Smith, D. V., Travers, J. B., and Van Buskirk, R. L. (1979). Brainstem correlates of gustatory similarity in the hamster. Brain Res. Bull. 4, 359–372.
Smith, J. C., and Sclafani, A. (2002). Saccharin as a sugar surrogate revisited. Appetite 38, 155–160.
Tapper, D. N., and Halpern, B. P. (1968). Taste stimuli: a behavioral categorization. Science 161, 708–710.
Tobach, E., Bellin, J. S., and Das, D. K. (1974). Differences in bitter taste perception in three strains of rats. Behav. Genet. 4, 405–410.
Tordoff, M. G., Alarcon, L. K., and Lawler, M. P. (2008). Preferences of 14 rat strains for 17 taste compounds. Physiol. Behav. 95, 308–332.
Wood, E. R., Dudchenko, P. A., and Eichenbaum, H. (1999). The global record of memory in hippocampal neuronal activity. Nature 397, 613–616.
Yamamoto, T., Matsuo, R., Fujimoto, Y., Fukunaga, I., Miyasaka, A., and Imoto, T. (1991). Electrophysiological and behavioral studies on the taste of umami substances in the rat. Physiol. Behav. 49, 919–925.
Yamamoto, T., and Yuyama, N. (1987). On a neural mechanism for cortical processing of taste quality in the rat. Brain Res. 400, 312–320.
Yamamoto, T., Yuyama, N., Kato, T., and Kawamura, Y. (1985). Gustatory responses of cortical neurons in rats. III. Neural and behavioral measures compared. J. Neurophysiol. 53, 1370–1386.
Youngentob, S. L., Johnson, B. A., Leon, M., Sheehe, P. R., and Kent, P. F. (2006). Predicting odorant quality perceptions from multidimensional scaling of olfactory bulb glomerular activity patterns. Behav. Neurosci. 120, 1337–1345.
Youngentob, S. L., Margolis, F. L., and Youngentob, L. M. (2001). OMP gene deletion results in an alteration in odorant quality perception. Behav. Neurosci. 115, 626–631.
Youngentob, S. L., Markert, L. M., Hill, T. W., Matyas, E. P., and Mozell, M. M. (1991). Odorant identification in rats: an update. Physiol. Behav. 49, 1293–1296.
Youngentob, S. L., Markert, L. M., Mozell, M. M., and Hornung, D. E. (1990). A method for establishing a five odorant identification confusion matrix task in rats. Physiol. Behav. 47, 1053–1059.
Appendix
Methods
Health and post-mortem pathology of rats
Our approach allows for a long duration of testing: the four rats were received January 2009 at 180–200 g BW (roughly 2 months old), training starting February 2009, generalization starting November 2009 on test day 192 (Figure 1) and ending December 2010 on test day 378. Thus, testing extended just beyond 2 years of age. We therefore briefly describe their health as minor age-related issues did come up.
Rat 1 and 3 developed pododermatitis (bumble foot) on the hind footpads around the end of August 2010 (a bacterial condition). Water restriction was discontinued and they were treated with 3 weeks of Baytril and 1 week of Sulfatrim in drinking water, daily application of topical antibiotic ointment, and placed in individual cages containing an inch of AlphaDri bedding changed three times per week.
Rat 1 and 3 also had subcutaneous masses surgically removed on September 7 2010. Mammary lobular fibroadenoma was the morphologic diagnosis in both cases. Fibroadenomas are the most common benign tumor of the rat mammary gland. Both issues had resolved by the end of September 2010. None of the rats were tested for generalization between 9/2/2010 and 10/26/2010 and appeared to be in good health until euthanasia. Indeed their performance remained well above chance at ∼75%.
During the last 2 months of their lives we collected the data on the mixtures of the four basic tastants (Figure 7), the fructose series (Figure 4A), the Neotame series (Figure 4C) as well as the sucrose-artificial sweetener mixture series (Figure 4D).
Necropsy was performed on all four rats in January 2011. From a pathologic perspective, they had multiple common aging lesions, such as, benign mammary tumors and chronic degenerative processes in the heart and kidney. A nasal fungal infection was diagnosed in rat 2, and bacterial skin infection (pododermatitis) in rat 3 and 4, which were significant and likely impacted on quality of life.
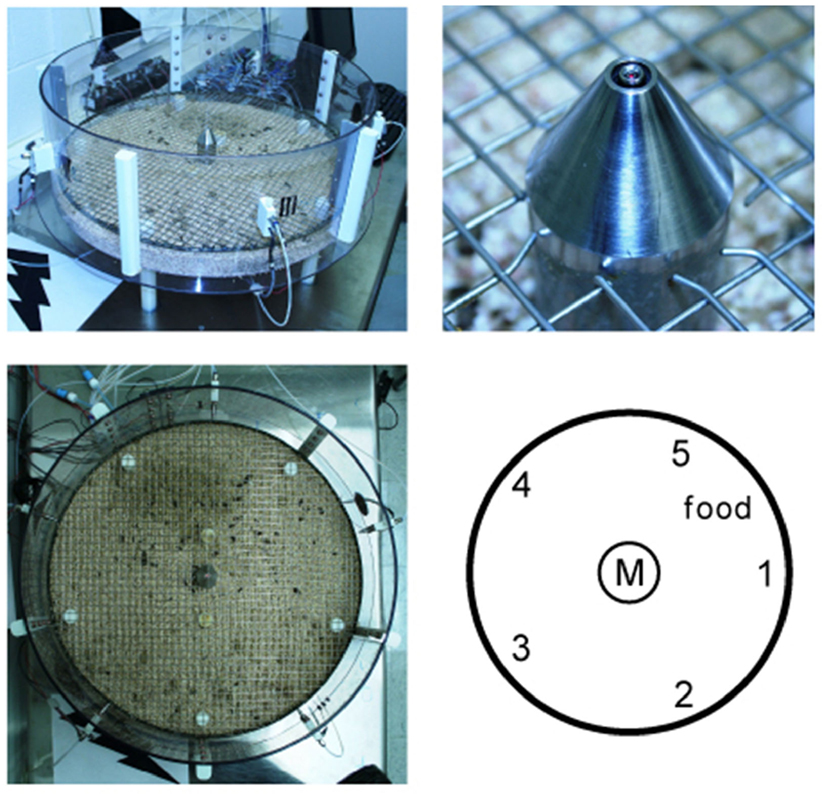
Figure A1. The training setup consists of a round transparent box with central taste manifold and surrounding water spouts (upper left). Upper right shows a picture of the manifold spout with micro-well and optical lickometer. Lower right shows a diagrammatic top view of the arena with central taste manifold (M) and the five surrounding water reward spout (1–5) of actual picture on the left.
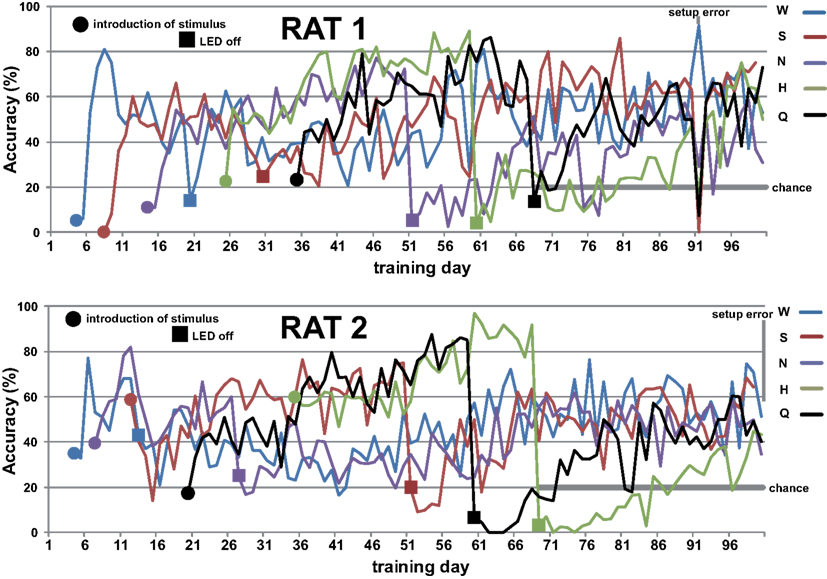
Figure A2. First hundred days of training of rat 1 (top) and 2 (bottom). Stimuli were sequentially added and spout choice guided by LED light. Sequences were randomized across rats. LED cues were turned off in same sequence as stimuli were introduced. Chance performance is 20% when only taste cues remain.
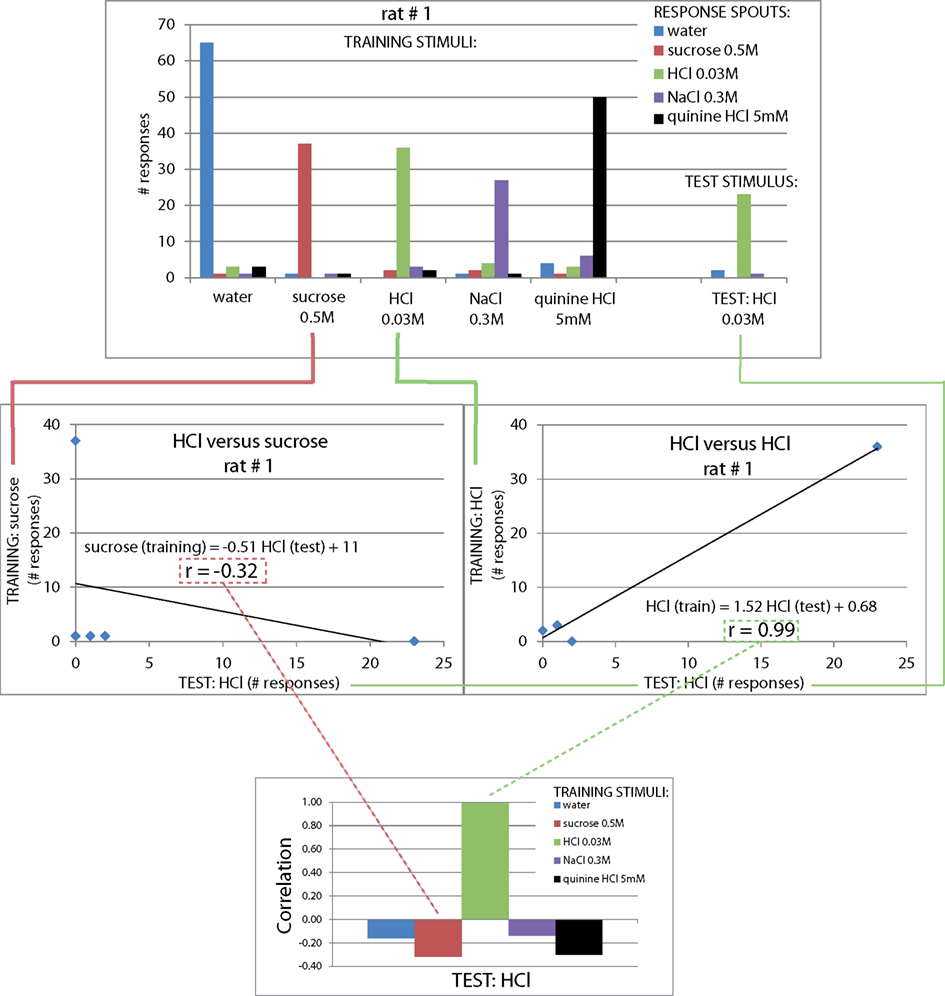
Figure A3. Explanation of calculation of generalization correlation values of one rat. Top: number of responses (y-axis) per spout (legend) for each test stimulus (x-axis). Middle left: a low correlation between the rat’s responses to test stimulus sucrose and the rat’s responses to training stimulus HCl (r = −0.32). Middle right: the correlation between test stimulus HCl and train stimulus HCl is expectedly much higher (r = 0.99). Bottom: the correlation between the test stimulus and all five training stimuli is calculated for each rat, and reported as the mean across all four rats (e.g., Figure 2).
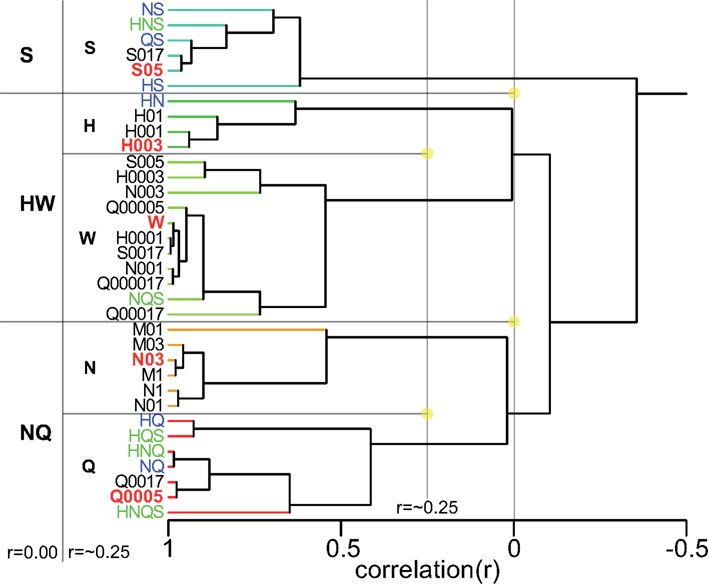
Figure A4. luster analysis of basics only. Five clusters are derived at an inter cluster correlation between ∼r = 0.0 and ∼r = 0.4. The largest cluster consists of weak tastants.
Keywords: flavor, taste, gustation, conditioned taste aversion, behavioral taste categorization, Morrison task, taste generalization, place learning
Citation: Gautam SH, Rebello MR and Verhagen JV (2012) Taste quality and intensity of 100 stimuli as reported by rats: the taste–location association task. Front. Behav. Neurosci. 6:19. doi: 10.3389/fnbeh.2012.00019
Received: 06 March 2012; Accepted: 16 April 2012;
Published online: 10 May 2012.
Edited by:
Martin Giurfa, Université Paul Sabatier-Toulouse III, FranceReviewed by:
Patricia M. Di Lorenzo, Binghamton University, USARobert J. Contreras, Florida State University, USA
Copyright: © 2012 Gautam, Rebello and Verhagen. This is an open-access article distributed under the terms of the Creative Commons Attribution Non Commercial License, which permits non-commercial use, distribution, and reproduction in other forums, provided the original authors and source are credited.
*Correspondence: Justus V. Verhagen, The John B. Pierce Laboratory, Department of Neurobiology, Yale University School of Medicine, 290 Congress Avenue, New Haven, CT 06519, USA. e-mail: jverhagen@jbpierce.org