
Gamma Band Light Stimulation in Human Case Studies: Groundwork for Potential Alzheimer’s Disease Treatment
Abstract
Background:
It is known that proteins associated with Alzheimer’s disease (AD) pathogenesis are significantly reduced by 40 Hz entrainment in mice. If this were to translate to humans, verifying that such a light stimulus can induce a 40 Hz entrainment response in humans and harnessing insights from these case studies could be one step in the development of a multisensory device to prevent and treat AD.
Objective:
Verify the inducement of a 40 Hz response in the human brain by a 40 Hz light stimulus and obtain insights that could potentially aid in the development of a multisensory device for the prevention and treatment of AD.
Methods:
Electroencephalographic brain activity was recorded simultaneously with application of stimulus at different frequencies and intensities. Power spectral densities were analyzed.
Results:
Entrainment to visual stimuli occurred with the largest response at 40 Hz. The high intensity 40 Hz stimulus caused widespread entrainment. The number of electrodes demonstrating entrainment increased with increasing light intensity. Largest amplitudes for the high intensity 40 Hz stimulus were consistently found at the primary visual cortex. There was a harmonic effect at double the frequency for the 40 Hz stimulus. An eyes-open protocol caused more entrainment than an eyes-closed protocol.
Conclusion:
It was possible to induce widespread entrainment using a 40 Hz light stimulus in this sample cohort. Insights gleaned from these case studies could potentially aid in the development of a multisensory medical device to prevent and treat AD.
INTRODUCTION
Alzheimer’s disease (AD) is a progressive neurodegenerative disease accounting for 70% of the 24–40 million cases of dementia worldwide [1, 2]. In addition to causing human suffering, AD places a significant financial burden on healthcare systems, costing in the order of $172 billion annually in the United States alone [1].
Pathogenesis in AD is characterized by the accumulation of extracellular amyloid-β (Aβ) protein and intracellular tau (τ) protein [1–3]. Pharmacologic agents currently available to treat AD merely temporarily alleviate the symptoms of the disease with an excess of 50% of patients completely failing to respond [3].
Recently, a potentially promising non-pharmacological approach to treating AD has been proposed, which involves stimulation of the brain at 40 Hz [4]. It was demonstrated that stimulating the CA1 region of the hippocampus (which is vital in episodic memory and autobiographical memory retrieval in humans [5]) of a transgenic AD mouse model (5XFAD) for just one hour reduced Aβ levels in that region by approximately 50% [4]. Stimulation involved shining a blue light, flashing at 40 Hz, at optogenetically modified interneurons in this region of the brain. This effect was also observed in the visual cortex, when an external flickering 40 Hz white-light source, delivered via the retina, optic nerve, and subsequent pathways, was presented to the mice. Similar effects were observed using another mouse model of AD (TauP301S) where a similar level of reduction in phosphorylated τ was observed. In addition, established plaques were significantly reduced both in terms of number and size in the visual cortex following daily 1-hour exposures to the flickering stimulus over a week.
Martorell [6] extended this work by using an auditory 40 Hz stimulus for one hour per day for seven days. This resulted in a reduction in Aβ in the hippocampus and the auditory cortex of 5XFAD mice as well as an improvement in recognition and spatial memory. Interestingly using multiple sensory modalities of light and auditory stimuli together, but not alone, caused a decrease in Aβ in the medial prefrontal cortex.
Gamma oscillations in the brain are defined as 25 Hz–140 Hz oscillations in the local field potential in [7]. Gamma oscillations have been shown to be disrupted in AD [8, 9]. It was found in [4] that gamma power (defined there as 10 Hz–50 Hz) during sharp wave ripples was significantly higher in wild type mice than in 5XFAD mice and was centered about 40 Hz. Interestingly, in [4], Aβ levels were reduced when the light stimulus was set to flicker at 40 Hz but not significantly reduced when set to flicker at 20 Hz, 80 Hz, or randomly. The 40 Hz point was also repeatedly shown to be of particular significance in a recent review paper of gamma band auditory, visual, and somatosensory stimulation in humans [10]. Therefore, gamma band stimulation, and 40 Hz stimulation in particular, is studied in this work.
Entrainment is defined in [22] as ‘synchronization to a rhythmic stream (or train) of external events’. We define entrainment here as the synchronization of EEG waves with an external stimulus. In the quantifying the response subsection of the results section we further define entrainment, quantitatively, by means of an entrainment exceeding threshold (EET) metric. What is examined in this work is entrainment to our light stimulus, at the 40 Hz point in particular.
By using triggering stimuli, it is possible to induce electrical potentials, called event-related potentials (ERPs), in the brain. Photic stimulation, using flickering light, is just one type of external stimulus that can be used to cause such ERPs. Examples of studies of steady state gamma band responses due to photic stimulation include [11–13]. Other sensory modalities which can be used to cause ERPs include auditory stimulation and somatosensory stimulation. Research in [14–19] discuss 40 Hz steady state stimulation employing auditory stimuli while literature about ERPs produced using somatosensory stimuli includes [20, 21]. A detailed review of all of the above papers in this paragraph is provided in [10].
It was proposed in [4] that the underlying biological mechanism producing the reduction in pathogenic proteins was that microglia had been induced, by the 40 Hz stimulus, to transform from a quiescent to an activated phagocytic state. Evidence for this activation included co-localization of microglia with Aβ, increased cell body size and shorter process length after stimulation.
The work presented in this paper is a visual entrainment study. The motivation for this study is the hypothesis that exposure to a 40 Hz light stimulation, as part of a multisensory 40 Hz stimulation device (perhaps including auditory and somatosensory modalities), would result in the same reduction in pathogenic proteins in AD patients that occurred in [4]. Evidence for such a reduction would be required. PET PiB SUVR scans [23] and Tau-PET scans [24], for Aβ and τ proteins, respectively, could be used to test for reductions in these pathogenic proteins. Analysis of performance of these scans is beyond the scope of this work. However, if such reductions could be proven to have occurred in AD patients, and, crucially, if this translates to a bona fide disease modification with neuroprotection and improved cognitive function, (testing for which is also beyond the scope of this work) then, exposing AD patients to a 40 Hz multisensory stimulus could be a potential strategy for the prevention and treatment of AD.
The steps involved in developing such a treatment may include:
1. Carrying out a preclinical, animal study to demonstrate that 40 Hz light stimulus can cause significant reduction in Aβ and τ proteins.
2. Confirming in preclinical studies that 40 Hz light stimulation-induced reduction in Aβ and τ pathology provides neuroprotection and prevents cognitive decline in relevant animal models of AD.
3. Performing a small sample human healthy volunteer study, using a 40 Hz light stimulus, to induce entrainment and measure how cortically widespread the stimulus response is.
4. Optimization of the stimulus to cover as much of the cortex as possible since AD is a cortically widespread disease [25]. Such stimulus optimization might involve simultaneous employment of stimulation of more than one sensory modality. Then, carrying out another human healthy volunteer study using the optimized stimulus.
5. Executing a longitudinal clinical trial involving early- and mid-stage AD patients.
Step 1 of this process has already been achieved in [4]. Step 3 is to verify that such a stimulus can induce a 40 Hz entrainment response in humans and measure how cortically widespread the stimulus response is. Such a response could be measured using EEG recordings.
The purpose of the work presented in this paper is to tackle step 3 by presenting case studies of applying gamma band light stimulation at 40 Hz, 60 Hz, and 80 Hz, delivered via the eyes, to three healthy human volunteers, with simultaneous EEG recording of brain activity. EEG data was recorded at 40 Hz, 60 Hz, and 80 Hz to check whether any steady state response achieved was maximal at 40 Hz. Stimulation at 80 Hz was used because it is a harmonic of 40 Hz and 60 Hz was used because it is intermediate between 40 Hz and 80 Hz.
The structure of this paper is as follows: first, the methodology is detailed, including a description of ethical approval and inclusion criteria, experimental setup, stimulus protocol, measurement procedure and analysis methods; this is followed by a discussion of the results; the limitations of the work and future work are then considered, and finally, conclusions of the study are drawn.
To our knowledge this is the first in-depth quantitative analysis characterizing the response of healthy humans to a 40 Hz light stimulus at two different intensities with a view to aiding development of a potential treatment for AD.
The motivation for this study is to explore whether it is possible to induce a 40 Hz response in the human brain with our visual stimulus and to obtain insights from these case studies, which might act as an aid in one step of the future development of a potential multisensory medical device to prevent and possibly treat AD.
METHODS
In this section, ethical approval, inclusion criteria, experimental setup, stimulus protocol, measurement procedure, and analysis methods are discussed.
Ethical approval and inclusion criteria
The Research Ethics Committee of the National University of Ireland, Galway approved this study (reference number REC Application 18-Jan-15). Subjects were required to give informed written consent. Inclusion criteria for the study were: being healthy; not having been diagnosed with epilepsy (since a light stimulus flickering at 40 Hz could induce an epileptic attack [26, 27]); having no family history of epilepsy; not having a diagnosis of any form of dementia; and having normal (or corrected to normal) vision and hearing. According to these criteria, three healthy volunteers were recruited to act as participant case studies.
Experimental setup
The stimulus consisted of an Arduino-controlled ring of ten white light LEDs, programmed to strobe at 40 Hz, 60 Hz, and 80 Hz. The stimulus had two intensity settings for each of the frequencies. The higher intensity was achieved by having all LEDs turned on while the lower intensity settings involved turning off alternate LEDs in the ring. The rates of strobing were validated using a photodiode and oscilloscope. Stimulus intensity, at a distance of 30 cm from the light source, with all LEDs switched on (high intensity) was 408–435 lumens at 40 Hz, 415–425 lumens at 60 Hz and 421–430 lumens at 80 Hz. With every second LED turned off (low intensity state), the stimulus intensity, at the same distance, was 208–222 lumens at 40 Hz, 213–217 lumens at 60 Hz, and 229–235 lumens at 80 Hz. The light meter used was a 0500 Testo lux-meter (RS Components) at its most sensitive setting (of 1 lux). A range is given for each stimulus intensity as the measured intensity varied over the period of measurement with the lux-meter. The range of intensity values is presumably because the source was flickering. It was considered better to measure intensity values while the source was flickering, rather than in a steady state, because the strobing stimulus more closely matched test conditions. The stimulus was a square wave with a duty cycle of 50% for all frequencies. This duty cycle means that the light was on for half of the time and off for the other half so that, for the 40 Hz stimuli, for example, the light was on for 12.5 ms and off for 12.5 ms.
All experiments were carried out in a purpose-built EEG laboratory room that acted as a Faraday cage. A QuickAmp amplifier (BrainVision) with 32 passive electrodes attached to an electrode cap (EasyCap) [28] was used. The electrodes were arranged according to the international 10–20 system [29]. EEG data was recorded using BrainVision Recorder software from Brain Products using a sampling rate of 1000 Hz and an average electrode reference. ABRALYT 2000 gel was employed to obtain low impedances between the participant scalp and EEG electrodes.
Figure 1 shows the posterior view of one of the EasyCap electrode caps [28] used in this study. In the 10–20 electrode placement system [29] electrodes are named according to the lobe of the cortex over which they are placed. Odd-numbered electrodes are placed on the left-hand side of the head and even-numbered electrodes on the right-hand side (with electrodes on the sagittal plane assigned as ‘z’). Hence as shown in Fig. 1, O1 and O2 are placed on the left and right, respectively, over the occipital lobe, while Pz is placed on the sagittal plane at the level of the parietal lobe. Figure 2 shows the locations of the occipital, temporal, parietal, and frontal lobes of the cerebral cortex. The occipital lobe is the location of the visual cortex in the mammalian brain.
Fig.1
EasyCap electrode cap viewed posteriorly. Electrodes Pz, O1, and O2 can be seen.
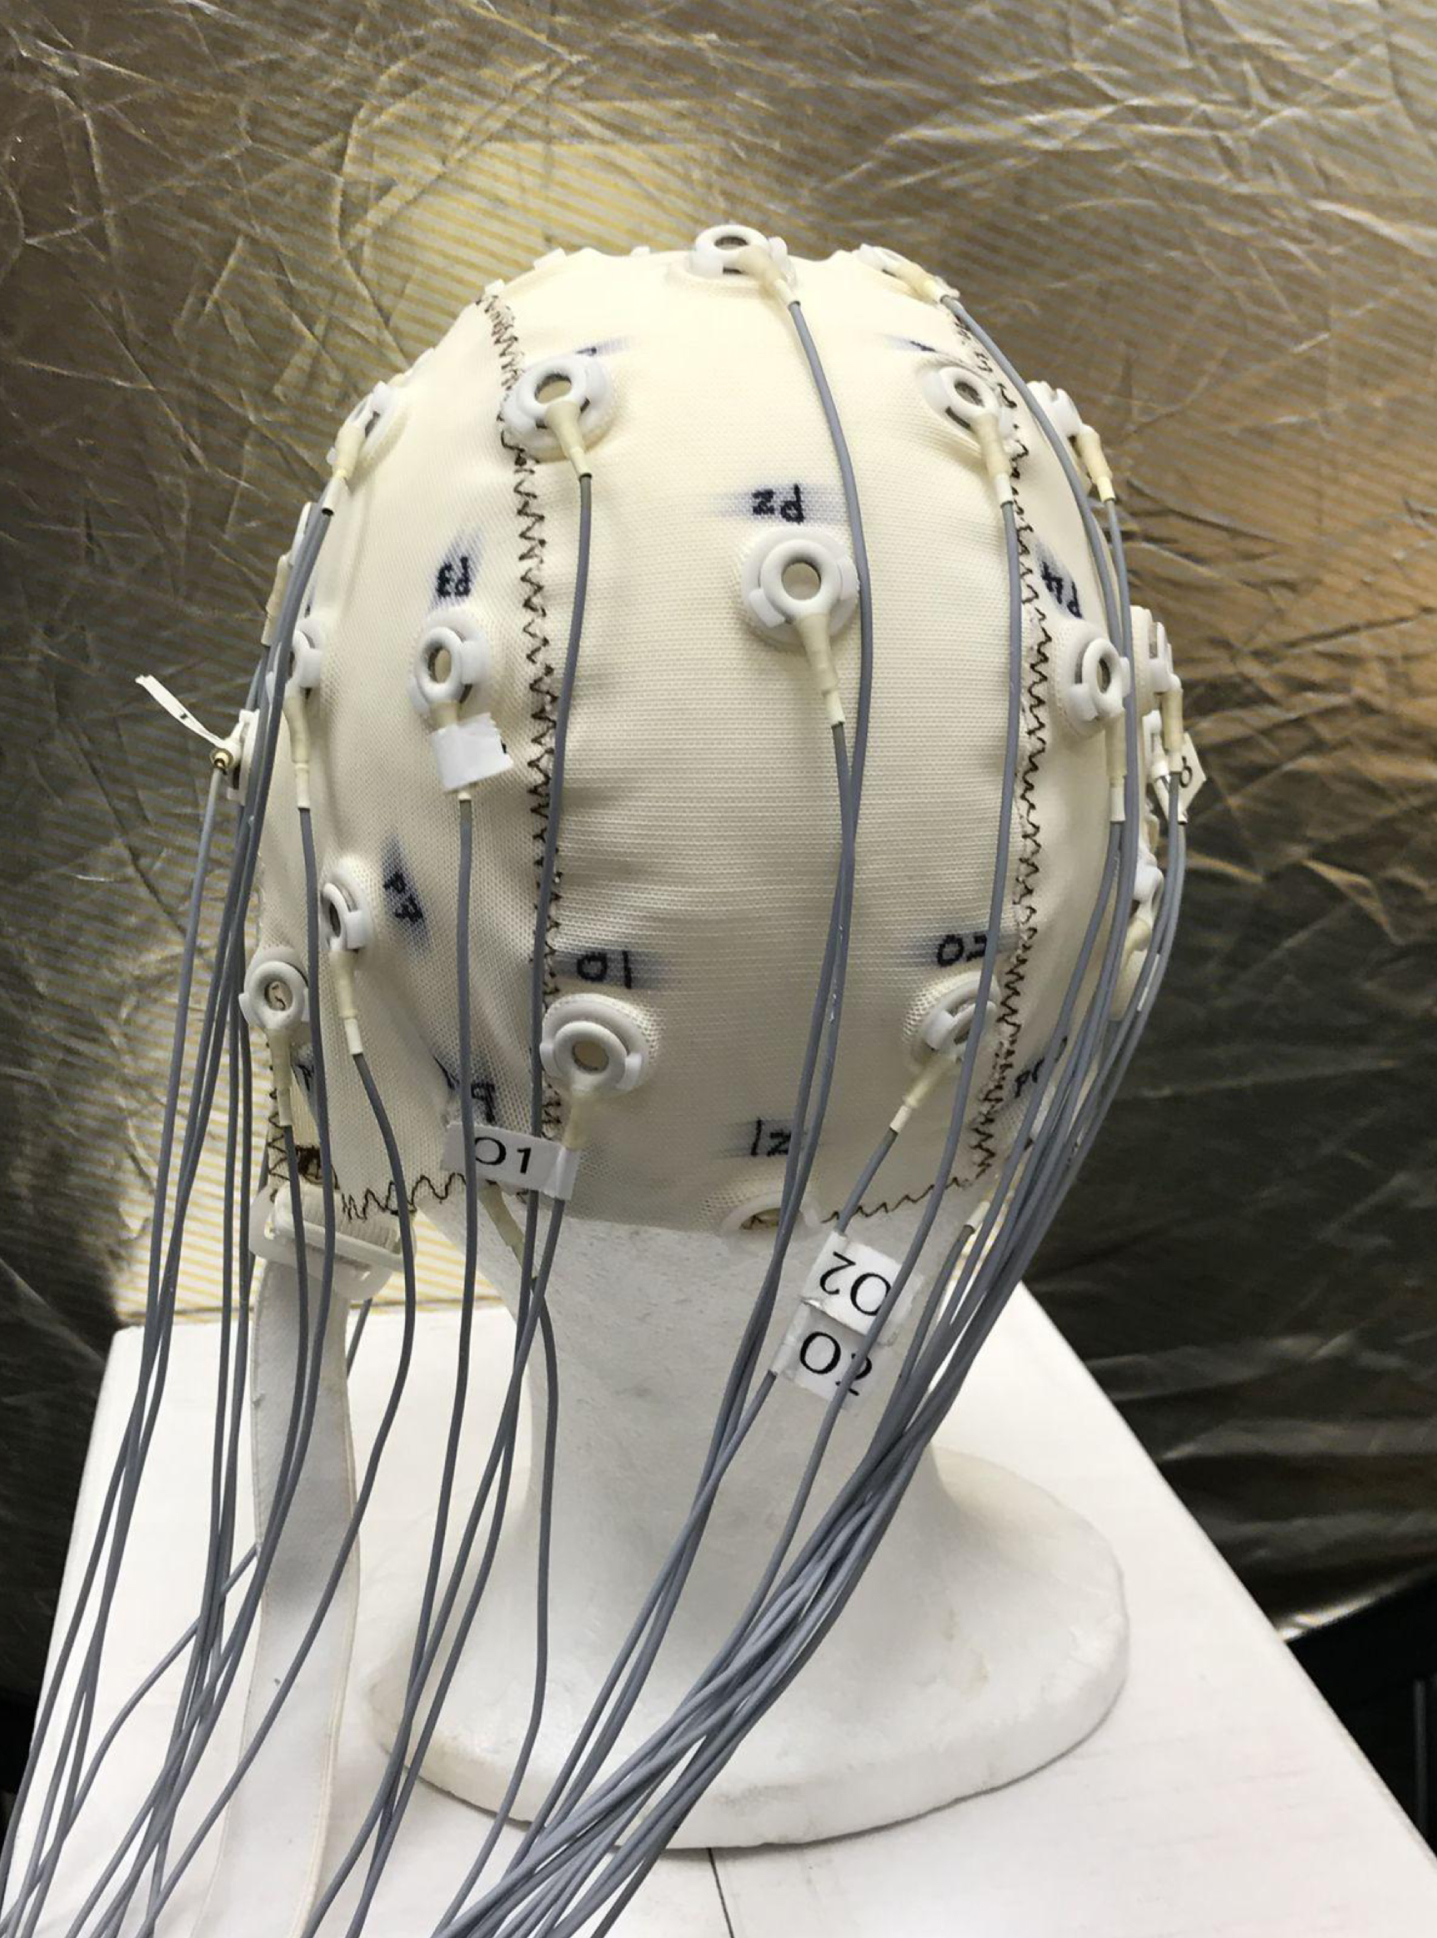
Fig.2
Cerebral cortex showing locations of the occipital, temporal, parietal, and frontal lobes of the cortex [30].
![Cerebral cortex showing locations of the occipital, temporal, parietal, and frontal lobes of the cortex [30].](https://content.iospress.com:443/media/jad/2019/70-1/jad-70-1-jad190299/jad-70-jad190299-g002.jpg)
Stimulus protocol and measurement procedure
An initial baseline (without a stimulus in a darkened EEG laboratory) was recorded for approximately 30 s for each of the healthy volunteer participants. EEG data was then recorded during exposure to the white light LED stimuli, centered in the field of view and placed approximately 30 cm in front of the participant. The stimuli, flickering at one of 40 Hz, 60 Hz, or 80 Hz, at either high or low light intensity values, were presented in a random order to aid in reducing systematic effects. Hence, 6 test stimuli were used, each recorded for approximately 30 s, and separated by a period of baseline (no stimuli) conditions. These recordings were taken for an eyes-open condition with the participant asked not to blink if possible. The request not to blink was made in an attempt to have as uniform as possible EEG recordings across participants, removing the potential confounder of random blink occurrence between participants.
As discussed in the introduction, the literature suggests that the 40 Hz frequency point may be of particular significance; however, other frequencies have not been thoroughly investigated. Stimulating at frequencies other than 40 Hz and analyzing the results could act as controls to verify the significance of the 40 Hz frequency point. Therefore, EEG data was recorded at 40 Hz, 60 Hz, and 80 Hz to check whether any steady state response achieved was maximal at 40 Hz. 80 Hz was used because it is a harmonic of 40 Hz and 60 Hz is intermediate between 40 Hz and 80 Hz.
Once the data was recorded, it was examined using independent component analysis. Independent component analysis is a computational method which can be used to perform blind source separation of linearly mixed independent components (ICs), or sources, such as EEG data. To produce n stable components, it is recommended that more than k × n2 samples are required for a good IC decomposition, where k is 30 for n = 32 [31]. For a sampling rate of 1000 Hz and an n = 32 channel EEG setup, this evaluates to 30.72 s. Therefore, a recording time of approximately 30 s was chosen as a compromise between having sufficient data for a good independent component analysis decomposition and participant ability to keep their eyes open without blinking.
Most of the EEG data recorded in this study was for an eyes-open condition with the participant asked not to blink if possible. However, some additional EEG data was recorded while the participants had their eyes closed. This data was taken with the high intensity 40 Hz stimulus only. This latter data was taken to help show that the response obtained at the electrodes originated in the participants’ brains rather than being due to electrical interference from the light stimulus since in both eyes-open and eyes-closed conditions the stimulus was the same yet the response was different. Had the response been due to the stimulus, rather than originating in the brain, then the data would have been the same in both cases.
Analysis
EEGLAB software was used to analyze the data. Power spectral density plots (PSD) of EEG signals were made for each of the stimuli conditions to ascertain whether there was a steady state response at the stimulus frequency or at harmonics thereof.
The study reported in [32] highlighted that electromyogram (EMG) signals from muscles can contaminate EEG signals in the gamma band range. In that work, an algorithm was developed to enable automatic removal of ICs associated with muscle activity from EEG signals so that cortical activity is kept, augmented, or uncovered. Since brain and muscle ICs tend to have negative and positive slopes, respectively, this algorithm is based on fitting a straight line to plots of log10 Power ((uV)2/Hz) versus log10 Frequency (Hz) for each IC and thresholding on the slope of the line. MATLAB code was written to carry out this algorithm for EMG contamination removal on the data presented in this paper with the RUNICA algorithm [33] used to perform the IC decomposition. A slope threshold of –0.72 was chosen to match one of the thresholds used in [32].
RESULTS AND DISCUSSION
In this section, the main findings from our three case studies are presented and discussed.
Is there a steady state entrainment response?
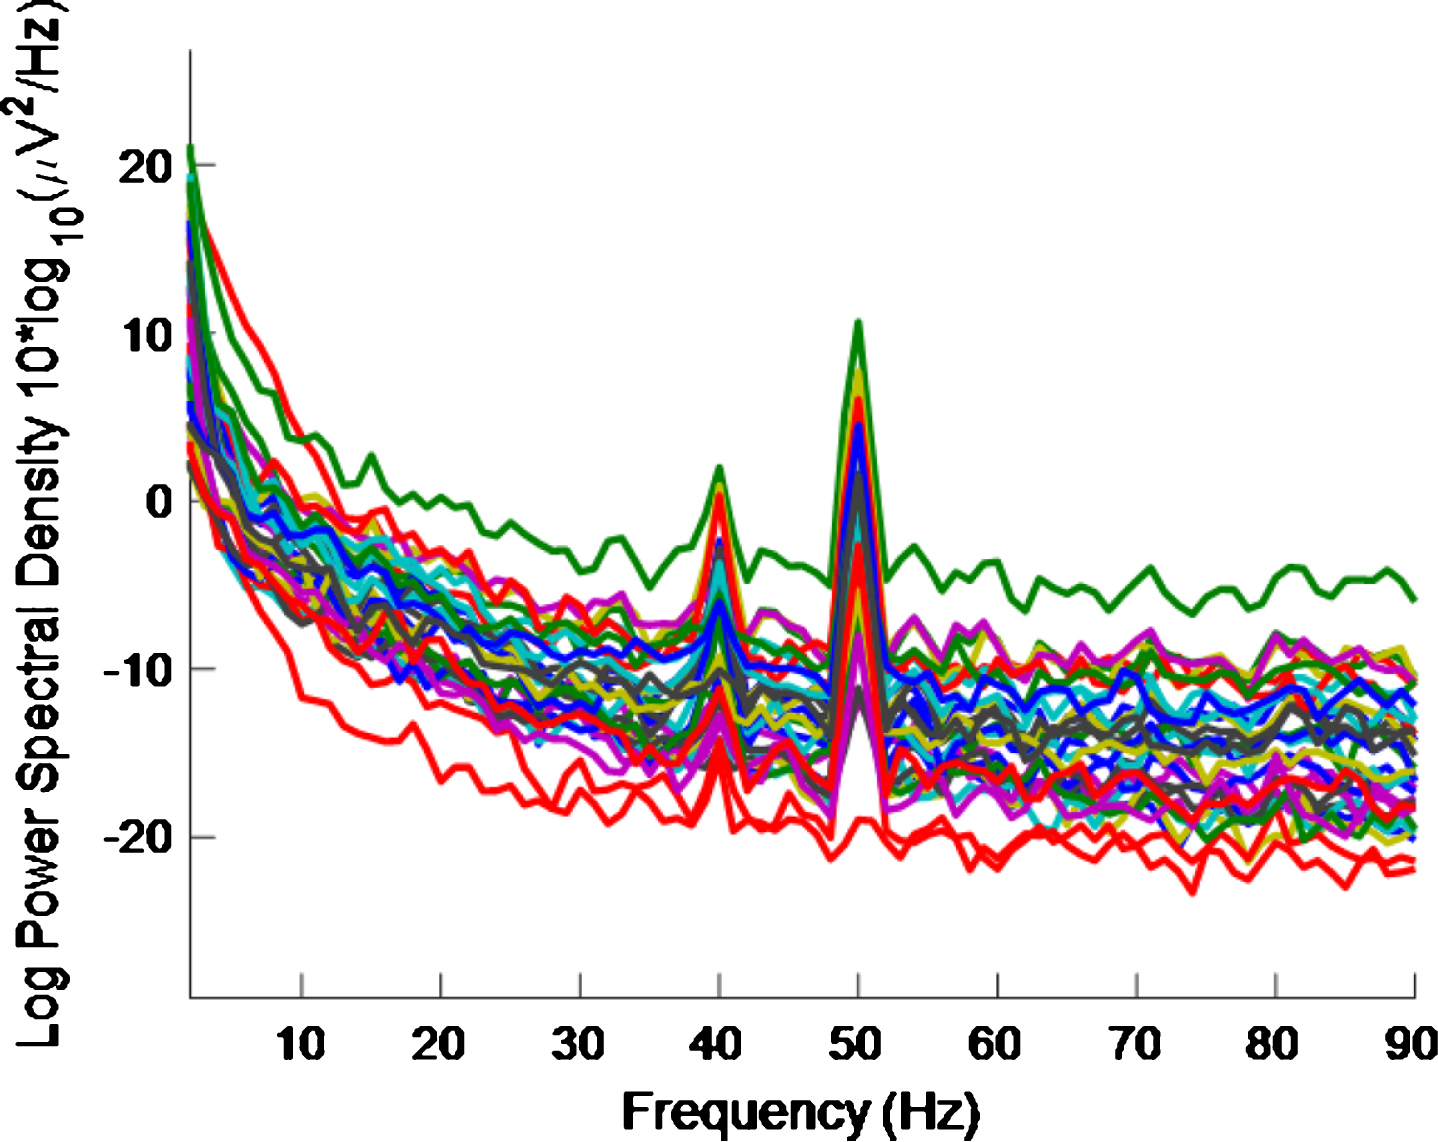
Figure 3 shows the PSD for the baseline condition, prior to the high intensity 40 Hz stimulus, for healthy volunteer 3, with one trace shown for each of the 32 electrodes, where no peaks can be seen at 40 Hz, as expected. This baseline PSD contrasts with the PSD shown in Fig. 4, which is for a high intensity 40 Hz stimulus, also for healthy volunteer 3. The peaks at 40 Hz in Fig. 4 demonstrate that the stimulus has generated a clear steady state entrainment response. Similar 40 Hz responses were found for the other two healthy volunteers. These will be further discussed in the following sections.
Fig.3
PSD for baseline conditions for healthy volunteer 3. There is one trace for each electrode. No 40 Hz entrainment is evident, as expected.
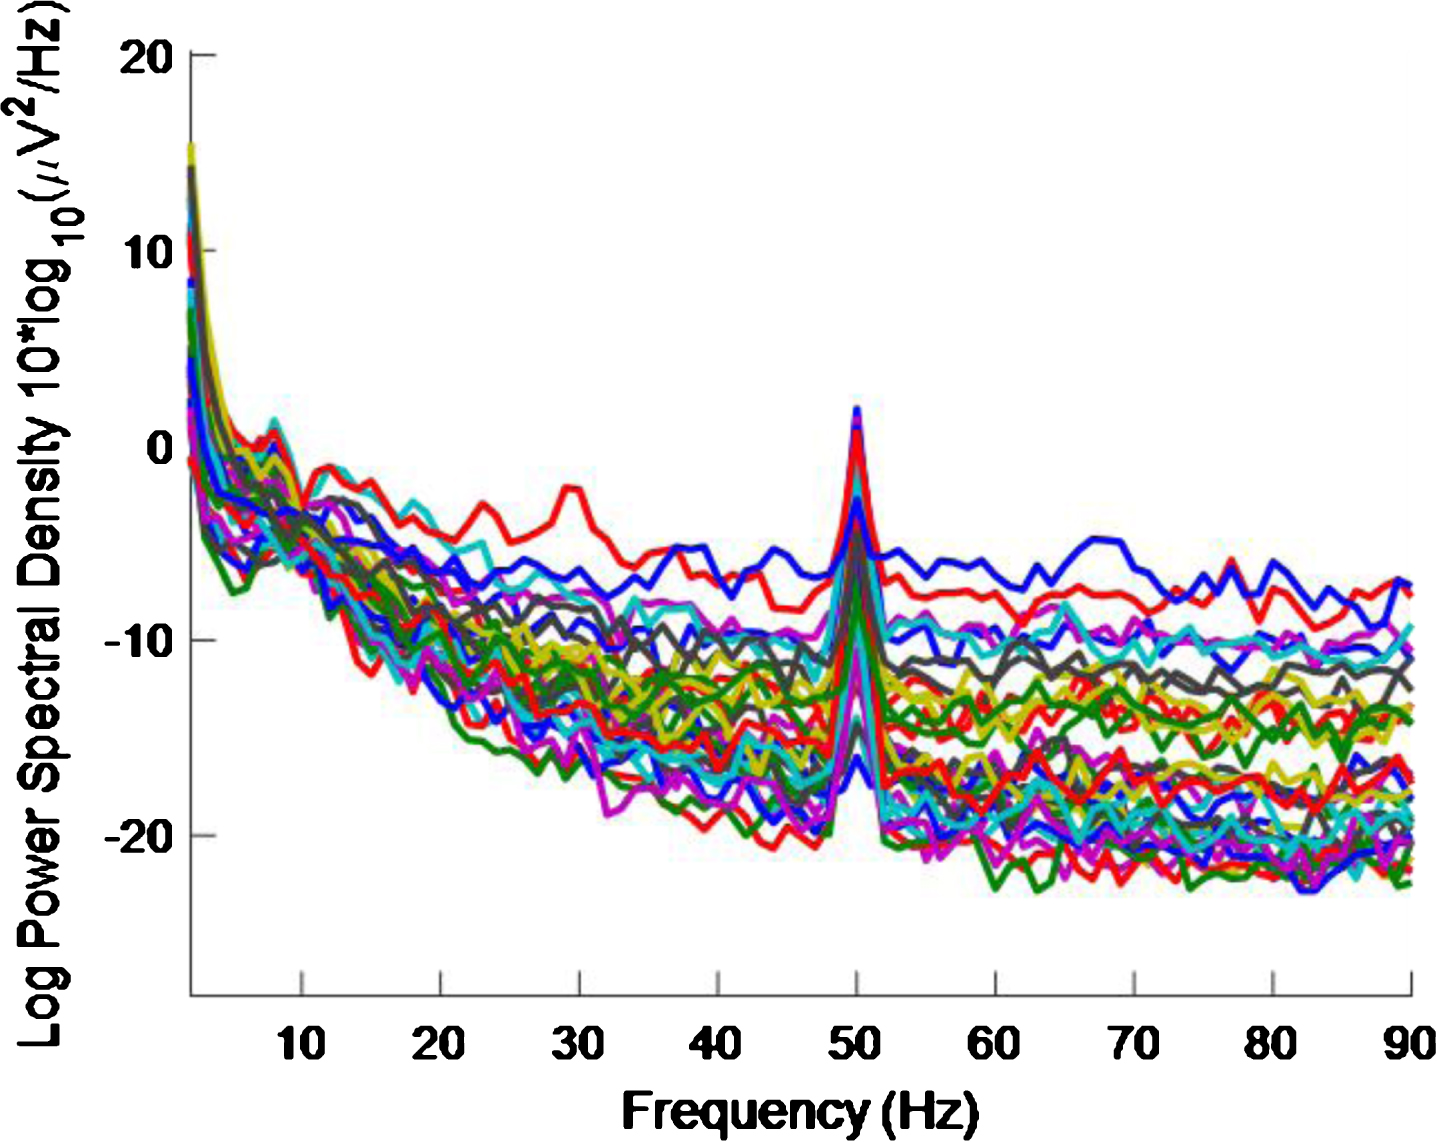
Fig.4
PSD for high intensity 40 Hz stimulus for healthy volunteer 3. There is one trace for each electrode. A 40 Hz response is evident.
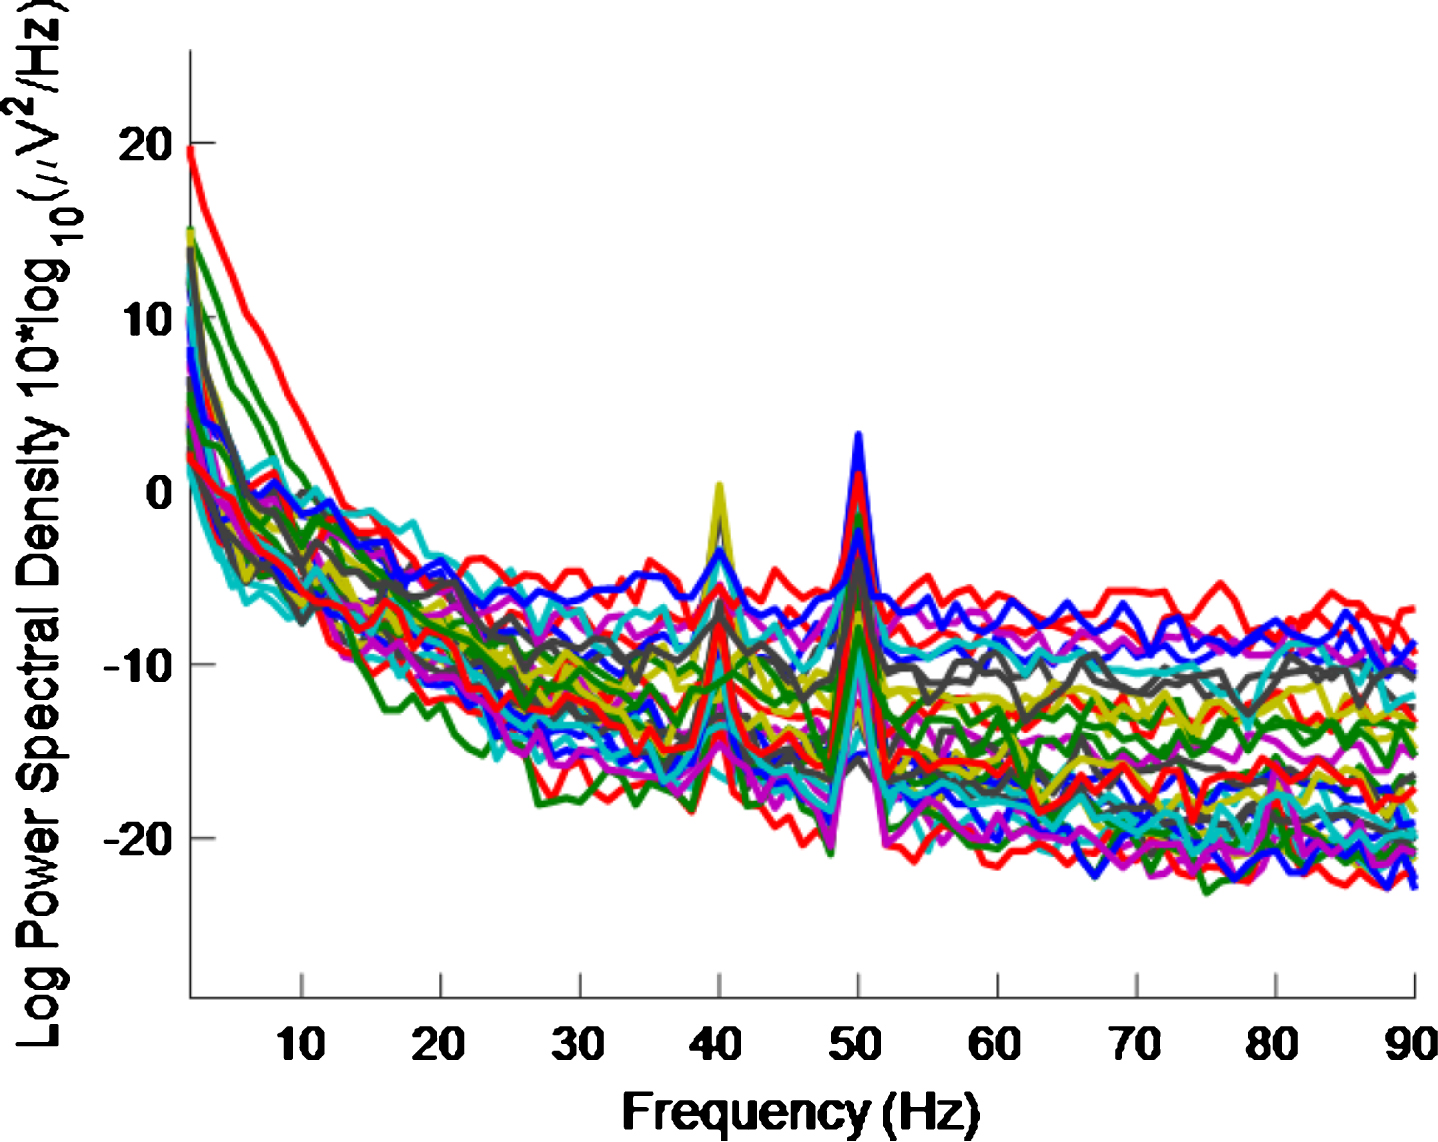
The 50 Hz peaks in both Figs. 3 and 4 are due to electrical line interference. No attempt is made to filter out the 50 Hz noise as filtering can introduce artefacts and the 40 Hz response can be clearly seen in Fig. 4 without its removal. There is a precedent for not removing the 50 Hz interference [32] though in that case the power was simply not plotted between 49 Hz–51 Hz.
Quantifying the response
To quantify the 40 Hz response, the height of the peak at 40 Hz above the average PSD in the 25 Hz–45 Hz range was calculated for each electrode in the PSD plots. This range was chosen because it is above the neural oscillation alpha brainwave peak, which is typically found at approximately 10 Hz [34], and below the 50 Hz line interference. If the amplitude of the 40 Hz peak minus the average PSD in this range exceeded an empirically chosen threshold of 1, then an entrainment response to the stimulus at that electrode was judged to have occurred. A similar metric to this entrainment exceeding threshold (EET) metric was used to quantify the 60 Hz and 80 Hz responses, again with a threshold of 1, except that in these cases the average PSD ranges used were 55 Hz–75 Hz and 75 Hz–95 Hz, respectively. Three separate ranges were used, rather than one range of 25 Hz–95 Hz, as the human EEG curve is approximately proportional to a 1/f curve [32]. Hence, adopting a single range would result in a higher likelihood of 40 Hz peaks exceeding the threshold than 60 Hz or 80 Hz peaks.
Effect of altering frequency and inter-individual variability
The number of electrodes demonstrating entrainment for each of the healthy volunteers, measured using the EET metric, are reported in Table 1 for each stimulus condition. This table also indicates the average number of electrodes demonstrating entrainment across all subjects for each stimulus. For low intensities, the average number of electrodes demonstrating entrainment go from an average of 14 to 6 to 4 at stimulus frequency of 40 Hz, 60 Hz, and 80 Hz, respectively. Similarly, for high intensities, the numbers of electrodes demonstrating entrainment go from an average of 18 to 16 to 3 as the frequency changes from 40 Hz to 60 Hz to 80 Hz. Therefore, the 40 Hz stimulus produces the greatest average response of the three frequencies.
Table 1
Number of electrodes demonstrating entrainment for each of the healthy volunteers (HV1-3), and rounded average number of electrodes, demonstrating entrainment at 3 different frequencies and 2 different intensities. From the rightmost column it can be seen that that the 40 Hz stimuli cause more entrainment than 60 Hz or 80 Hz. High intensity stimuli cause more entrainment than low intensity stimuli at 40 Hz and 60 Hz
| Freq. | Intensity | No. for HV1 | No. for HV2 | No. for HV3 | Average No. |
| 40 | Low | 18 | 8 | 15 | 14 |
| 40 | High | 19 | 11 | 24 | 18 |
| 60 | Low | 7 | 8 | 4 | 6 |
| 60 | High | 15 | 18 | 14 | 16 |
| 80 | Low | 8 | 1 | 2 | 4 |
| 80 | High | 2 | 6 | 2 | 3 |
For individual participants, with the exception of the two 60 Hz intensity responses for healthy volunteer 2, the responses again demonstrate that the 40 Hz stimuli produces the greatest responses of the three frequencies.
It is interesting to note the inter-individual variability in response to the same stimuli. A medical device to treat AD will need to be able to accommodate such variability.
Effect of altering intensity
Table 1 indicates, for both individual participants and for the average response that at 40 Hz, the number of electrodes entrained increases with increasing intensity of stimulus. The number of electrodes entrained, for both individual participants and for the average response, also increases with increasing intensity at 60 Hz stimulation but not for 80 Hz stimulation. Future work could investigate if the responses at 40 Hz increase further with further increases in stimulus intensity.
Largest amplitudes in primary visual cortex
The amplitude of the peaks is also found to be larger for the high intensity 40 Hz stimulus than for the low intensity 40 Hz stimulus. Due to this result and the results about altering frequency and intensity, it appears that the high intensity 40 Hz stimulus produces the greatest response overall. Therefore, most emphasis will be placed on this frequency and intensity combination in the following analysis.
Using a high intensity 40 Hz stimulus, the 40 Hz peaks with the highest amplitudes, consistently across the 3 participants, are at electrode positions Pz, O1, and O2. These electrode positions can be seen in Fig. 1. Occipital electrodes O1 and O2 are the closest 10–20 system electrodes to the primary visual cortex/V1/Brodmann area 17 [35]. According to [36], this anatomical region is the first part of the visual cortex to receive incoming visual signals and so activation of these occipital lobe electrodes is probably not an unexpected result.
Widespread response
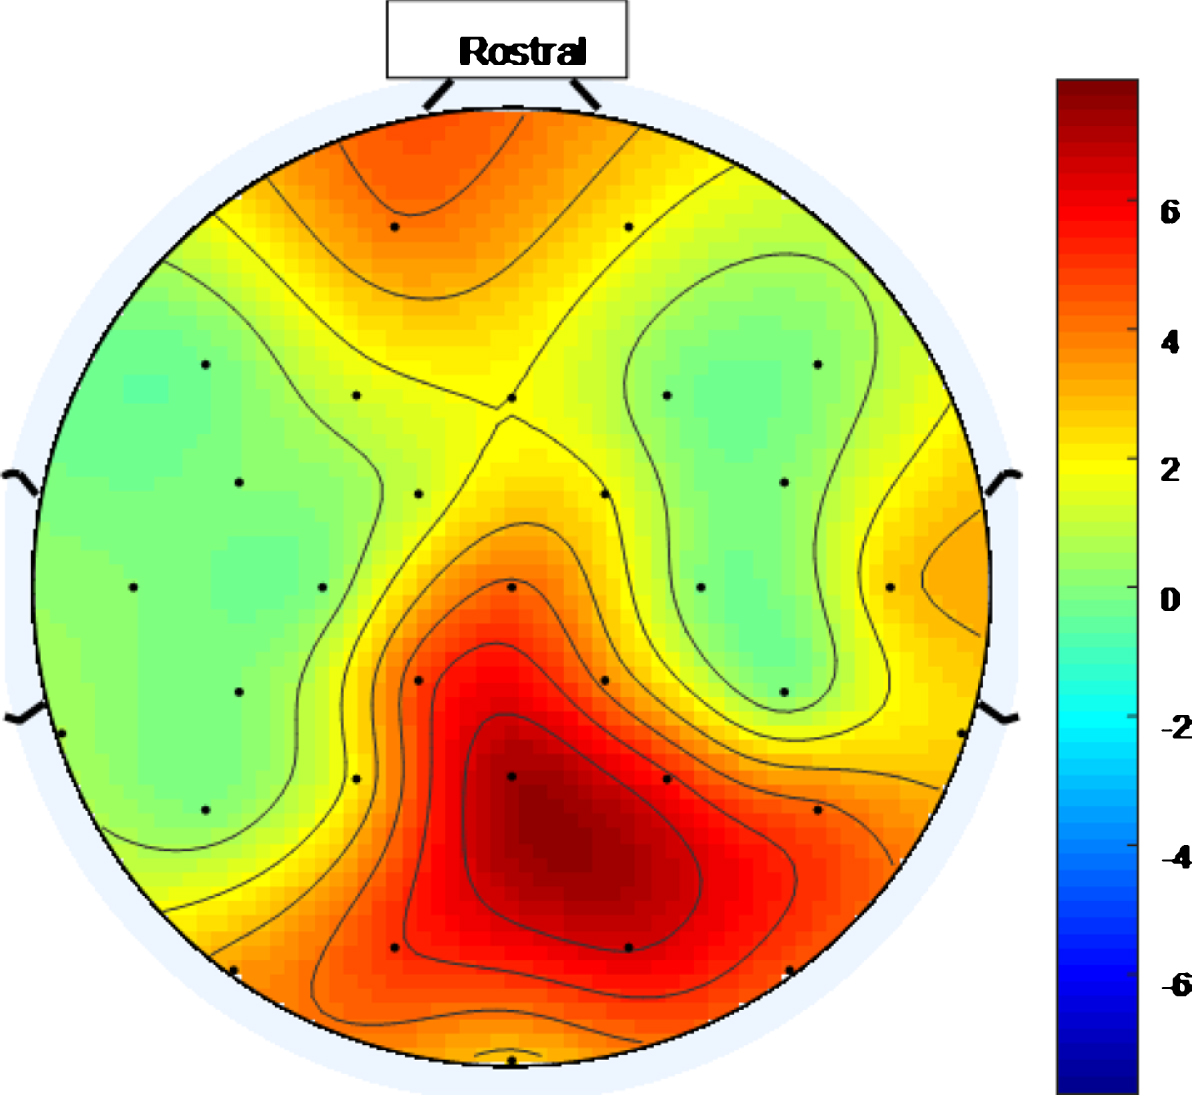
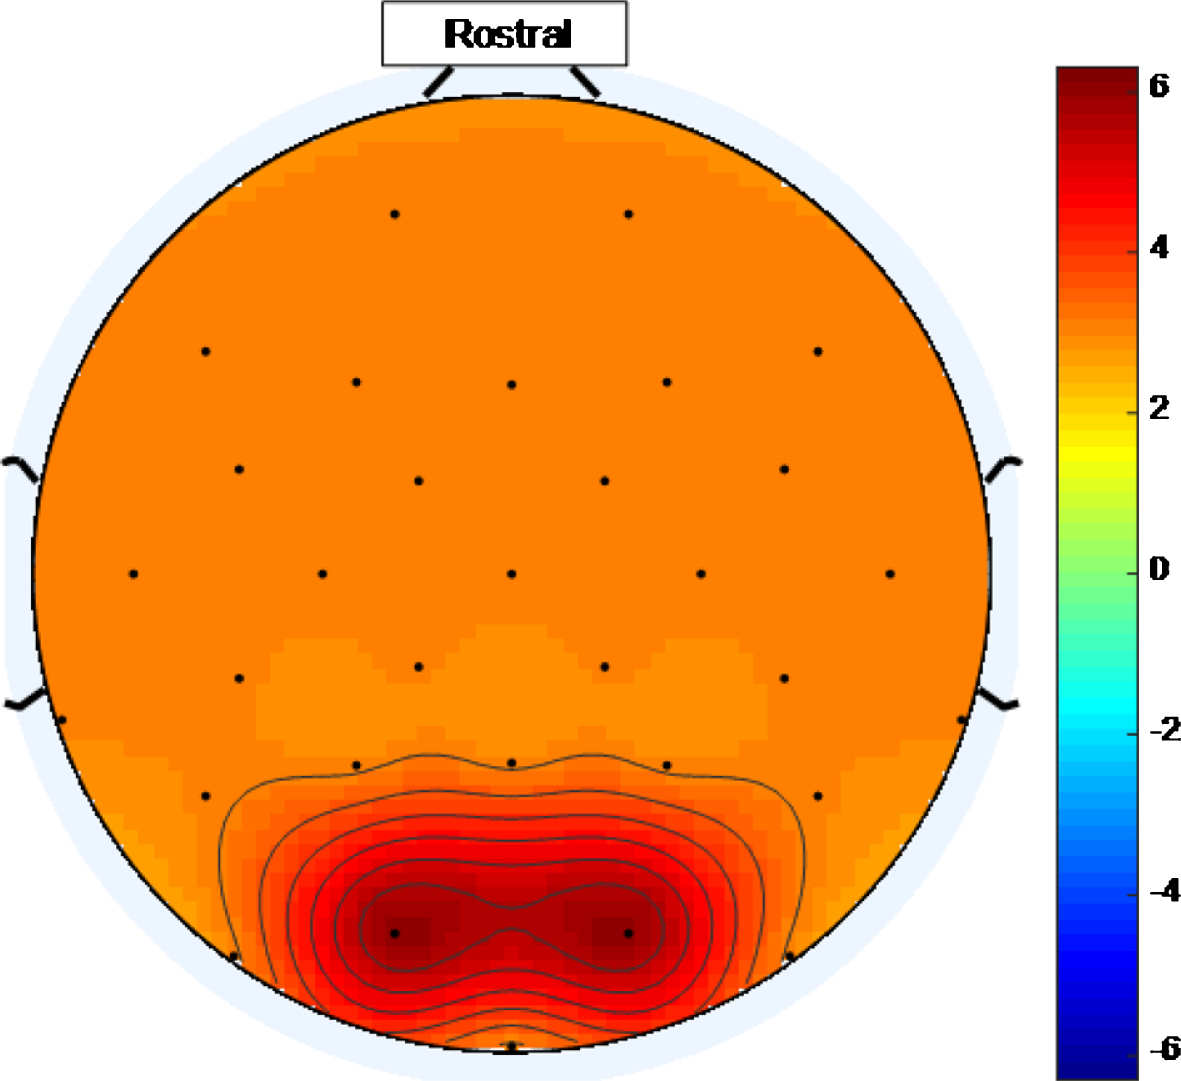
There is a widespread response to the 40 Hz stimulus with between approximately 34.4% and 75% (and an average of 56.3%) of the electrodes showing entrainment for the high intensity setting. To help visualize this widespread response, Figs. 5 and 6 are scalp maps showing the distribution of entrainment response for low and high intensity 40 Hz stimuli respectively, both for healthy volunteer 1. The rostral position (nose region) is to the top of the figure in both cases. The approximate locations of the EEG electrodes are represented by black discs. In these figures, the color scale represents the EET metric values discussed in the results section, so that values that are higher on the color scale have 40 Hz peaks that are higher above the average PSD value in the 25 Hz–45 Hz range. As can be seen from Figs. 5 and 6, the response to the high intensity 40 Hz light stimulus is widespread over the cortex with highest amplitude peaks towards the posterior of the head for both intensity values and with electrodes in the ocular region also demonstrating entrainment for the higher intensity stimulus. Such a widespread response bodes well for a medical device, that uses this type of stimulus, to treat the cortically widespread disease that is AD [25].
Fig.5
Scalp map for low intensity 40 Hz stimulus for healthy volunteer 1. Areas represented by colors above 0 on the color bar represent a 40 Hz entrainment response with values that are higher on the color scale having 40 Hz peaks that are higher above the average PSD value in the 25 Hz–45 Hz range.
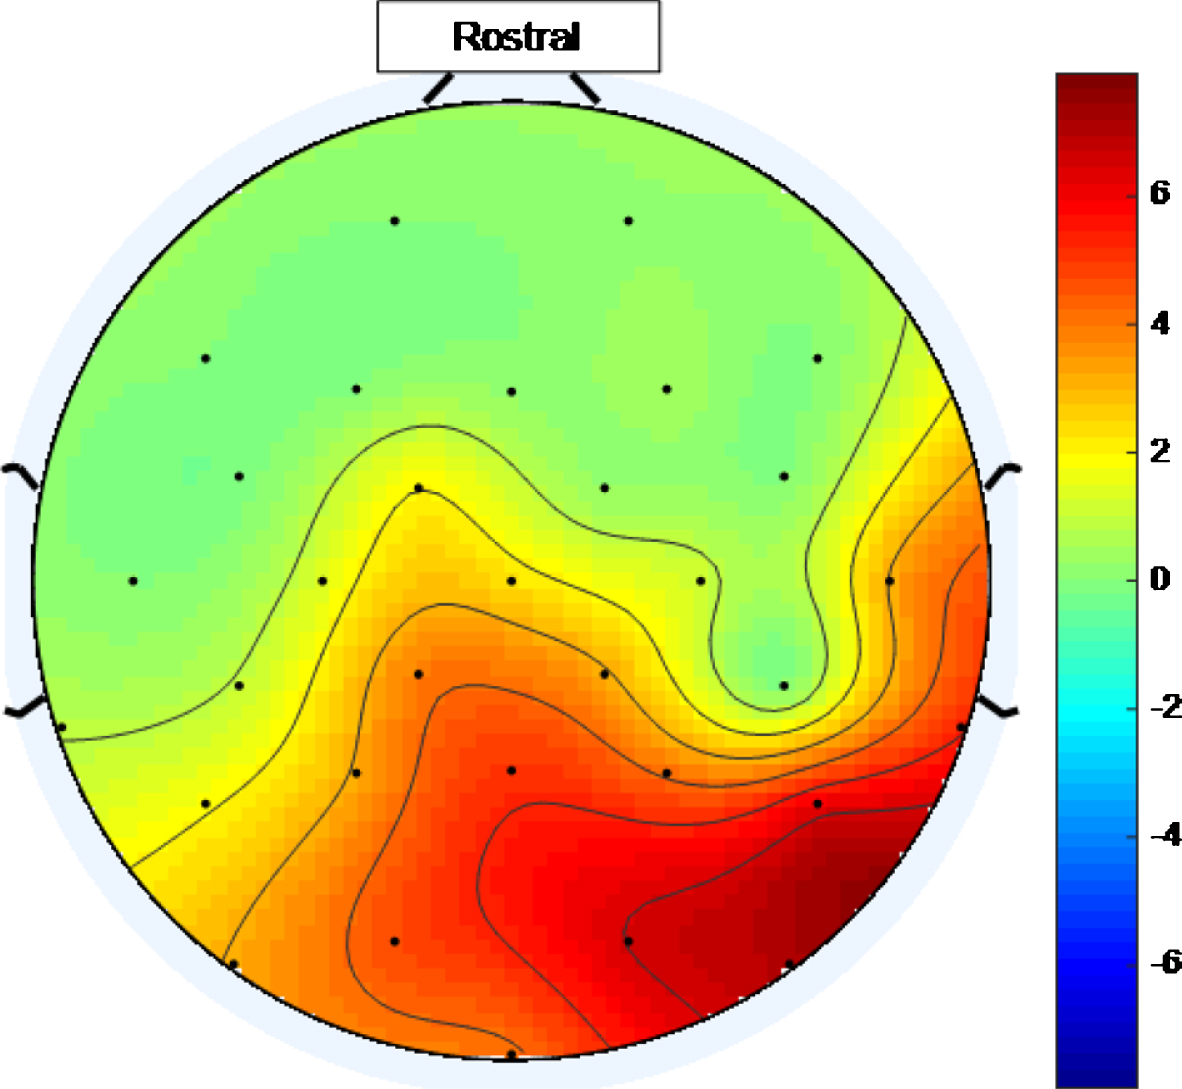
Fig.6
Scalp map for high intensity 40 Hz stimulus for healthy volunteer 1. Areas represented by colors above 0 on the color bar represent a 40 Hz entrainment response with values that are higher on the color scale having 40 Hz peaks that are higher above the average PSD value in the 25 Hz–45 Hz range.
Impacts of EMG contamination removal
In this work, 40 Hz peaks can be seen even without EMG contamination removal, such as in Fig. 4. The fact that it is not necessary to remove EMG contamination in order to see the 40 Hz peaks is in contrast to the situation in [32] where, even for the occipital lobe electrode along the midline sagittal plane of the skull, Oz, (where the response would be expected to be large since the occipital lobe is the visual processing center in the mammalian brain), the response only became evident after removal of EMG-contaminated signals. (In the study presented in this paper there was no Oz electrode.) In the study reported in [37], it is noted that visual cortex activation in the eyes-open rest condition is bigger than in the eyes-closed rest condition and that ocular motor structure activations were smaller in the eyes-open rest condition than in the eyes-closed rest condition. This means that, with a 40 Hz light stimulus, using an eyes-open protocol would produce a larger 40 Hz brain response and a smaller 40 Hz EMG contamination response than would be the case were an eyes-closed protocol used. Therefore, the reason why there was no need to remove EMG-contamination for the 40 Hz entrainment to be apparent in this study may, at least in part, be because the work presented in this part of the paper uses an eyes-open protocol while that in [32] used an eyes-closed convention.
As discussed in the analysis subsection of the methodology section, it was reported in [32] that electromyogram (EMG) signals from muscles can contaminate EEG signals in the gamma band range. To provide evidence that the EEG signals being recorded in this study are originating in the brain, rather than being of muscular origin, the EMG contamination removal method proposed in [32] was applied to the high intensity 40 Hz data.
The results can be seen in Table 2. In this table, EMG contamination removal enhances the 40 Hz peaks for healthy volunteer 1, while for healthy volunteer 2 and healthy volunteer 3, the number of entrained electrodes is similar before and after EMG contamination removal, with healthy volunteer 2 having one less and healthy volunteer 3 having 3 more electrodes demonstrating entrainment after removal.
Table 2
Number of electrodes demonstrating entrainment for each of the healthy volunteers (HV1-3), using high intensity 40 Hz stimulus, before and after EMG contamination removal. Since there is 40 Hz entrainment before EMG contamination removal, EMG contamination removal is not necessary
| EMG Removal State | No. for HV1 | No. for HV2 | No. for HV3 |
| Before | 19 | 11 | 24 |
| After | 31 | 10 | 27 |
Figure 7 shows the PSD plot, after removal of EMG contamination for healthy volunteer 3. This plot can be compared to Fig. 4 which is for the same healthy volunteer before removal of EMG contamination. A high intensity 40 Hz stimulus was used for both Figs. 4 and 7 cases.
Fig.7
PSD using a high intensity 40 Hz stimulus for healthy volunteer 3 after EMG contamination removal. 40 Hz response is enhanced compared to Fig. 4, which is for a high intensity 40 Hz stimulus for healthy volunteer 3 where EMG contamination removal has not been done.
Since in the cases of all three healthy volunteers the 40 Hz peaks are obvious by visual inspection of the data, before EMG contamination removal, and with the caveat that the sample size is small, this indicates that EMG contamination removal, while sometimes beneficial, may not be necessary for the set-up used in this study. This outcome may be due to the fact that an eyes-open protocol was used in combination with a high intensity source being placed ∼30 cm from the participant.
Intra-individual variability
It is interesting to note that there is also intra-individual variability when using this stimulus, i.e., even using the same high intensity 40 Hz stimulus twice on the same participant, the locations of the electrodes showing entrainment varies. For example, repeating the 40 Hz high intensity stimulus for healthy volunteer 2, over two runs, 9 and 11 electrodes demonstrated entrainment, respectively. The locations of 8 of these electrodes were the same for both runs. There were 3 electrodes demonstrating entrainment for the second run that did not demonstrate entrainment in the first run and one electrode demonstrating entrainment for the first run that did not demonstrate entrainment in the second run. Future work, using more than 2 repetitions of the same stimulus, is necessary to check whether this variation falls within normal experimental random variation. However, some of this variation may have been caused by the fact that the volunteer blinked twice during the first run of the stimulus and did not blink during the second run of the stimulus.
Harmonics
Table 3 shows that for the high intensity 40 Hz stimulus an entrainment response at 80 Hz is also produced for all three participants. The average number of electrodes demonstrating this response at double the 40 Hz frequency (80 Hz harmonic) is 10 whereas, at the 40 Hz frequency, the average number of electrodes demonstrating entrainment is 18.
Table 3
Number of electrodes demonstrating entrainment for each of the healthy volunteers (HV1-3), and rounded average number of electrodes demonstrating entrainment, using high intensity 40 Hz stimulus, at 40 Hz fundamental and at 80 Hz harmonic. On average, there is more entrainment for the fundamental than the harmonic frequency
| Freq. (Hz) | No. for HV1 | No. for HV2 | No. for HV3 | Rounded Average No. |
| 40 | 19 | 11 | 24 | 18 |
| 80 | 9 | 11 | 10 | 10 |
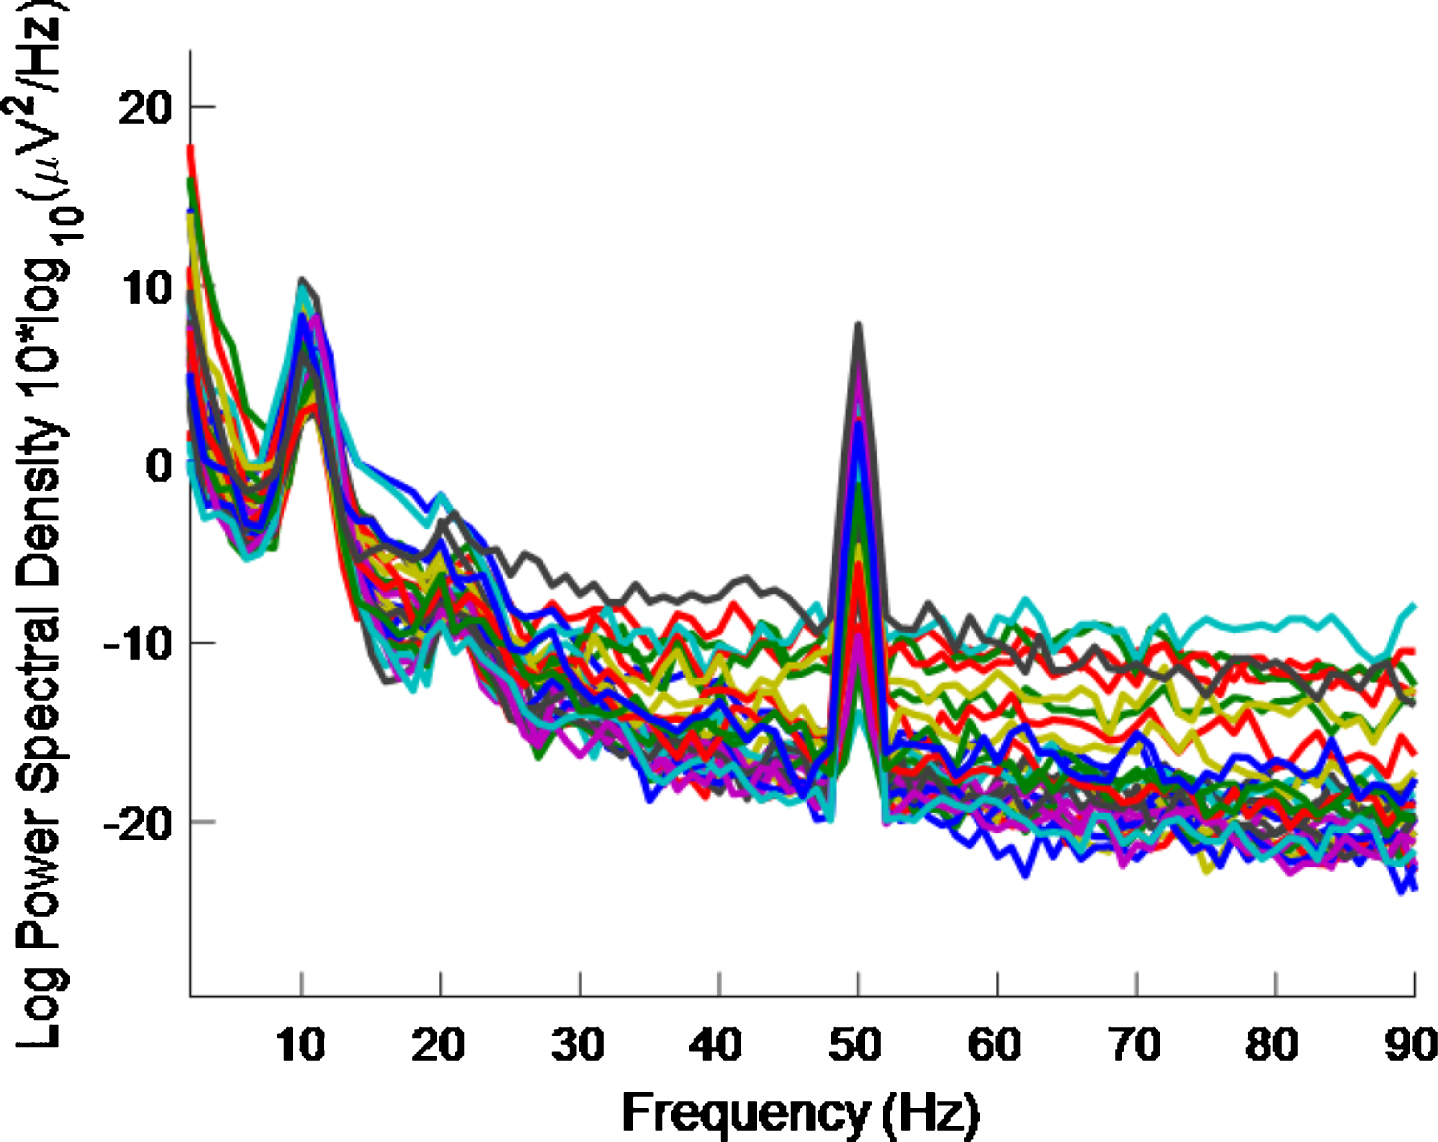
As regards half the frequency, for the high intensity 40 Hz stimulus, it is difficult to say whether or not there is entrainment at 20 Hz because (as well as the 10 Hz alpha peak, which is associated with an eyes-open condition and is more pronounced in an eyes-closed condition) there can be a 20 Hz peak in the PSD even without a 40 Hz stimulus [32]. There are also both 10 Hz and 20 Hz peaks in our data, where a high intensity 40 Hz stimulus was used, as can be seen in Figs. 8 and 9. The latter is for an eyes-closed condition and shows more pronounced peaks at 10 Hz and 20 Hz than in the former.
Fig.8
PSD eyes-open condition using a high intensity 40 Hz stimulus for healthy volunteer 2. There is more 40 Hz entrainment evident here than in Fig. 9 (which is for an eyes-closed condition).
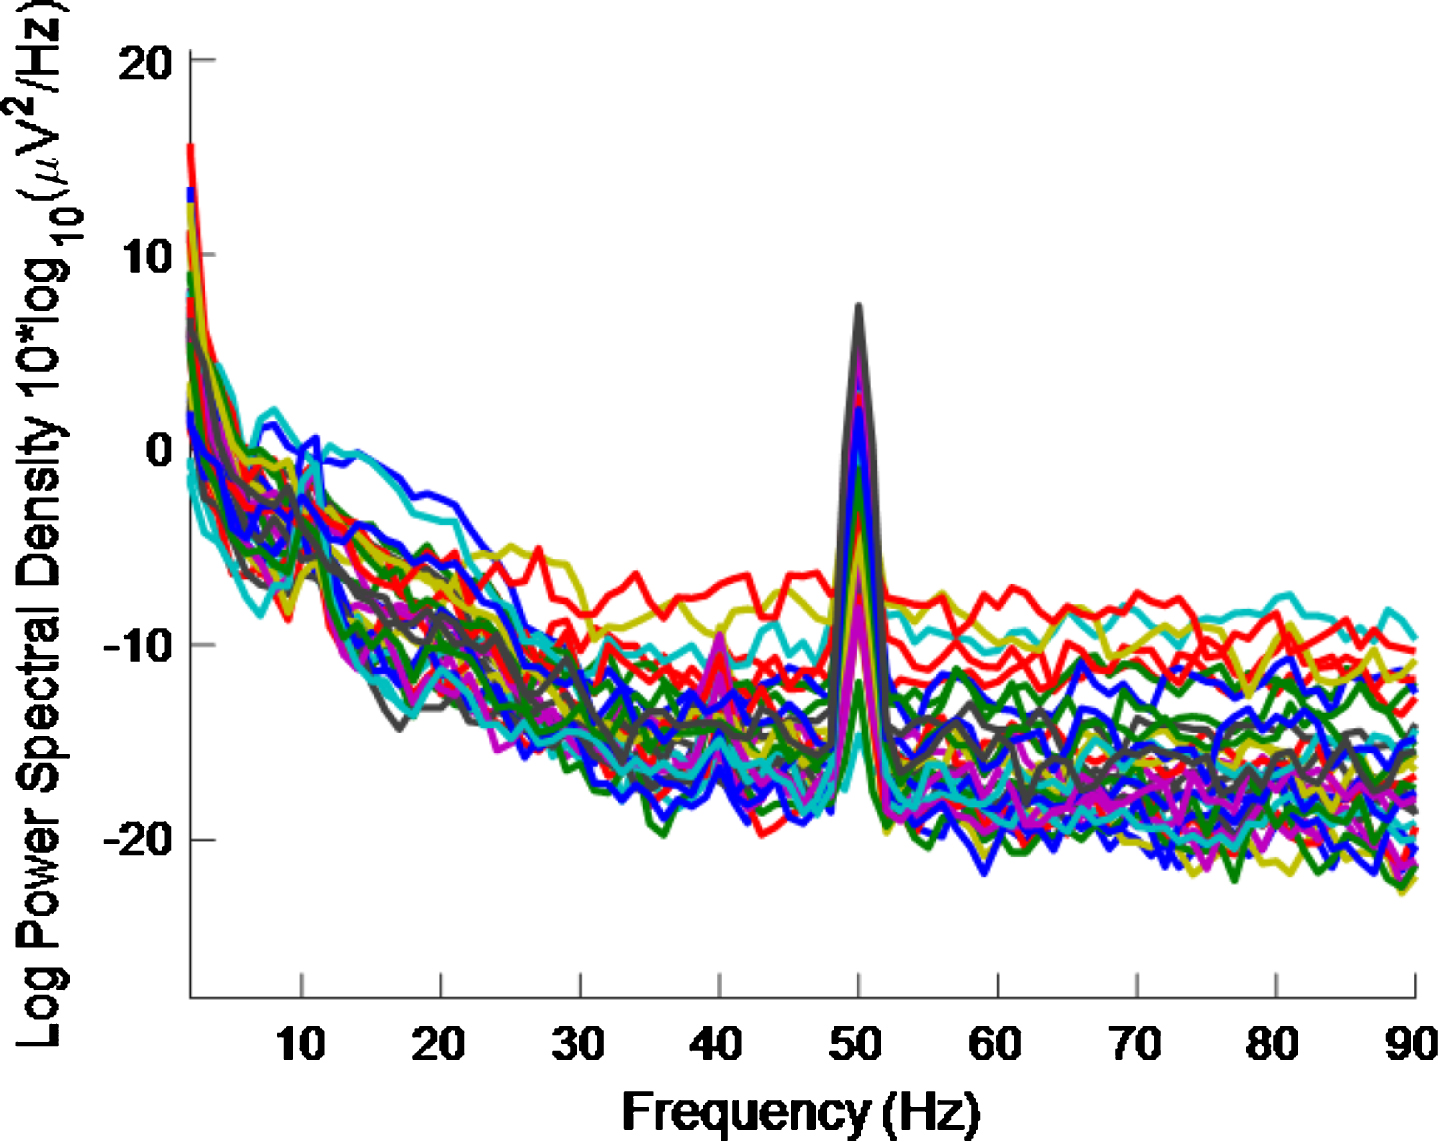
Fig.9
PSD eyes-closed condition using a high intensity 40 Hz stimulus for healthy volunteer 2. 10 Hz and 20 Hz peaks are evident. There is less 40 Hz entrainment evident here than in Fig. 8 (which is for an eyes-open condition).
Eyes-open, eyes-closed effect and electrical interference from the stimulus
In this section a comparison between an eyes-open and an eyes-closed protocol is made. The latter was used for several reasons: to see if treatment using a 40 Hz light stimulus should be done in an awake or a sleeping patient; to check if the 40 Hz EEG signals recorded are due to electrical interference at 40 Hz from the stimulus device; and to further compare the work presented in this study with that in [32].
By comparing Figs. 8 and 9, it is seen that there is less 40 Hz entrainment for the eyes-closed condition than for the eyes-open condition. It is difficult to gauge how much 40 Hz entrainment there is in Fig. 8 by visual inspection. However, this is quantified in Table 4.
Table 4
Number of electrodes demonstrating entrainment for healthy volunteers 2 and 3, and rounded average number of electrodes demonstrating entrainment, using high intensity 40 Hz stimulus, for eyes-open and eyes-closed conditions. The eyes-open condition causes more entrainment than the eyes-closed condition
| Eyes | No. for HV2 | No. For HV3 | Rounded Average No. |
| Open | 11 | 24 | 18 |
| Closed | 2 | 6 | 4 |
Table 4 shows that the number of electrodes demonstrating entrainment goes from 11 to 2 when going from the eyes-open to the eyes-closed condition for healthy volunteer 2. For healthy volunteer 3, the number entrained similarly goes from 24 to 6. Data was not recorded for the eye-closed condition in healthy volunteer 1.
The implication of this eyes-open eyes-closed result for developing a multisensory medical device to treat AD is that this high intensity 40 Hz stimulus would be much less effective if used on a patient when their eyes are closed. This effect means that treatment using such a device would probably be best done in an awake patient.
Since there is still some entrainment with the eyes-closed condition before removal of possible EMG contamination then the visual cortex activation explanation given in [37], discussed in the section about the impacts of EMG contamination removal, does not fully account for the difference between the results obtained in this paper and that in [32]. The difference between the two results may be due to differences in stimulus intensities used or to differences in the distance between stimulus and participant in the two different studies.
Since the same high intensity 40 Hz stimulus is used in both the eyes- open and closed cases in Figs. 8 and 9, respectively, this means that the EEG signals recorded are not due to the electrodes picking up electrical interference at 40 Hz from the stimulus device, but rather it points to the recorded EEG signals originating in the brain of our participants.
How long does it take for entrainment to occur?
Since it was concluded in the section about the impacts of EMG contamination removal that EMG contamination removal is not necessary for the set-up used in this work, we are no longer limited to using a minimum of ∼30 s of data necessary to obtain stable ICs. It is interesting, therefore, to explore how long it takes after stimulation is turned on for entrainment to occur. How long it typically takes for entrainment to happen is determined, here, by repeatedly reducing the amount of data analyzed for each volunteer and calculating the number of electrodes demonstrating entrainment for each time interval.
Table 5 shows the number of electrodes demonstrating entrainment for each of the healthy volunteers for different durations of recorded EEG data. The total recording lengths were 30.9 s, 30.7 s, and 30.7 s for volunteers 1, 2, and 3, respectively.
Table 5
Number of electrodes demonstrating entrainment for each of the healthy volunteers for different durations of recorded EEG data using a high intensity 40 Hz stimulus
| Recording Length (s) | No. for HV1 | No. for HV2 | No. for HV3 |
| ∼30 | 19 | 11 | 24 |
| 20 | 22 | 12 | 26 |
| 10 | 20 | 11 | 27 |
| 5 | 13 | 11 | 26 |
| 2 | 11 | 12 | 24 |
It is interesting to note, from Table 5, that 11, 12, and 24 electrodes demonstrate entrainment after only 2 s of high intensity 40 Hz stimulation for healthy volunteer 1, healthy volunteer 2, and healthy volunteer 3, respectively.
Also noteworthy is the fact that there is a reduction in the number of electrodes showing entrainment as recording length increases from 20 s to ∼30 s. A possible explanation for this reduction is that the healthy volunteers have become habituated to the stimulus. Further study is needed to investigate whether longer stimulus times increases the numbers of electrodes demonstrating entrainment.
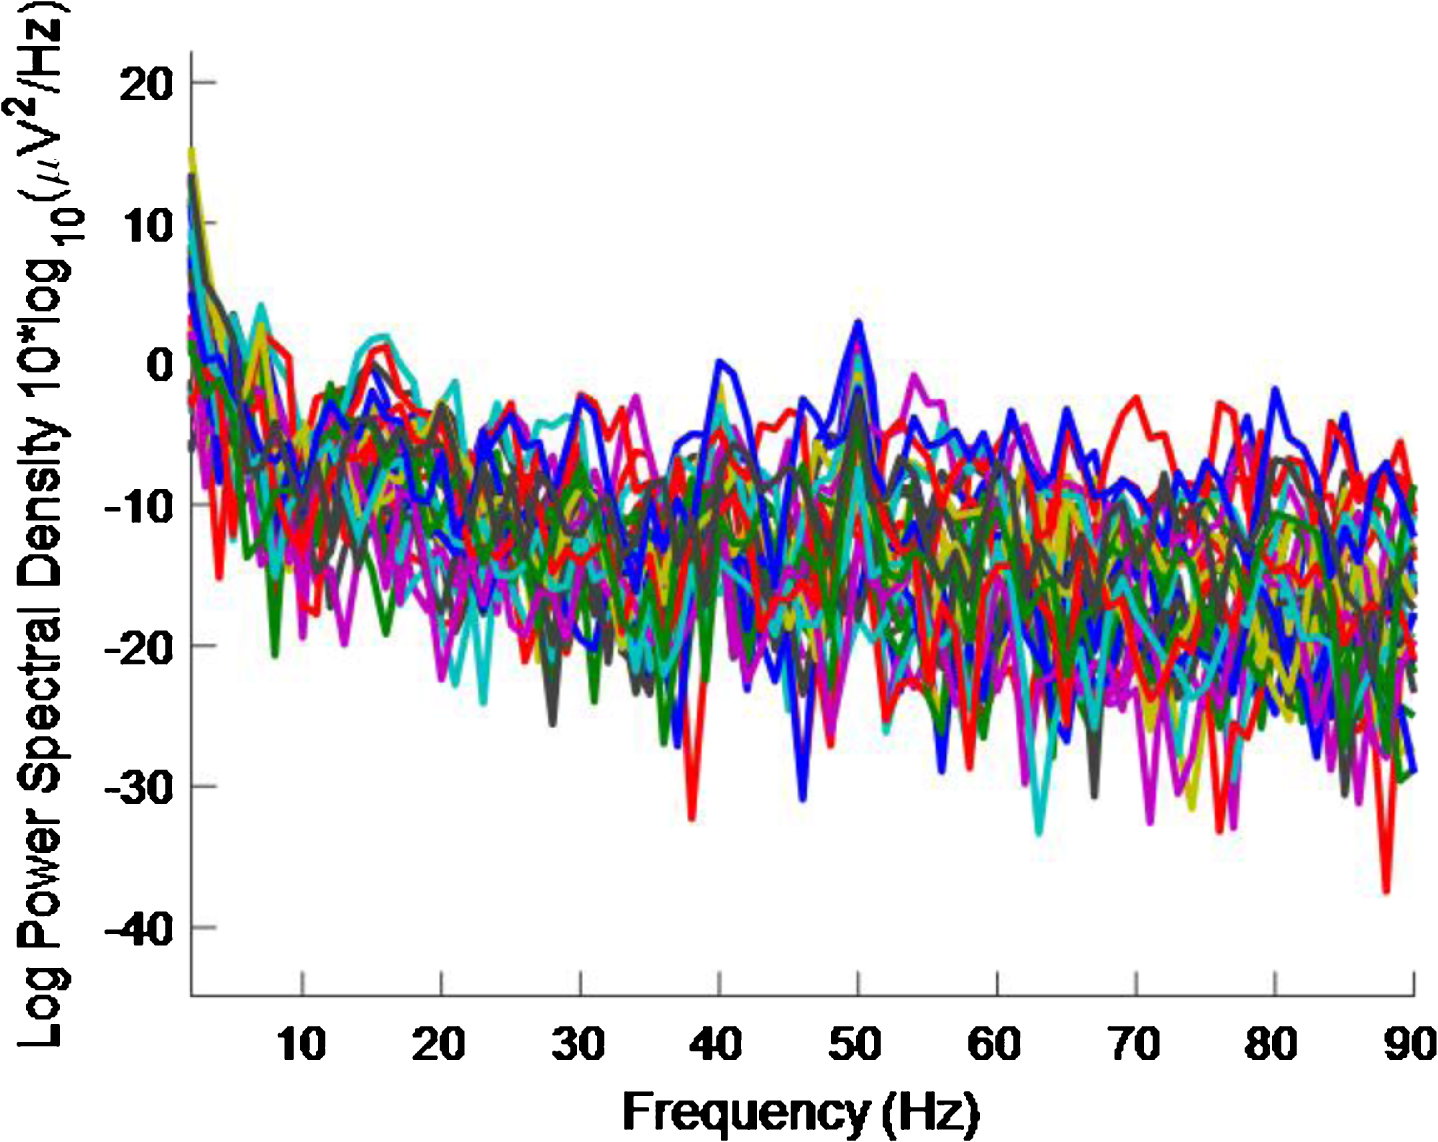
Even though the number of electrodes demonstrating entrainment does not decrease in the cases of healthy volunteers 2 and 3, and decreased from 19 to 11 for healthy volunteer 1, as the length of recorded data reduces, visual inspection of the PSD shows a deterioration of the 40 Hz peaks and the PSDs become noisier with reduced recorded data length. This deterioration can be seen by comparing Fig. 4 with Figs. 10–13 which are for ∼30 s, 20 s, 10 s, 5 s, and 2 s of data, respectively, all for healthy volunteer 3. Therefore, the EET metric should be not be used in isolation. Rather, this EET metric should be used in conjunction with an examination of the PSD plots where traces for all 32 electrodes are given in one figure. Because the PSD plots become noisy as the length of recorded data reduces, no examination of time intervals shorter than 2 s was undertaken and so a definitive lower bound on how long it takes for entrainment to happen is not given here.
Fig.10
PSD for high intensity 40 Hz stimulus for healthy volunteer 3 using the first 20 s of data. A 40 Hz response is evident.
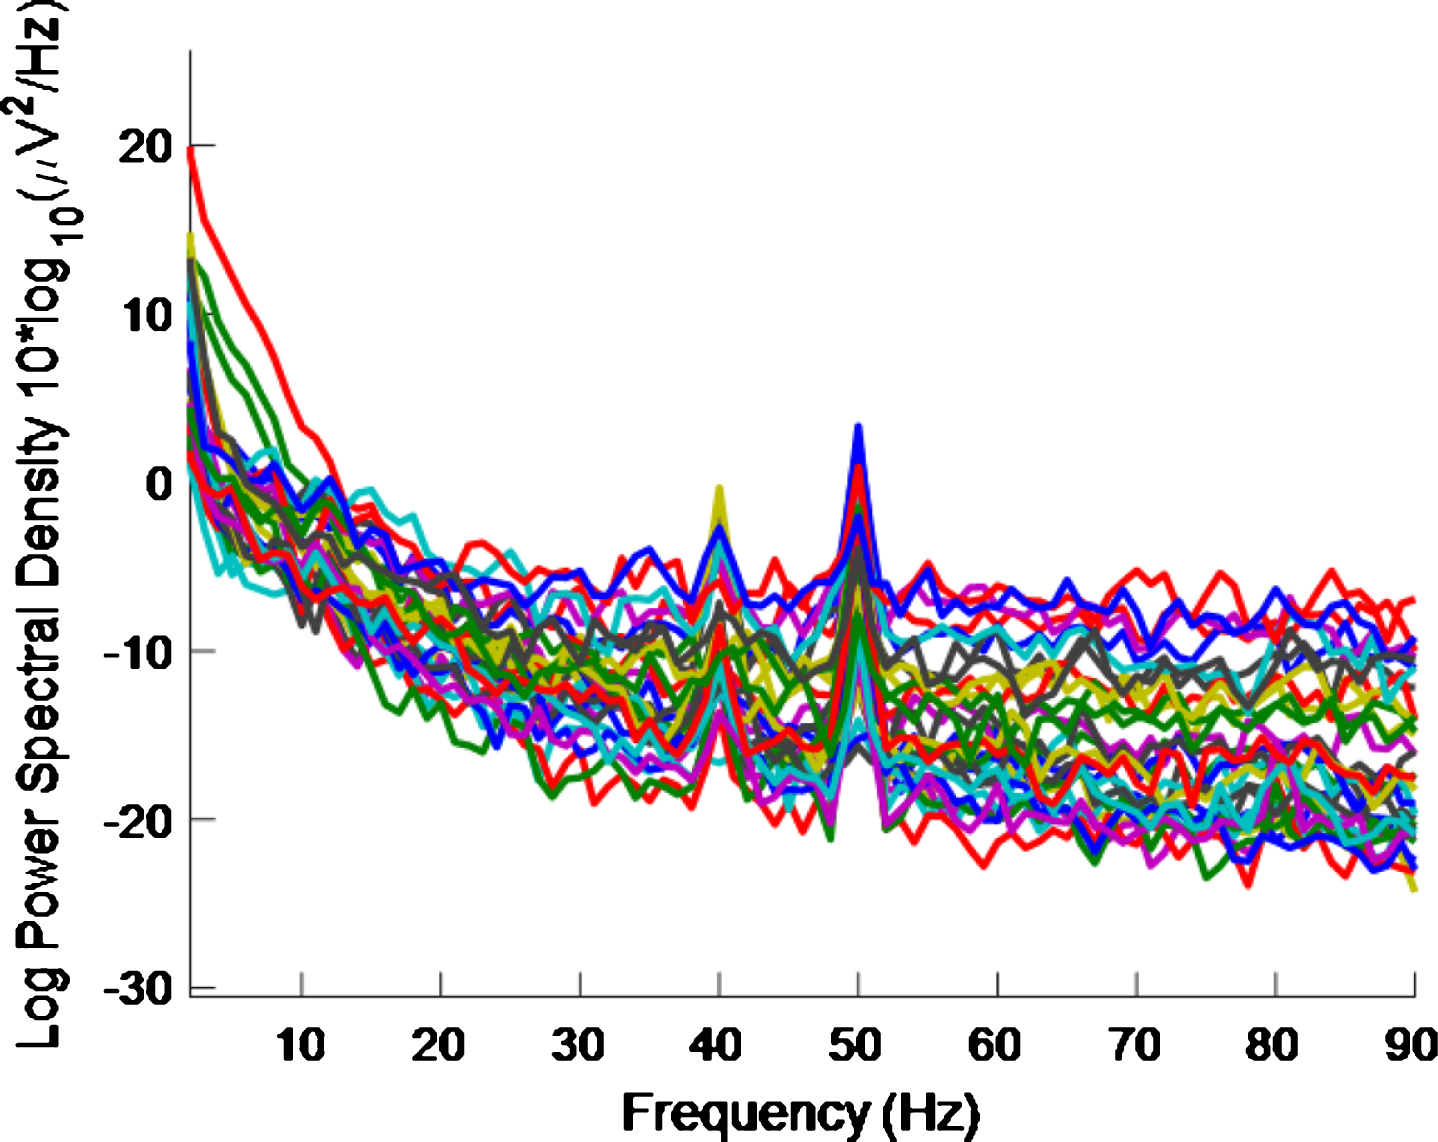
Fig.11
PSD for high intensity 40 Hz stimulus for healthy volunteer 3 using the first 10 s of data. A 40 Hz response is still evident.
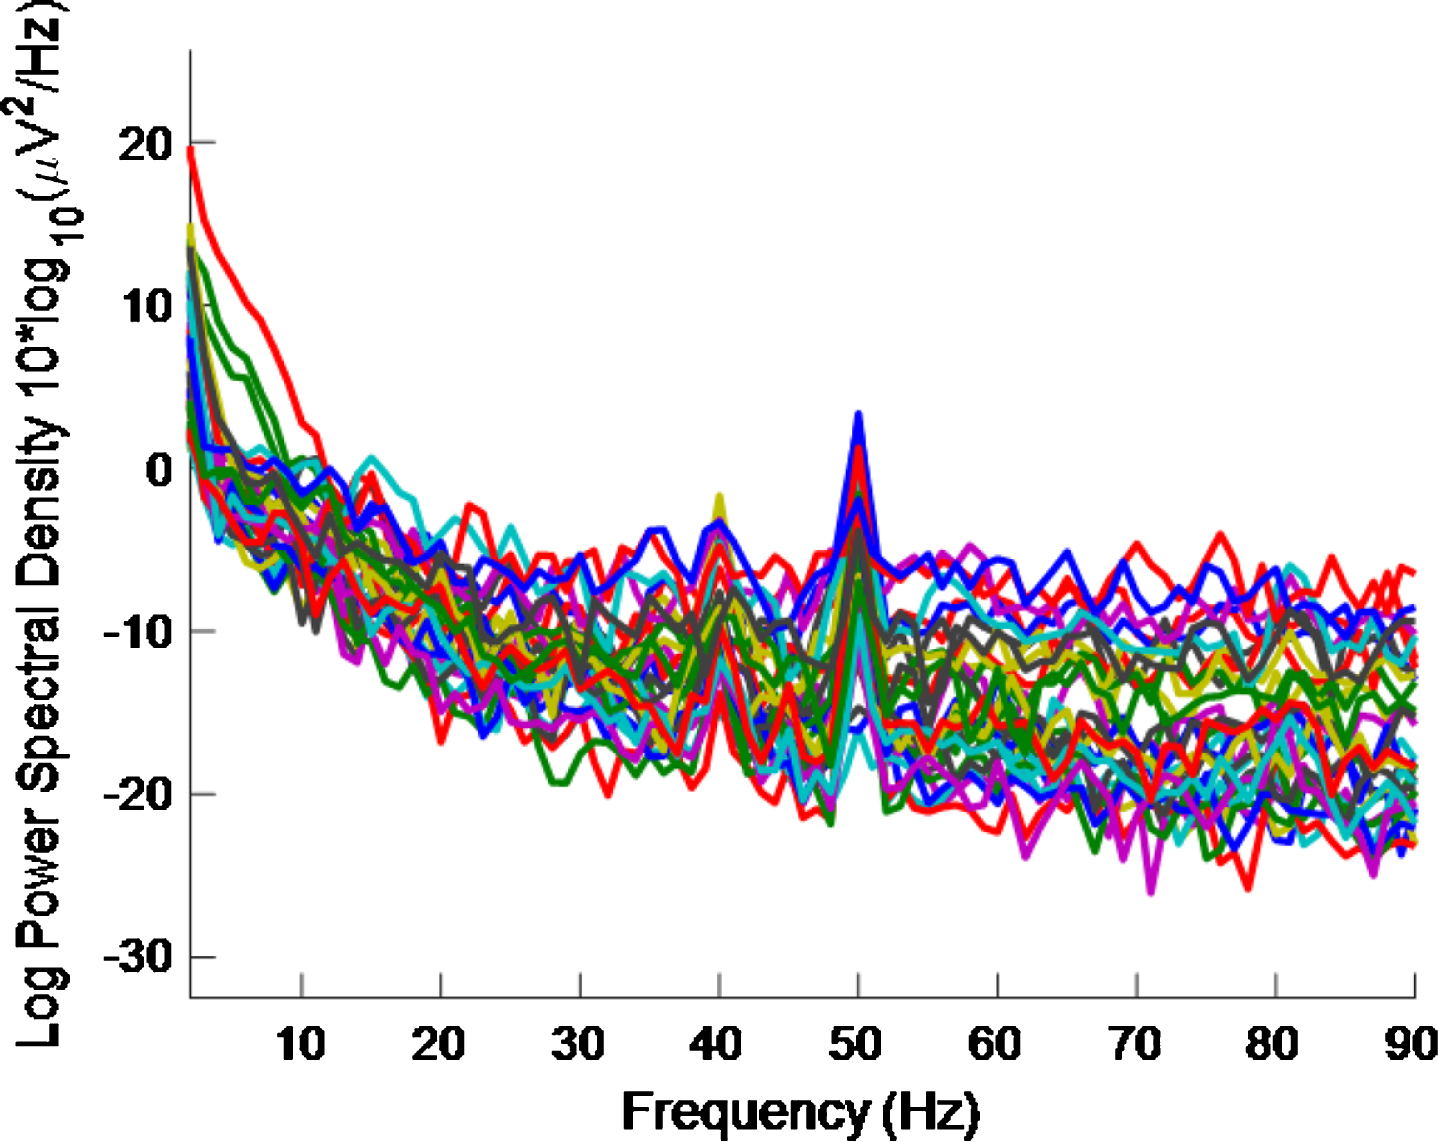
Fig.12
PSD for high intensity 40 Hz stimulus for healthy volunteer 3 using the first 5 s of data. The plot is noisy and it is becoming more difficult to see a 40 Hz response.
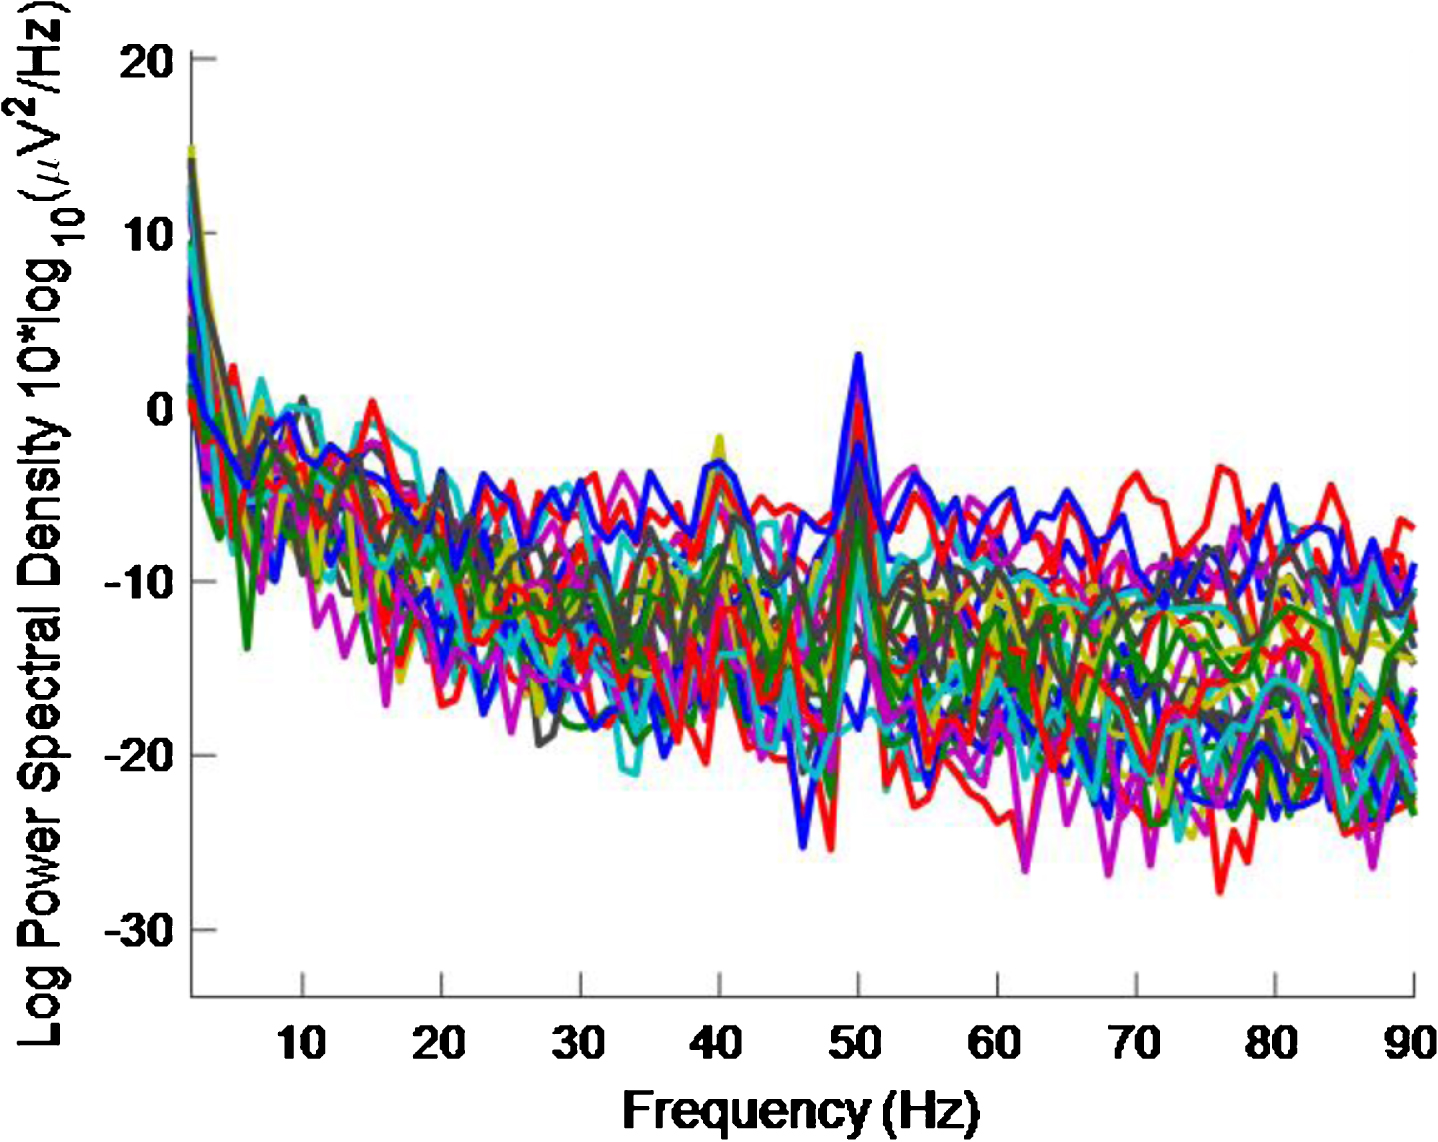
Fig.13
PSD for high intensity 40 Hz stimulus for healthy volunteer 3 using the first 2 s of data. The plot is noisy and it is difficult to see a 40 Hz response.
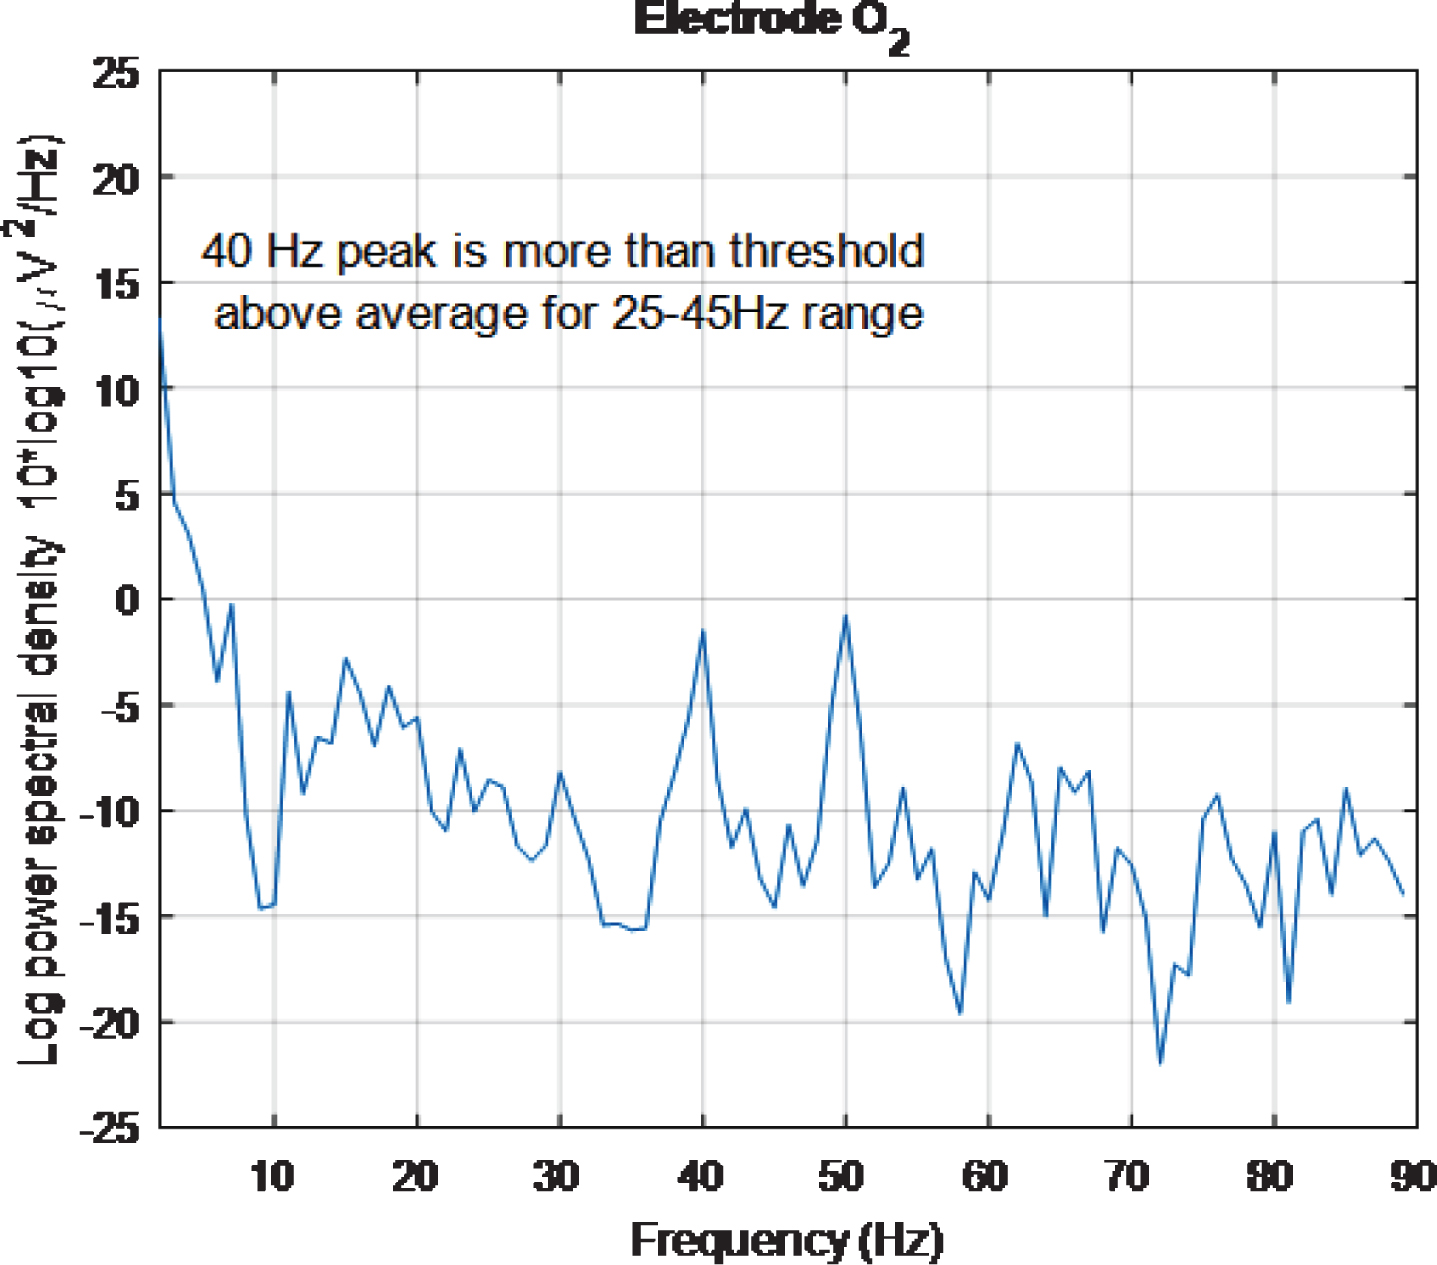
However, looking at plots for individual electrodes in the 5 s plot it was noticed that the PSD for O2 electrode displays a 40 Hz peak and that this peak is of similar amplitude to the 50 Hz peak. The same is true for the 2 s plot. These results can be seen in Figs. 14 and 15, respectively. The 5 s and 2 s PSD plots for electrode O1 (not shown) are noisier and so the 40 Hz peaks are not as obvious as in the O1 plots. From the above discussion, it can be concluded at least one electrode in the primary visual cortex is being entrained with just 2 s of exposure to the stimulus.
Fig.14
PSD for O2 electrode, for high intensity 40 Hz stimulus for healthy volunteer 3 using the first 5 s of data. The 40 Hz peak is evident and is of similar amplitude to the 50 Hz peak.
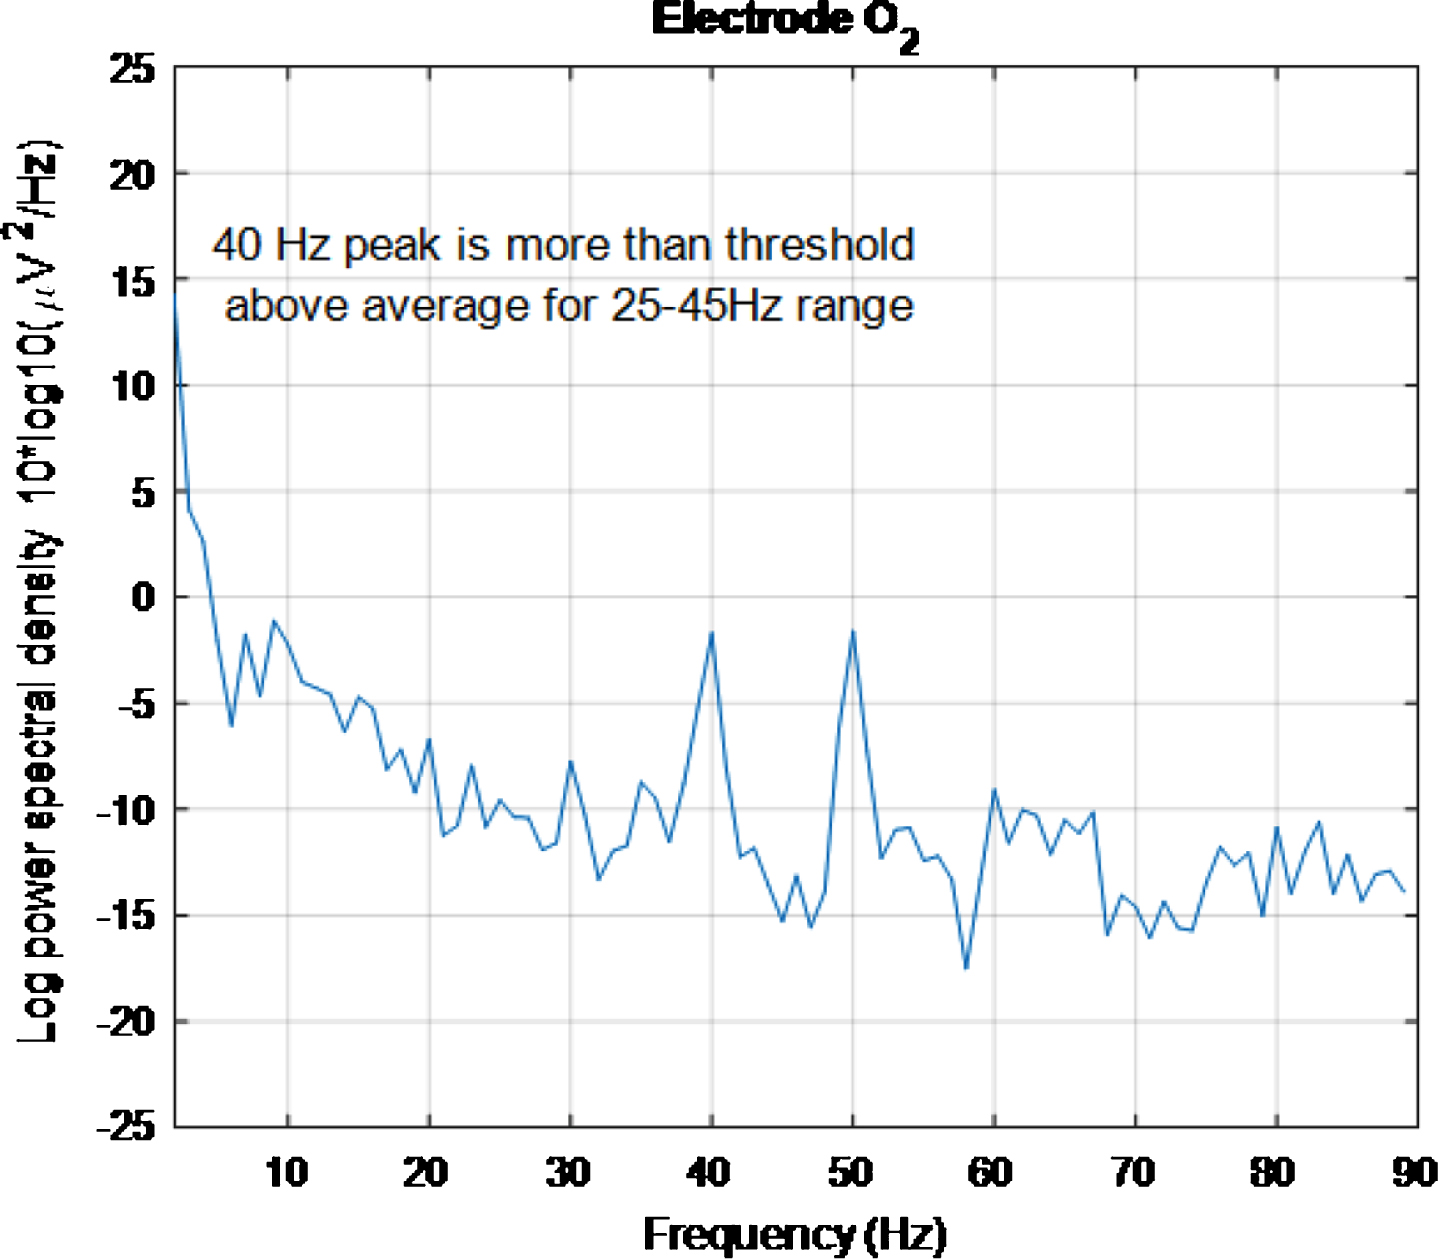
Fig.15
PSD for O2 electrode, for high intensity 40 Hz stimulus for healthy volunteer 3 using the first 2 s of data. The 40 Hz peak is evident and is of similar amplitude to the 50 Hz peak.
Limitations and future work
While it is interesting to explore how long it takes for entrainment to occur, unless short-term entrainment is sufficient to induce an amelioration in cognitive decline, how long entrainment persists is a more pertinent question for a medical device. How long such an entrainment effect might persist was not explicitly studied in this work. However, we can place an upper bound limit on how long entrainment lasts after stimulation has ceased. Healthy volunteers reported ‘persistence of vision’ after the stimuli had ceased, i.e., that they could still ‘see’ a non-flashing ‘after-image’ when stimuli had ended. EEG data for a baseline condition, after each stimulus condition, was taken when the after-image had faded completely. The time taken for the after-image to fade varied, with participant and with stimulus, but was of the order of minutes. Baseline recordings subsequently examined showed no meaningful entrainment and so an upper bound on how long entrainment, due to exposure to 30 s of stimulus, lasts is of the order of minutes. This precise duration of entrainment could be further addressed in future work.
When using such photic stimulation in a multisensory medical device, the amount of time necessary to cause a lasting effect in a patient will depend not only on how long the entrainment effect persists but also, crucially, on whether or not this translates to improved cognitive function. Testing for improved cognitive function is well beyond the scope of this study, involving a longitudinal study of AD patients. There is a need for research into this type of dose-response relationship for this type of stimulation.
As this study represents an early stage proof of concept, only a limited number of participants were examined. However, even with this small sample size, it has been possible to obtain useful information into the effects that gamma band light stimulation, at the 40 Hz point in particular, has on the human brain.
A threshold of 1 was empirically chosen for the EET metric used in this study. Had a different threshold been chosen, different numbers of electrodes would have been deemed to have demonstrated entrainment in Tables 1–5. As can be seen from the scalp maps, in Figs. 5 and 6, many 40 Hz peak amplitudes, for electrodes demonstrating entrainment, exceeded the average PSD in the 25 Hz–45 Hz range by more than 1. Had a threshold of 2, for example, been chosen for the EET metric instead, then only electrodes colored orange and red on these scalp maps would have deemed to have demonstrated entrainment. An ideal threshold, at which cognitive improvement might occur, is not currently known and may be different for different individuals. Research to determine ideal threshold(s) would be a good target for future studies.
Once the ideal threshold is known, an ideal stimulus, for a multisensory medical device to treat AD, would cause widespread entrainment in excess of that threshold. Figure 16 is an example of a scalp map that could be generated using an ideal high intensity 40 Hz stimulus where, purely for illustrative purposes, an ideal threshold of ∼3 has been assumed. Ideal scalp maps, at an ideal threshold, would show the entire head shaded any of the tints represented by numbers on the color bar above the ideal threshold value.
Fig.16
Example of a scalp map that could be generated using an ideal high intensity 40 Hz stimulus where, purely for illustrative purposes, an ideal threshold of ∼3 has been assumed. The entire head is shaded with tints represented by numbers above an ideal threshold on the color scale.
Reviewing scalp maps in Figs. 5 and 6, it can be seen that the temporal lobes are largely colored green and therefore not well covered by electrodes demonstrating entrainment. This means that the high intensity 40 Hz light stimulus used to produce this data is not the perfect stimulus. Since the auditory cortices are part of the temporal lobes, it is anticipated that using an appropriate 40 Hz sound stimulus, simultaneously with a 40 Hz light stimulus, would help to fill such gaps in entrainment so that more widespread entrainment can be achieved than was achieved in this study. Additionally, since the hippocampus, which is vital in episodic memory and autobiographical memory retrieval in humans [5], is also in the temporal lobe, a sound stimulus may prove to be more effective than a light stimulus at stimulating this part of the brain. The two stimulus modalities would not have to be in phase as the brain appears to be able to bring out of phase stimuli into alignment, at least subjectively. This idea was explored in [10] while discussing the work presented in [38].
It is worth noting that once a stimulus response has been verified on AD patients to produce the type of response that may prove therapeutic in AD, it will be possible to employ the stimulus as a treatment without simultaneous recording of EEG.
Further, it is possible that, since this stimulus was used only on healthy volunteers, it may not induce entrainment in AD patients. To our knowledge, from examining the studies that detail the use of brain stimulation using external stimulation, (including light, sound, transcranial alternating current, somatosensory, as well as combinations of light and sound and light, sound and somatosensory stimulation), applied to AD patients, which can be found in the Table 1 in [10], this is not yet known. Finding this out might prove difficult because, depending on how advanced their disease, it may be overly demanding to ask an AD patient to sit still for the lengthy time that it takes to correctly fit an EEG cap and measurements taken.
On the other hand, this high intensity 40 Hz stimulus may well have the desired effect in AD patients. It may even be the case that because of brain plasticity, after sufficient exposure to the stimulus, endogenous gamma rhythms could be restored even without a need for on-going further exposure. This could also be examined in future work.
CONCLUSIONS
Entrainment at 40 Hz has been associated with the removal of proteins known to be associated with pathogenesis in AD in mice. The purpose of this work is to present case studies of applying gamma band light stimulation, at three frequencies, at two different intensity values, to three human healthy volunteers, with simultaneous EEG recording of brain activity.
This study provided some early evidence that our 40 Hz light stimulation can cause a 40 Hz entrainment response in at least some healthy human participants. It also detailed key points of interest from the case studies.
The main insights gleaned from this study are:
• the largest entrainment response was seen at 40 Hz;
• high intensity stimuli cause more entrainment than low intensity stimuli;
• this response did not necessitate removal of possible EMG contamination to be revealed;
• the largest amplitudes for the high intensity 40 Hz stimulus were found at the Pz, O1, and O2 electrodes;
• there was both inter- and intra-individual variability in the responses to the stimuli;
• there was a harmonic effect at double the frequency for the 40 Hz stimulus;
• the entrainment responses seen are not due to electrical interference from the stimulus source;
• an eyes-open protocol causes more entrainment than an eyes-closed protocol;
• entrainment happens within 2 s–5 s with the high intensity 40 Hz stimulus; and
• the response to the high intensity 40 Hz was widespread with between approximately 34.8% and 75% of the electrodes showing entrainment.
It is hoped that the insights uncovered in this study, especially the fact that the response to the high intensity 40 Hz stimulus, detailed in this paper, is widespread, will encourage others to employ light stimulation, as one part of a multisensory stimulus, in the development of a non-invasive medical device to potentially prevent and treat AD.
ACKNOWLEDGMENTS
The research leading to these results has received funding from: the European Research Council under the European Union’s Horizon 2020 Programme/ERC Grant Agreement BioElecPro no. 637780; SFI equipment grant no. 15/ERCS/3276; the charity RESPECT and the People Programme (Marie Curie Actions) of the European Union’s Seventh Framework Programme (FP7/2007–2013) under REA Grant Agreement no. PCOFUND-GA-2013-608728; and a Hardiman scholarship from at the National University of Ireland Galway, Ireland.
Authors’ disclosures available online (https://www.j-alz.com/manuscript-disclosures/19-0299r1).
REFERENCES
[1] | Reitz C , Brayne C , Mayeux R ((2011) ) Epidemiology of Alzheimer disease. Nat Rev Neurol 7: , 137–152. |
[2] | Scheltens P , Blennow K , Breteler MMB , de Strooper B , Frisoni GB , Salloway S , Van der Flier WM ((2016) ) Alzheimer’s disease. Lancet 388: , 505–517. |
[3] | Kumar A , Singh A , Ekavali ((2015) ) A review on Alzheimer’s disease pathophysiology and its management: An update. Pharmacol Rep 67: , 195–203. |
[4] | Iaccarino HF , Singer AC , Martorell AJ , Rudenko A , Gao F , Gillingham TZ , Mathys H , Seo J , Kritskiy O , Abdurrob F , Adaikkan C , Canter RG , Rueda R , Brown EN , Boyden ES , Tsai L-H ((2016) ) Gamma frequency entrainment attenuates amyloid load and modifies microglia. Nature 540: , 230–235. |
[5] | Bartsch T , Dohring J , Rohr A , Jansen O , Deuschl G ((2011) ) CA1 neurons in the human hippocampus are critical for autobiographical memory, mental time travel, and autonoetic consciousness. Proc Natl Acad Sci U S A 108: , 17562–17567. |
[6] | Martorell AJ , Paulson AL , Suk H-J , Abdurrob F , Drummond GT , Guan W , Young JZ , Kim DN-W , Kritskiy O , Barker SJ , Mangena V , Prince SM , Brown EN , Chung K , Boyden ES , Singer AC , Tsai L-H ((2019) ) Multi-sensory gamma stimulation ameliorates Alzheimer’s-associated pathology and improves cognition. Cell 177: , 256–271.e22. |
[7] | Goddard CA , Sridharan D , Huguenard JR , Knudsen EI ((2012) ) Gamma oscillations are generated locally in an attention-related midbrain network. Neuron 73: , 567–580. |
[8] | Palop JJ , Mucke L ((2016) ) Network abnormalities and interneuron dysfunction in Alzheimer disease. Nat Rev Neurosci 17: , 777–792. |
[9] | Verret L , Mann EO , Hang GB , Barth AMI , Cobos I , Ho K , Devidze N , Masliah E , Kreitzer AC , Mody I , Mucke L , Palop JJ ((2012) ) Inhibitory interneuron deficit links altered network activity and cognitive dysfunction in Alzheimer model. Cell 149: , 708–721. |
[10] | McDermott B , Porter E , Hughes D , McGinley B , Lang M , O’Halloran M , Jones M ((2018) ) Gamma band neural stimulation in humans and the promise of a new modality to prevent and treat Alzheimer’s disease. J Alzheimers Dis 65: , 363–392. |
[11] | Lutzenberger W , Pulvermüller F , Elbert T , Birbaumer N ((1995) ) Visual stimulation alters local 40-Hz responses in humans: An EEG-study. Neurosci Lett 183: , 39–42. |
[12] | Tallon-Baudry C , Bertrand O , Delpuech C , Pernier J ((1996) ) Stimulus specificity of phase-locked and non-phase-locked 40Hz visual responses in human. J Neurosci 16: , 4240–4249. |
[13] | Herrmann CS ((2001) ) Human EEG responses to 1-100Hz flicker: Resonance phenomena in visual cortex and their potential correlation to cognitive phenomena. Exp Brain Res 137: , 346–353. |
[14] | Galambos R , Makeig S , Talmachoff PJ ((1981) ) A 40-Hz auditory potential recorded from the human scalp. Proc Natl Acad Sci U S A 78: , 2643–2647. |
[15] | Pantev C , Roberts LE , Elbert T , Roβ B , Wienbruch C ((1996) ) Tonotopic organization of the sources of human auditory steady-state responses. Hear Res 101: , 62–74. |
[16] | Pastor MA , Artieda J , Arbizu J , Marti-Climent JM , Peñuelas I , Masdeu JC ((2002) ) Activation of human cerebral and cerebellar cortex by auditory stimulation at 40Hz. J Neurosci 22: , 10501–10506. |
[17] | Artieda J , Valencia M , Alegre M , Olaziregi O , Urrestarazu E , Iriarte J ((2004) ) Potentials evoked by chirp-modulated tones: A new technique to evaluate oscillatory activity in the auditory pathway. Clin Neurophysiol 115: , 699–709. |
[18] | Becher A-K , Höhne M , Axmacher N , Chaieb L , Elger CE , Fell J ((2015) ) Intracranial electroencephalography power and phase synchronization changes during monaural and binaural beat stimulation. Eur J Neurosci 41: , 254–263. |
[19] | Voicikas A , Niciute I , Ruksenas O , Griskova-Bulanova I ((2016) ) Effect of attention on 40Hz auditory steady-state response depends on the stimulation type: Flutter amplitude modulated tones versus clicks. Neurosci Lett 629: , 215–220. |
[20] | Jamali S , Ross B ((2014) ) Sustained changes in somatosensory gamma responses after brief vibrotactile stimulation:. Neuroreport 25: , 537–541. |
[21] | Pokorny C , Breitwieser C , Muller-Putz GR ((2014) ) A tactile stimulation device for EEG measurements in clinical use. IEEE Trans Biomed Circuits Syst 8: , 305–312. |
[22] | Thut G , Schyns PG , Gross J ((2011) ) Entrainment of perceptually relevant brain oscillations by non-invasive rhythmic stimulation of the human brain. Front Psychol 2: , 170. |
[23] | Ismail R , Hansen AK , Parbo P , Brændgaard H , Gottrup H , Brooks DJ , Borghammer P ((2018) ) The effect of 40-Hz light therapy on amyloid load in patients with prodromal and clinical Alzheimer’s disease. Int J Alzheimers Dis 2018: . |
[24] | Vemuri P , Lowe VJ , Knopman DS , Senjem ML , Kemp BJ , Schwarz CG , Przybelski SA , Machulda MM , Petersen RC , Jack CR ((2017) ) Tau-PET uptake: Regional variation in average SUVR and impact of amyloid deposition. Alzheimers Dement Diagn Assess Dis Monit 6: , 21–30. |
[25] | Du A-T , Schuff N , Kramer JH , Rosen HJ , Gorno-Tempini ML , Rankin K , Miller BL , Weiner MW ((2006) ) Different regional patterns of cortical thinning in Alzheimer’s disease and frontotemporal dementia. Brain 130: , 1159–1166. |
[26] | Parra J , Kalitzin SN , Iriarte J , Blanes W , Velis DN , Lopes da Silva FH ((2003) ) Gamma-band phase clustering and photosensitivity: Is there an underlying mechanism common to photosensitive epilepsy and visual perception? Brain 126: , 1164–1172. |
[27] | Okudan ZV , Ozkara C ((2018) ) Reflex epilepsy: Triggers and management strategies. Neuropsychiatr Dis Treat 14: , 327–337. |
[28] | EasyCap. [Online]. Available: https://www.brainproducts.com/products_by_type.php?tid=3. |
[29] | Acharya JN , Hani AJ , Cheek J , Thirumala P , Tsuchida TN ((2016) ) American Clinical Neurophysiology Society Guideline 2: Guidelines for Standard Electrode Position Nomenclature. Neurodiagnostic J 56: , 245–252. |
[30] | Cortex. Online]. Available: https://www.google.com/search?as_st=y&tbm=isch&hl=en&as_q=human+cortex+lobes&as_epq=&as_oq=&as_eq=&cr=&as_sitesearch=&safe=images&tbs=sur:fc#imgrc=6Tsa59R_AW0nzM: [Accessed: 05-Feb- 2019]. |
[31] | Onton J , Westerfield M , Townsend J , Makeig S ((2006) ) Imaging human EEG dynamics using independent component analysis. Neurosci Biobehav Rev 30: , 808–822. |
[32] | Fitzgibbon SP , DeLosAngeles D , Lewis TW , Powers DMW , Grummett TS , Whitham EM , Ward LM , Willoughby JO , Pope KJ ((2016) ) Automatic determination of EMG-contaminated components and validation of independent component analysis using EEG during pharmacologic paralysis. Clin Neurophysiol 127: , 1781–1793. |
[33] | RUNICA. [Online]. Available: https://bitbucket.org/sccn_eeglab/eeglab/src/a2983535293a3bd3605e96a806182d6d6a4a2594/functions/sigprocfunc/runica.m?at=master&file viewer=file-view-default. [Accessed: 05-Feb-2019]. |
[34] | Williams J , Ramaswamy D , Oulhaj A ((2006) ) 10Hz flicker improves recognition memory in older people. BMC Neurosci 7: , 21. |
[35] | Brodmann. [Online]. Available: https://brmlab.cz/project/brain_hacking/broadmannarea. [Accessed: 05-Feb-2019]. |
[36] | Mitchell KJ ((2018) ), Innate: How the wiring of our brains shapes who we are, Princeton University Press, Princeton, NJ. |
[37] | Marx E , Deutschländer A , Stephan T , Dieterich M , Wiesmann M , Brandt T ((2004) ) Eyes open and eyes closed as rest conditions: Impact on brain activation patterns. Neuroimage 21: , 1818–1824. |
[38] | Kösem A , Gramfort A , van Wassenhove V ((2014) ) Encoding of event timing in the phase of neural oscillations. Neuroimage 92: , 274–284. |

