


Abstract
Subjective experience can be influenced by top-down factors, such as expectations and stimulus relevance. Recently, it has been shown that expectations can enhance the likelihood that a stimulus is consciously reported, but the neural mechanisms supporting this enhancement are still unclear. We manipulated stimulus expectations within the attentional blink (AB) paradigm using letters and combined visual psychophysics with magnetoencephalographic (MEG) recordings to investigate whether prior expectations may enhance conscious access by sharpening stimulus-specific neural representations. We further explored how stimulus-specific neural activity patterns are affected by the factors expectation, stimulus relevance and conscious report. First, we show that valid expectations about the identity of an upcoming stimulus increase the likelihood that it is consciously reported. Second, using a series of multivariate decoding analyses, we show that the identity of letters presented in and out of the AB can be reliably decoded from MEG data. Third, we show that early sensory stimulus-specific neural representations are similar for reported and missed target letters in the AB task (active report required) and an oddball task in which the letter was clearly presented but its identity was task-irrelevant. However, later sustained and stable stimulus-specific representations were uniquely observed when target letters were consciously reported (decision-dependent signal). Fourth, we show that global pre-stimulus neural activity biased perceptual decisions for a ‘seen’ response. Fifth and last, no evidence was obtained for the sharpening of sensory representations by top-down expectations. We discuss these findings in light of emerging models of perception and conscious report highlighting the role of expectations and stimulus relevance.
Introduction
What we perceive can be strongly influenced by top-down factors, such as our prior expectations about likely states of the world and the relevance of input for the task at hand (Bar 2004; Friston 2005; Bar et al. 2006; Clark 2013). According to a growing body of work, expectations, originating from past experience, can shape perception on both a neural and behavioural level (Summerfield and De Lange 2014). When sensory input matches prior expectations, performance on tasks is higher (Cheadle et al. 2015; Stein and Peelen 2015) and neural activity is attenuated (Alink et al. 2010; Kok et al. 2012; Todorovic and de Lange 2012). In such predictive brain frameworks, it is assumed that what we perceive consciously is strongly related to the brain’s best guess about the current state of the outside world (Gregory 1980; Hohwy 2012; Panichello et al. 2013; King and Dehaene 2014a).
Indeed, the idea that our subjective experience is strongly influenced by top-down factors is supported by numerous behavioural studies that have shown beneficial effects of prior knowledge on subjective perception, such as on the accuracy (Stein and Peelen 2015) or speed (Chang et al. 2015; Pinto et al. 2015) of detecting a stimulus. Likewise, it has been shown that prior knowledge increases the likelihood that a stimulus is consciously reported during the attentional blink (AB) (Martens and Johnson 2005; Visser et al. 2015; Meijs et al. 2018). Although expectations seem to affect conscious access, the neural underpinnings of these expectation-related modulations are still unclear. In a recent electroencephalographic (EEG) study, we did not find evidence that the amplitude of neural signals, as indexed by event-related potentials, explained the effect of expectations on the likelihood of conscious report of the stimulus (Meijs et al. 2018). This finding may be explained by the fact that instead of modulating the strength of neural responses, expectations may improve the signal-to-noise ratio or sharpness of the representation of stimuli (Kok et al. 2012; Bell et al. 2016) by instantiating specific perceptual templates (e.g. orientation selectivity), even before stimulus presentation (Kok et al. 2017). Because it has been shown previously that conscious perception may also be closely linked to the quality or variability of sensory representations (Schurger et al. 2010; et al.2015), we here investigated whether similar enhancements of neural representations also underlie the effects that expectations have on the conscious accessibility of stimuli (Meijs et al. 2018).
To this end, we used an AB task in which each trial consisted of a sequence of rapidly presented letters in which one or two targets were to be detected and reported at the end of the stream (targets were marked by placeholders, Fig. 1A). Crucially, the first target stimulus (T1) could either validly, invalidly or not predict (neutral trials) the identity of the second target (T2). Then, multivariate decoding analyses were used on magnetoencephalography (MEG) data to track the neural representations of target stimuli. Further, to explore the effects of task relevance on stimulus-specific neural activity patterns subjects also performed an additional ‘oddball’ task in which a similar rapid serial presentations of letters was presented but subjects were instructed to merely detect a contrast change of a stimulus that happened only on 10% of the trials (these oddball trials were not taken into account in the analyses). The combination of both tasks allowed us to trace the sensory processing of a letter stimulus in the absence of a target identity decision (because the identity of the letters was task-irrelevant). This decoding profile could then be compared to the decoding profile that we observed during the AB task in which subjects did have to make a perceptual decision on the presented target stimuli (target identity was task-relevant). This approach allowed us to perform within-task decoding analyses (training and testing on the AB task using k-folding) and between-task decoding analyses (training on the oddball task and testing on the AB task). Both approaches are aimed at testing different hypotheses. Training the classifier on the oddball task will extract a relatively pure sensory signal (letter identity is task-irrelevant) and therefore between-task decoding will likely isolate those neural processes in the AB task related to similar sensory stages of information processing. Based on earlier research (Kok et al. 2012, 2017), it may be predicted that these stages are also associated with the effect of expectations on conscious report. On the other hand, within-task decoding in the AB will train and test on task-relevant stimuli that require a categorical decision and therefore may additionally reveal decision-dependent processes that could also underlie the role of expectation in conscious access. Thus, our approach allowed us to examine if expectations influence visual representations at sensory and/or decision-related stages and how this influences conscious access.
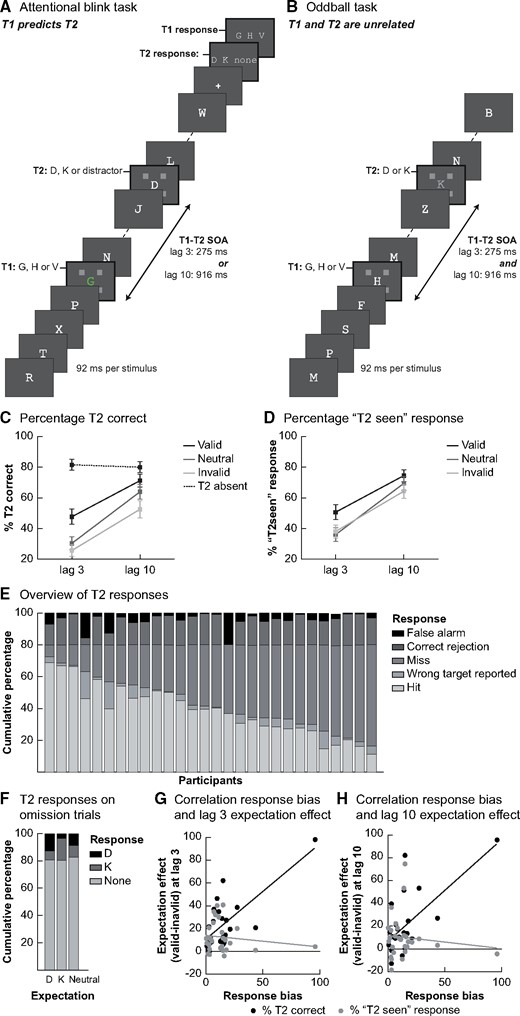
Experimental tasks and behavioural results. (A) The trial structure of the AB task. Each trial consisted of a sequence of rapidly presented letters in which targets were to be detected and reported at the end of the stream. Targets were marked by placeholders. The first target (T1: G, H or V) was always the fifth stimulus in the sequence. A second target (T2: D or K) was presented on 80% of trials, at varying lags. In a training session participants learned conditional probabilities between T1 and T2. One T1 stimulus was used as neutral condition and was thus followed equally often by each T2 stimulus. The other T1 stimuli predicted which T2 target was most likely to appear, thereby introducing valid and invalid expectations. (B) The oddball task was designed such that temporally it resembled the AB task as much as possible, with the most notable difference that on every trial three target stimuli were presented (T1, T2 at lag 3 and T2 at lag 10). Participants’ task was unrelated to the target identity: they had to respond to oddball stimuli that were present on 10% of trials at one of the target positions. In the example trial here, an oddball is presented at the T2 time point. (C) Percentage correct T2 (given that T1 was correctly identified) for each of the lags and conditions. Expectation validity significantly modulated the percentage of T2s that was consciously seen and this effect was different at the two lags. At lag 3, the expectation effect was mainly driven by the valid condition, while at lag 10 both invalid and valid expectations affected T2 detection as compared to neutral trials. (D) Results from a control analysis, using the percentage of trials on which participants reported seeing a T2 target (given that T1 was correctly identified) as dependent variable. Overall, the pattern of results was similar to that in (C). Error bars denote SEM. (E) A general overview of the response pattern over all trials for both lags together. The percentage of misses (no target reported when one was presented) was high in all participants. When no target was presented, participants usually correctly reported not seeing one. (F) The response pattern shows participants had a response bias: if they reported a target on a T2-absent trial, they more often guessed the expected target letter (when there was an expectation). (G) and (H) The relationship between the response bias (% of T2-absent trials with a predictive T1 where the expected target was reported) and the behavioural effect of expectation validity (valid–invalid) at lag 3 (G) and lag 10 (H) was depicted. In both, the relationship is shown for both outcome measures that were used to quantify behavioural performance: percentage correct (black) and percentage of ‘T2 seen’ responses (regardless of the exact letter participants entered; grey).
Materials and Methods
Participants
We tested a total of 33 participants for this experiment. All participants had normal or corrected-to-normal vision. One participant was excluded because T1 identification performance was more than three standard deviations lower than the group average. Furthermore, four participants were excluded because their subjective estimates of T2 visibility were unreliable. When they indicated they perceived a target they were not able to identify the target correctly more often than chance-level (P > 0.05 in a binomial test). Additionally, only in the MEG analyses we excluded participants for whom the number of observations in any of the relevant conditions (usually in the invalid condition, which had less trials) was lower than 10, similar to Meijs et al. (2018). As a result, we included 28 participants (18 females, age 22.5 ± 2.8 years) in the behavioural analyses and 19 participants (12 females, age 23.0 ± 2.8 years) in the MEG analyses. For one control analysis, we included all 28 participants to rule out our selection of participant biased the results.
The experiment was approved by the local ethics committee of the Radboud University (CMO Arnhem-Nijmegen; ‘Imaging Human Cognition’). Written informed consent was obtained from participants according to the Declaration of Helsinki. Compensation was either 36 Euros or course credit.
Materials
Stimuli were generated using the Psychophysics Toolbox (Brainard 1997) in a MATLAB (MathWorks, Natick, MA, USA) environment. In the behavioural lab, stimuli were displayed on a 24″ BENQ LED monitor (1920 × 1080 pixels; 120 Hz). A chinrest was used to control participants’ distance from the screen (±57 cm). In the MEG environment, a PROPixx projector (VPixx Technologies Inc., Saint-Bruno, Canada) located outside the magnetically shielded room projected the stimuli onto a screen ∼80 cm in front of participants (1920 × 1080 pixels, 120 Hz). All visual input was presented on a ‘black’ background (luminance: ± 3 cd/m2) and matched for visual luminance between the two labs.
Procedure and stimuli
The experiment consisted of two sessions that were completed within 1 week. In the first session, participants performed an oddball task and in the second session an AB task (Raymond et al. 1992). In both sessions MEG was recorded. In the first session, after the oddball task, participants also practiced the AB task outside of the MEG scanner so that they could learn about the predictive relationship between T1 and T2.
Session 1: Oddball task
At the start of the first session, we measured MEG while participants performed an oddball task that was highly similar to the AB task (Fig. 1B). Again, every trial consisted of a sequence of letters in which letters that were targets in the AB task were presented. On every trial, a ‘T1’ (the letter D, V or G) was presented followed by a ‘T2’ (the letter D or K) at both lag 3 and lag 10 and every of these targets was marked by placeholders. All stimuli, including targets, were ‘white’. Every combination of ‘T1’ and ‘T2’ stimuli was equally likely, meaning there was no predictive relationship between the targets. Importantly, participants were not made aware of the presence of the targets. Moreover, because they had not yet seen the AB task, they did not know about the existence of any specific target letters (or predictive relationship between those). The timing of the stimuli and trials was identical to that in the AB task, with the exception that at the end of the letter sequence the ITI (800–1200 ms) started immediately.
Participants were instructed to detect oddball stimuli that occurred on 10% of the trials. An oddball was defined by its grey (luminance: ± 78 cd/m2) instead of white colour. Once an oddball was detected, the participant had to press the index finger button on an MEG-compatible button box as quickly as possible while the task continued. Because, unbeknownst to participants, oddballs were always either a ‘T1’ or ‘T2’ target, they were accompanied by the same placeholders used in the AB task. To make sure participants would focus their attention on the relevant time points in the sequence, they were explicitly instructed that these squares marked the potential temporal positions of oddballs and would help them detect oddballs. Oddball trials were excluded from all analyses. Every participant completed 8 blocks of 96 trials (total 768 trials) of the task. Every block was followed by summary feedback and a short break.
Session 1: Training of the AB task
At the end of the first session, every participant was behaviourally trained on the AB task. First, participants received on-screen instructions in which they were explicitly instructed about the predictive relationship between T1 and T2. Subsequently, they performed 6 blocks of 75 trials (total 300 trials) of the task. The goal of this training session was to familiarize participant with the task before the MEG session and to teach participants the predictive relationship between T1 and T2. We did not analyse the data from this training session.
Session 2: AB task
Participants had to detect targets within a sequence of rapidly presented distractors (92 ms per stimulus). Each stimulus in the sequence was an uppercase letter that was presented at fixation in a monospaced font (‘Courier New’; letter size: ±2.08°). The first target (T1: G, H or V) was presented in ‘green’ at the fifth position of the sequence. In 80% of trials a second target (T2: D or K) was presented as well, either at lag 3 (275 ms after T1 onset; two-third of trials) or at lag 10 (917 ms after T1 onset; one-third of trials). Each distractor letter (all alphabet letters excluding the targets) was presented maximally once per trial. T2 targets and distractors were presented in ‘white’ (luminance: ± 230 cd/m2).
Crucially, the likelihood of each T2 target appearing was conditional on the identity of the T1 stimulus that was previously presented (Fig. 1A). For every participant, one of the T1 stimuli (e.g. G) predicted that ‘D’ was the most likely T2 target while another T1 (e.g. H) made the exact opposite prediction that ‘K’ was the most likely T2 target. If a T2 was presented, the likely T2 stimulus was shown on 75% of trials. A third T1 stimulus (e.g. V) had no predictive value (neutral condition; 20% of trials), i.e. both T2 stimuli were equally likely to follow T1. All possible mappings of T1 and T2 were used across participants in a counterbalanced fashion, but mappings were fixed within a given participant for the entire experiment. On 20% of trials no T2 stimulus was presented but a random distractor letter was presented instead at either lag 3 or lag 10. Both at the T1-timepoint and the T2-timepoint of a trial, even when a T2 target was omitted, a placeholder consisting of four grey squares (luminance: ± 50 cd/m2; size: 0.62°; midpoint of each square centred at 2.34° horizontally and vertically from fixation) was presented around the target letter. This placeholder provided timing information, cueing participants which time points were relevant in a trial and thereby helping them decide which targets they saw during a trial.
Following a 150 ms blank period at the end of the letter sequence, participants gave their responses with the use of a (MEG-compatible) button box, using the index, middle and ring finger of their right hand. First, they reported the T2 they had seen (3 response options: D, K or none). Subsequently, they were asked to make a forced-choice judgment about the T1 stimulus that was presented (3 response options: G, H or V). A long response timeout duration of 4 s was used, and participants were explicitly instructed to value accuracy over response speed. The inter-trial interval was 800–1200 ms.
Before starting the MEG recordings, participants were briefly reminded about the task instructions (given to them in a previous session, see next paragraph). Every participant completed ∼750 trials (average: 748.7 ± 26.8, minimum: 652; maximum: 803), with the exact number depending on the duration of MEG preparations and the number of breaks a participant needed. At the end of every block of 75 trials, participants received summary feedback about their performance and were provided with the opportunity to take a short break.
Behavioural analyses
Oddball task
Like for the AB task, behavioural data were preprocessed with MATLAB. We computed hit rates (percentage of detected oddballs) and analysed these using JASP (Love et al. 2015). Specifically, we compared the hit rate between trials where the oddball was presented at the T1-timepoint, the lag 3 T2-timepoint or the lag 10 T2-timepoint.
AB task
Behavioural data were preprocessed with in-house MATLAB scripts and subsequently analysed using JASP software (Love et al. 2015). We focused on the effects of lag and expectation on percentage correct T2 visibility, given that the correct T1 target was reported. T2 responses were considered to be correct if a participant entered the target letter that was presented or reported not seeing a letter when none was presented on a T2 absent trials. Since expectations are undefined on T2 absent trials, these trials cannot be used in the main statistical analyses. T2 percentage correct was used in a 2 × 2 repeated measures ANOVA with the factors expectation validity (valid, invalid and neutral) and lag (lag 3, lag 10). Subsequently, we performed posthoc t-tests to directly compare the different levels of expectations within each of the lags.
MEG measurements and preprocessing
Whole-head magnetoencephalographic (MEG) recordings were acquired (sampling rate 1200 Hz) using a 275-channel MEG system with axial gradiometers (VSM/CTF Systems, Coquitlam, BC, Canada), which was located in a magnetically shielded room. Four channels (MLC11, MLC32, MLF62 and MRF66) were disabled in all participants for technical reasons. Head position was monitored and corrected if required using three coils, placed on the nasion and on earplugs in both ears (Stolk et al. 2013). Importantly, at the start of the second MEG session an effort was made to reposition a participants’ head as much as possible in the same location as during the first session by using a template head position saved in the first MEG session. In addition to the MEG, three sets of electrodes (+ground) were used to measure the electrocardiogram and horizontal and vertical eye movements. Finally, an Eyelink 1000 eyetracker (SR Research, Ottawa, Canada; sampling rate 1000 Hz) was used to measure pupil dilation and vertical and horizontal eye movements.
For each session separately, we preprocessed the data with the FieldTrip toolbox for MATLAB (Oostenveld et al. 2011). Data were high-pass filtered at 0.01 Hz to remove slow signal drifts. Additionally, a set of notch filters was applied at 50, 100 and 150 Hz to remove line noise. Subsequently, we cut the data into epochs from −750 to 1500 ms relative to T1 stimulus onset. The data were visually inspected and trials and/or channels with artefacts were deleted (averages session 1: 7.0% of trials, 1.2 channels; averages session 2: 5.4% of trials, 1.1 channels). To remove noise originating from far away external sources, third-order gradient correction using the CTF reference sensors was applied. Independent component analysis was used to identify and remove data components related to eye blinks, eye movements or heartbeats. To get a reliable estimate of which components to delete, each of the components was correlated to the EEG and eyetracker channels. Following the independent component analysis, previously deleted channels were reconstructed using the average of neighbouring channels. Finally, all trials were baseline corrected on the interval 500 ms prior to T1 onset (corresponding to −775 to −275 ms prior to T2 onset).
Decoding analyses and statistics
Prior to the decoding analyses, we applied a sliding window of 50 ms to average the data, thereby smoothing the data in the temporal domain and improving the signal-to-noise ratio. Subsequently, we performed the decoding analyses by using linear discriminant analysis (LDA) decoders with the activity from all MEG-channels as features. In short, as outcome measure, the LDA decoder calculates the distance from a decision boundary on a trial-by-trial basis (full analysis details are available in Mostert et al. 2015). This distance measure can be used as a quantitative measure of the evidence for a certain class in de decoder. In cases where a decoder was trained and tested on the same dataset, a 10-fold cross-validation procedure was implemented in which for each fold the LDA decoder was trained on 90% of the trials and tested on the remaining 10% of trials. To be able to look at the stability of neural representations over time, all decoders were trained at one-time point and then tested on all-time points, resulting in a temporal generalization matrix (time range −250 to 1500 ms relative to T1; see also King and Dehaene 2014a,b). Cluster-based permutation tests with 1000 permutations were used to find the significant positive or negative clusters within the temporal generalization matrices of interest (Maris and Oostenveld 2007). During each permutation, positive and negative clusters were identified independently (each using one-sided P = 0.025 level), and subsequently the t-values within a cluster were summed. We then took the maximum absolute t-value sum as the statistic for the permutation distribution to which observed cluster t-statistics would be compared.
Using these analyses methods, we initially decoded T2 target identity at lag 3 within each of the two tasks. Further decoding analyses were done between-tasks, training the LDA decoder on one task and testing it on the other task. For the main analyses, we used the decoding that was trained on the oddball task and tested it on the AB task data (only trials where T1 was correctly identified), separately for valid and invalid trials. We did not include the neutral condition here because the number of observations in this condition was low (only presented on 20% of trials). A similar analysis was done to compare T2 identity decoding between T2 reported and T2 missed trials. As a control, we repeated all these decoding analyses for T2 targets presented at lag 10, the results of which are reported in the Supplementary material.
Next, we used the decoder trained on the oddball task and tested it on the AB data (T1 correct trials) for T2-absent trials and trials with lag 10 together (in both conditions, no target stimulus was presented at lag 3). Instead of grouping trials based on T2 identity, we grouped trials based on the expected T2 stimulus so that we could investigate the neural representation of sensory expectations. In a final group of analyses, decoders were trained and tested on the AB task (lag 3 and T1 correct trials only), allowing us to investigate the main effects of expectation validity and T2 visibility within the AB task. In addition, we did within-task T2 decoding analyses separately for T2 reported and T2 miss trials. Finally, to get a better view at the decoding results when training and testing on the same time point, we extracted the diagonal from the temporal generalization matrices of a number of analyses. We performed a paired-samples t-tests to each time point of the data after T1 presentation (0–1500 ms) and subsequently applied false discovery rate (FDR) correction.
Results
Behavioural results: oddball task
In the oddball task, we computed the hit rate (percentage of detected oddballs) for each of the time points at which an oddball could be presented. The hit rate was significantly different between these time points (F2,54 = 13.87, P < 0.001; T1 time: 72.49 ± 27.91%; T2 lag 3 time: 74.38 ± 25.74%; T2 lag 10 time: 60.27 ± 27.12%). Follow-up t-tests showed this effect was caused by a lower hit rate for oddballs presented at the latest position in the stream (T1 time vs. T2 lag 10 time: t27 = 3.364, P = 0.002; T2 lag 3 time vs. T2 lag 10 time: t27 = 5.065, P < 0.001), while there was no difference between the other two time points (T1 time vs. T2 lag 3 time: t27 = −0.897, P = 0.378).
Behavioural results: attentional blink task
In Fig. 1C, we show percentage correct T2 discrimination for trials on which T1 was correctly identified, separately for short and long lags (T1 accuracy T2 at lag 3: 95.63%, SD = 3.68%; T1 accuracy T2 at lag 10: 95.69%, SD = 3.95%). We observed a clear AB, as indicated by a reduced T2 performance when the time between T1 and T2 was short compared to long (lag 3: 34.57%; lag 10: 62.58%; F1,27 = 61.43, P < 0.001). Importantly, T2 stimuli were more often correctly reported when they were expected (collapsed across lag: expected: 59.44%, unexpected: 39.13%; F2,54=17.37, P < 0.001) and this effect of expectations was different at lag 3 than at lag 10 (interaction lag × validity: F2,54 = 5.97, P = 0.005).
To test whether valid expectations increase, or invalid expectations decrease, T2 reportability, we directly compared valid, invalid and neutral trials at each of the two lags. At lag 3, where T2 most often goes unreported, T2 discrimination performance was higher in the valid (black line; 47.67%) than in the neutral (dark grey line; 30.35%) and invalid (light grey line; 25.68%) conditions (valid–invalid: t27 = 5.49, P < 0.001; valid–neutral: t27 = 4.60, P < 0.001). In the invalid condition performance was lowest, although not significantly lower than performance in the neutral condition (neutral–invalid: t27 = 1.79, P = 0.084). At the long lag, performance was also higher in the valid than invalid condition (valid 71.21%; invalid 52.57%; valid–invalid: t27 = 3.88, P < 0.001) and performance in the neutral condition was in between the other conditions, though closer to the valid condition (neutral: 63.97%; valid–neutral: t27 = 2.04, P = 0.051; neutral–invalid: t27 = 3.18, P = 0.004). Taken together, these results replicate earlier findings that conscious access can be affected by expectations about stimulus likelihood and that these effects are largest at short lags, inside the AB (Meijs et al. 2018). Additionally, at this short lag performance was significantly improved when expectations were valid compared to neutral, while the negative effect of invalid expectations was relatively small. Indeed, the benefit of valid expectations was larger at lag 3 than at lag 10 (valid–neutral lag 3 vs. valid–neutral lag 10: t27 = 3.67, P = 0.001). This suggests that at short lags, when the T2 stimulus is most often missed, the observed expectation effects are likely mostly driven by a benefit from valid expectations, which leads to a higher likelihood of conscious access.
Overall, false-alarms were infrequent, on ∼19% of T2-absent trials subjects reported a target (Fig. 1E and F), correct rejections for T2-absent trials: lag 3: 81.52%; lag 10: 79.94% (Aru and Bachmann 2017). Further, if participants reported seeing a target on T2-absent trials, they most often reported the expected target (t27 = 2.52, P = 0.018), demonstrating that participants had indeed learned the predictive relationship between T1 and T2 and used this information for their decisions. Therefore, it may be that the behavioural effect of expectations we observed on T2-present trials is (partly) affected by this response bias. Indeed, a correlation between participants’ response bias, as measured by the percentage of trials they reported the expected letter vs. another letter on T2-absent trials, and their expectation effect, as measured by the difference in performance on valid minus invalid trials, was observed at lag 3 (Fig. 1G and H, black dots; lag 3: spearman r = 0.49, P = 0.008; lag 10: spearman r = 0.34, P = 0.078). However, a control analysis where we analysed the percentage of ‘T2 seen’ responses (classifying a response as ‘seen’ regardless of whether this letter was correctly reported) showed comparable effects of expectation (validity effect: F2,54 = 6.06, P = 0.004; interaction lag × validity: F2,54 = 5.13, P = 0.009, Fig. 1D). Therefore it seems unlikely that response bias can fully explain our behavioural results, because in this control analysis the dependent variable (seen vs. miss) is completely orthogonal to participants’ expectations (D vs. K), ensuring that expectations cannot bias a specific response option. This is further supported by the fact that this outcome measure did not correlate with the response bias participants had on T2-absent trials (Fig. 1G and H; grey dots; lag 3: spearman r = −0.09, P = 0.649; lag 10: spearman r = −0.11, P = 0.594). This suggests that the observed expectation effects are present over and above the effects of response bias (note that the pattern of correlations was similar when the outlier subject with a response bias of nearly 100% was removed from the data, lag 3: spearman r = −0.05, P = 0.822; lag 10: spearman r = −0.05, P = 0.807).
Decoding of T2 identity is modulated by stimulus relevance
Multivariate analyses can provide insights in the dynamics of category-specific brain responses, as different neural and cognitive processes may be reflected in dissimilar patterns of temporal generalization (King and Dehaene 2014b). First, we tested the role of stimulus relevance in the processing of the letter stimuli. To do so, we focused on decoding the identity of T2 targets (D vs. K) at lag 3, irrespective of conscious report or expectations. Figure 2A and D shows the temporal generalization profiles for T2 identity within each of the two tasks, using cross-validation procedures and corrected for multiple comparisons (see Materials and Methods section for details). As can be seen, T2 target identity could reliably be decoded from MEG data in both tasks, as reflected in a typically observed diagonal decoding pattern starting ∼100 ms after T2 onset (Oddball task: P = 0.022; AB task: P < 0.001, permutation tests). This diagonal decoding pattern likely reflects a rapid sequence of distinct neural processes evolving over time (King and Dehaene 2014b; Mostert et al. 2015; Marti and Dehaene 2017). Further, as expected, in the AB task only, decoding performance was not only strong on the diagonal of the temporal generalization matrix, but its profile showed a mixture of a diagonal and a square-shaped pattern and decoding was much more extended in time. Thus, we observed stimulus-specific stable and sustained activation patterns for task-relevant compared to task-irrelevant stimuli. Next, we trained decoders on each of the tasks and subsequently tested them on the data of the other task (between-task decoding) to test for neural similarities and differences between the tasks. This approach solely resulted in significant clusters along the diagonal of the temporal generalization matrices for both analyses, further highlighting a shared neural coding of target identity from ∼100 to 375 ms post T2 onset (Oddball task → AB task: P = 0.013, Fig. 2B; AB task → Oddball task: P = 0.024, Fig. 2D). This conclusion is also supported by similar decoding results for T2 stimuli presented at lag 10 (Supplementary Fig. 1). Overall, these results show that when stimuli are task-relevant (require a perceptual decision) additional processing steps can be picked up by the classifier and T2 identity is processed in more stable and temporally extended neural representations, as compared to when stimuli are task-irrelevant (Kiebel et al. 2008; Stokes et al. 2009; King and Dehaene 2014b; Mostert et al., 2015; Myers et al. 2017).
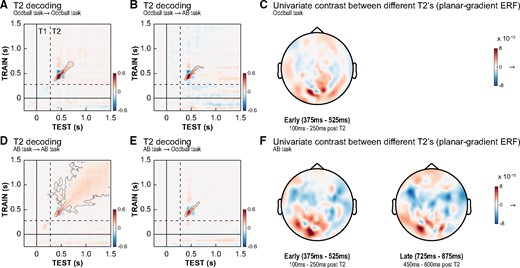
Decoding of T2 identity at lag 3. Temporal generalization matrices showing that T2 target identity (D vs. K) could be reliably decoded from MEG data within both the oddball task (A) and the AB task (D). Decoding was longer and more widespread in the latter, suggesting neural representations were more stable over time. (B, E) Between-task decoding analyses (trained and tested on separate datasets) showed significant clusters along the diagonal, indicating that early neural sensory representations of T2 identity were highly similar between-tasks. Timing of all panels is relative to T1 onset. Dashed lines indicate T2 stimulus onset. Contours of significant clusters are marked with a grey line (corrected for multiple comparisons). Decoding of T2 targets at lag 10 is shown in Supplementary Fig. 1. To visualize the pattern of activity used by the decoding algorithm, we display topographic plots (C, F) showing the planar gradient event related field (ERF)-difference between the two T2 targets (univariate contrast). On the left, we show the topography in an early window (100–250 ms post T2; including the peak in decoding) for both tasks. For the AB task only, a topographic plot in a later window (450–600 ms post T2), in which there was no significant decoding for the oddball task, is shown.
Conscious access is related to late and stable stimulus-specific neural representations
Next, we tested how category-specific neural representations relate to conscious report, or the absence thereof, in the AB task. We did so by comparing T2 decoding (D vs. K) at lag 3 for seen T2s vs. missed T2s. To rule out any effect caused by the identity of T1, only trials where T1 was correctly reported were incorporated in these analyses. Figure 3 shows both between-task analyses (Oddball task → AB task) and within-task analyses (AB task → AB task; done separately per condition). In line with prevalent theoretical models of consciousness, such as global workspace theory (Baars 2002) and local recurrence theory (Lamme 2006), early sensory processing of the stimulus was independent of conscious report, as reflected by similar decoding profiles along the diagonal of the temporal generalization matrix for reported and missed T2’s (Fig. 3A–C, Oddball task → AB task) (Dehaene et al. 2006; Dehaene and Changeux 2011; King et al. 2016; Fahrenfort et al. 2017). Figure 3 also shows within-task analyses (AB task →AB task) in which T2 identity was decoded based on solely T2 reported (Fig. 3D) or T2 missed trials (Fig. 3E). In both analyses, significant l decoding of T2 identity around the diagonal was observed (T2 reported trials: P < 0.001, miss trials: P = 0.042). However, when T2 was reported, this decoding pattern was longer-lasting (Fig. 3F) and had a broader spatial profile (more square-shaped instead of diagonal, T2 reported: decoding significant from ∼100 ms to ∼1200 ms post T2-onset; T2 missed: decoding significant from ∼100 ms to ∼410 ms post T2-onset). This suggests that, compared to missed T2’s, the signal was broadcasted higher up the cortical hierarchy (for similar results see Mostert et al. 2015). Please note that the apparent pre-stimulus decoding in Fig. 3F should not necessarily be interpreted as evidence for decoding of stimulus-specific T2 activations before the stimulus is presented. This effect most likely relates to decoding of T1, which in the AB task was correlated to T2 identity.
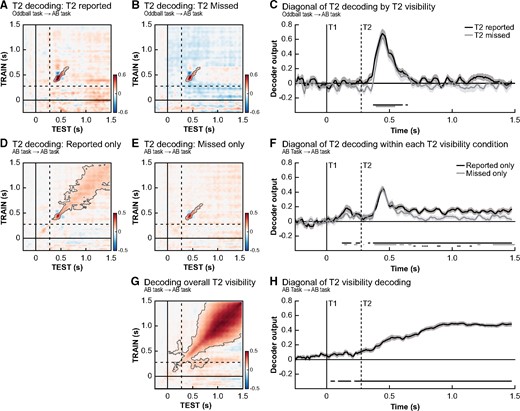
Conscious stimulus detection and its neural representation. Temporal generalization matrices for the decoding of T2 identity at lag 3, trained on the oddball task, for trials where T2 was consciously perceived (A) and trials where it was missed (B). T2 targets could be reliable decoded in both conditions and no significant differences between both conditions was observed along the diagonal (C). Within condition decoding analyses trained on the AB task show T2 decoding was more long-lasting (F) and stable on trials where T2 was consciously perceived (D) compared to where it was missed (E). (G, H) A direct investigation of the effect of T2 visibility (seen vs. miss, irrespective of stimulus identity) showed widespread significant decoding starting before stimulus onset, indicating an early and long-lasting main effect of stimulus visibility. Timing of all panels is relative to T1 onset and in every panel only trials where T1 was correctly identified were used. Dashed lines indicate the onset of a T2 stimulus at lag 3. Significant clusters in the temporal generalization matrices are contoured by a grey line (corrected for multiple comparisons). We also used t-test for effects along the diagonals, as shown in panels (C, F, H) in which significant time periods are marked by horizontal lines at the bottom of the panel. Solid lines indicate significant time points (FDR-correct P-value <0.05) for conditions while the difference between conditions is indicated by a dotted line (only in F).
Finally, we aimed to decode reported vs. missed T2’s in the AB task, irrespective of the specific stimulus that was presented (classifier labels: reported vs. missed, target letter is not relevant, Fig. 3G, P < 0.001). Several interesting aspects of the obtained temporal generalization profile can be noted. First, along the diagonal, decoding was significant already before T2 presentation (Fig. 3H). Neural activity before stimulus presentation thus predicted later stimulus report, in line with recent reports highlighting pre-stimulus fluctuations in neural activity that correlate with stimulus visibility (e.g. Linkenkaer-Hansen et al. 2004; Mathewson et al. 2009; Iemi et al. 2017). Because this analysis only included T1-correct trials, this pre-stimulus effect cannot easily be explained in terms of differences in T1-performance. Nevertheless, we cannot rule out that T1-related processes affected these results, since others have shown that the extent of T1 processing may be different for T2 blink and T2 no-blink trials (Ouimet and Jolicœur 2007; Slagter et al. 2017). The second interesting aspect about this overall visibility effects was that the square-shaped pattern was much stronger and clearer. This stimulus-independent profile is likely related to an amplified P3-like component on T2 reported trials compared to T2 missed trials, which is picked up by the classifier algorithm (see Supplementary Fig. 5 for ERF results) (Sergent et al. 2005; Meijs et al. 2018).
Valid expectations do not enhance early sensory representations of stimulus identity
In our final set of decoding analyses, we aimed to explore the link between neural recordings, expectations and conscious reports. Behaviourally, we observed that valid expectations increased the chance that a stimulus was subsequently reported and to test whether this may relate to the sharpening of sensory representation of T2 identity, decoding performance was compared between trials where participants had a valid (Fig. 4A) or invalid (Fig. 4B) expectation at lag 3 (only T1-correct trials were included). Importantly, only between-task analyses were performed in which the decoder was trained on the oddball task (no T1–T2 predictability) to prevent the decoding being biased by the predictive relationship between T1 and T2 in the first place, which is inherently present in our AB task and difficult to circumvent. Training on the AB task would also incorporate undesirable factors (e.g. conscious access: valid trials are reported more often than invalid trials) into the classifier training.
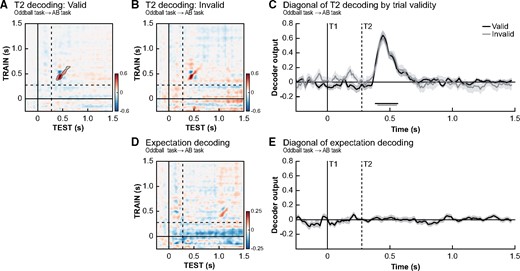
Expectation validity. Temporal generalization matrices for the decoding of T2 identity at lag 3 for valid trials (A) and invalid trials (B) separately. Only trials where T1 was correctly identified were used. (C) No significant differences (valid − invalid) between the two conditions were observed, indicating T2 identity could be decoded equally well on valid and invalid trials (significant time periods indicated by horizontal lines at bottom of panels, FDR-correct P-value <0.05), thus suggesting early sensory representations were not affected by the validity of prior expectations. (D, E) It was not possible to decode participant’s T2 stimulus expectations based on a between-task decoder trained on the oddball task data and tested on the attentional blink data. Timing is relative to T1 onset, and the dashed lines indicate the onset of T2 stimuli at lag 3. We did not find any evidence for the existence of neural stimulus templates.
These decoding analyses revealed no effect of prior knowledge on the sharpening of sensory representations (T2 identity decoding was similar for valid and invalid trials, Fig. 4C, P > 0.9). Because several studies have shown that the effects of expectation may interact with (or even depend on) attention (Kok et al. 2012; Jiang et al. 2013), we aimed to rule out that the absence of expectation-related sharpening could be attributed to a lack of attention for targets presented at lag 3 (i.e. during the ‘blink’ period). However, similar results were obtained for stimuli presented at lag 10 and hence out of the AB period (Supplementary Fig. 3). Furthermore, we observed the same pattern of results in a control analysis with all the 28 participants that were included in the behavioural analyses. This eliminates the possibility that any absence of a significant effect may be related to the selection of participants (Supplementary Fig. 4). To verify whether there were any general neural effects of expectation validity, we also decoded whether a trial was valid or invalid regardless of T2 identity within the AB task (training and testing within the AB task). This control analysis, while matching the number of seen/unseen trials within each condition (valid vs. invalid), did not reveal significant decoding of validity (all cluster P-values >0.46). A final control analysis in which we trained the classifier on the difference between oddball stimuli and standard stimuli in the oddball task and tested the difference between valid and invalid trials in the AB task did also not reveal any effects of expectation violation (across task classification), but did reveal expectation violation signals in the oddball task itself (see Supplementary Fig. 6A).
The lack of a decoding difference between valid and invalid trials makes it unlikely that participants’ expectations induced neural ‘perceptual templates’ in the current task design. On valid trials, when participants’ expectation about the upcoming T2 was equal to the T2 that was presented, a decoder trained to distinguish T2 identity in the oddball task should have been able to pick up the representation of the target (expectation) before target presentation (target and expectation matched). Similarly, on invalid trials one would have expected inverse decoding, because participant’s expectation was opposite to the T2 stimulus that was later presented (target and expectation mismatched; Kok et al. 2017). To fully rule out that we may have missed expectation-induced sharpening, we performed a final analysis in which we grouped trials based on the expected T2 stimulus instead of the actually presented T2 stimulus. Only T2-absent and lag 10 trials were used, so no T2 stimulus was ever presented at lag 3 in order to prevent any contamination of the results by actual stimuli. But again we did not observe the instigation of expectation-related perceptual templates (all P > 0.221, Fig. 4D and E).
Discussion
In this report, we investigated the relationship between expectations and conscious access and the role of stimulus relevance on stimulus-specific neural representations. Using an AB paradigm in which the identity of T1 predicted the likelihood of the T2, we found that T2 stimuli confirming T1-induced expectations are more likely to be consciously reported than T2 stimuli that violate these expectations. This is in line with studies that have shown that the speed (Chang et al. 2015; Pinto et al. 2015; De Loof et al. 2016) and accuracy (Stein and Peelen 2015; Meijs et al. 2018) of stimulus detection is strongly influenced by expectations. While control analyses in our experiment ruled out that response biases fully explain our effect, future experiments may benefit from the use of other measures, e.g. by asking participants to rate the subjective strength of the targets, such as done with the Perceptual Awareness Scale (Overgaard et al. 2006). Interestingly, by including neutral expectation trials we showed that the effect of expectations was mainly driven by a performance benefit for valid expectations, at least in the AB interval (at short lags) (see also Pinto et al. 2015). Thus, at the time that targets are often missed, conscious access becomes more likely when expectations are confirmed (valid) compared to when they were absent or invalidated (Fig. 1C).
We have also presented a series of multivariate decoding analyses, in which we first showed that it was possible to reliably decode the identity of a target letter from MEG data, both when the identity of this letter was task-irrelevant in an oddball task and when it was task-relevant and actively searched for in an AB task. Furthermore, the combination of both within- and between-task decoding analyses revealed that stimulus-specific neural representations underlying the early stages of information processing (on-diagonal generalization) were highly similar for both tasks and independent of stimulus relevance and the outcome of the perceptual decision (whether T2’s were reported or missed in the AB task; Mostert et al. 2015; King et al. 2016). Similar early decoding profiles were observed for (i) task-irrelevant letters in the oddball task, (ii) task-relevant, but missed T2’s in the AB task and (iii) task-relevant and reported T2’s in the AB task. These results suggest that early stimulus-specific neural processing stages are not modulated by either attention to the stimulus dimension [stimulus (task) relevance] nor conscious access to the target identity (report), in line with previous findings (Fahrenfort et al. 2017). The absence of decoding at later time points when T2 was task-irrelevant furthermore suggests that the representation of target letter identity is not ‘broadcasted’ to higher levels of the cortical hierarchy when this feature is task-irrelevant (Marti and Dehaene 2017). Usually, it is assumed that compared to nonconscious perception, conscious report is related to widespread neural activity (up to frontal areas) and more stable neural representations (Lamme and Roelfsema 2000; Dehaene et al. 2006; Dehaene and Changeux 2011; Schurger et al. 2015). Indeed we observed that within the AB task, when targets were task-relevant, attended and reported, T2 identity could be decoded for a longer time frames and was more stable, reflected in a square-shaped decoding profile (Ress et al. 2000; Jehee et al. 2011; Mostert et al. 2015; King et al. 2016; Marti and Dehaene 2017; van Vugt et al. 2018). Additionally, we observed a non-specific (regardless of T2 identity or expectations) difference between T2 reported and missed trials, of which the late sustained part presumably corresponds to previously observed P3 modulations related to conscious report (Kranczioch et al. 2003; Sergent et al. 2005; Meijs et al. 2018) and task relevance (Pitts et al. 2014; et al.2014). We also observed that fluctuations in neural activity (or overall ‘brain state’) before T2 presentation influenced whether or not the stimulus was later reported, as has been recently demonstrated by several others using at threshold or backward masking tasks (Linkenkaer-Hansen et al. 2004; Busch et al. 2009; Mathewson et al. 2009; Pincham and Szucs 2012; de Gee et al. 2014; Petro and Keil 2015; Iemi et al. 2017). These fluctuations may reflect differences in T1 processing (Slagter et al. 2017).
Next, in order to explain the behavioural effects of expectations on conscious access, we looked at the neural representations of T2 identity conditioned on the validity of single-trial expectations. We hypothesized that the early neural representation of validly expected stimuli would be ‘sharpened’, and that this improvement in improved stimulus representation would relate to enhanced stimulus report (Kok et al. 2012; Cheadle et al. 2015). However, we did not observe this effect. Moreover, no evidence for expectation-induced pre-stimulus perceptual templates was observed, although these effects have been recently reported in a different task context (Kok et al. 2017). One possible explanation for this discrepancy in findings is that it may take longer than 300 ms to encode T1 and translate the T1-prediction into a sensory representation. Nevertheless, in our study, the influence of expectations on conscious report was not reflected in modulations of sensory representations prior to T2 presentation or at early stages in the processing hierarchy (for a similar conclusions in a different paradigm see e.g. Rungratsameetaweemana et al. 2018; Alilovic et al. 2019; Weaver et al. 2019). It could be that expectations can influence perception at multiple levels of the cortical hierarchy, with different processes being affected depending on the type of target stimuli or expectations being involved. In our AB paradigm, participants learned conditional relationships between two letter stimuli. Consequently, the expectations in our task were most likely represented at a higher level of the cortical hierarchy (i.e. semantic) as compared to the rather low-level perceptual expectations in earlier studies (Kok et al. 2012, 2017). As a consequence, the early sensory representation of the targets that we pick up based on the oddball task may not have been optimal for detecting expectation-based modulations of T2 processing. Therefore, the ‘format’ in which the expectations were represented may simply have been different (e.g. verbally or motor code) than that of the incoming visual information and hence interactive effects may not have been visible at the sensory level (Bang and Rahnev 2017; Rungratsameetaweemana et al. 2018; Rungratsameetaweemana and Serences 2019). Future research would benefit from using tasks that can capture the full stimulus processing hierarchy involved in processing the relevant stimuli within the experimental task (sensory, semantic, decision).
In line with a recent study (Rungratsameetaweemana et al. 2018), we did not find any reliable time-locked decoding effects that we could relate to the behavioural benefits of expectations, suggesting it may be relatively subtle and hard to detect (see also Meijs et al. 2018). Expectations may only affect small populations of neurons and such effect may be hard to detect using analyses based on data from multiple sources (which is the case here because analyses were performed on the sensor level). Such effects may be more readily picked up with analyses in the source domain. Alternatively, there are other possible implementations of expectations, such as the modulation of the onset of components related to conscious perception (Melloni et al. 2011). Other potentially interesting signatures are the power and/or phase of alpha oscillations because a number of studies have shown that low pre-stimulus alpha power is predictive of subsequent conscious stimulus perception (Linkenkaer-Hansen et al. 2004; Busch et al. 2009; Mathewson et al. 2009; de Lange et al. 2013; Sherman et al. 2016; Benwell et al. 2017; Iemi et al. 2017). Furthermore, it has been shown that expectations lead to changes in pre-stimulus alpha in a way that predicts stimulus visibility (Mayer et al. 2016). Future studies are required to unravel the effect of expectations on conscious access in the frequency domain.
A number of conclusions can be drawn from this study. First, we have shown that the neural representation of letters presented during rapid serial visual presentation can be reliably decoded from neural activity as measured by MEG. While early, sensory representations of letters could be decoded regardless of the behavioural state of the subject, later and more stable multivariate activity patterns were dependent on top-down modulations by task relevance, attention and conscious report. Second, we have shown that valid expectations enhance the likelihood of visual target detection but we did not find evidence that this was due to increased ‘sharpness’ of the relevant sensory representations.
Data availability
The data and analysis scripts used in this article will be made publicly available after manuscript acceptance at the following web address http://hdl.handle.net/11633/di.dccn.DSC_3018015.05_065. Prior to accessing and downloading the shared data, users must create an account. It is possible to use an institutional account or a social ID from Google, Facebook, Twitter, LinkedIn or Microsoft. After authentication, users must accept the Data Use Agreement (DUA), after which they are automatically authorized to download the shared data. The DUA specifies whether there are any restrictions on how the data may be used. The Radboud University and the Donders Institute for Brain, Cognition and Behaviour will keep these shared data available for at least 10 years.
Acknowledgements
This work was supported by grants from the European Research Council (ERC-2015-STG_679399, awarded to H.A.S.; ERC-2015-STG_678286 awarded to F.P.d.L.) and The Netherlands Organisation for Scientific Research (NWO Vidi grant 452-13-016, awarded to F.P.d.L.).
Conflict of interest statement. None declared.
References
