


Abstract
Retinal neural transmission represents a key function of the eye. Identifying the molecular components of this vital process is helped by studies of selected human genetic eye disorders. For example, mutations in the calcium channel subunit gene CACNA1F cause incomplete X-linked congenital stationary night blindness (CSNB2 or iCSNB), a human retinal disorder with abnormal electrophysiological response and visual impairments consistent with a retinal neurotransmission defect. To understand the subcellular basis of this retinal disorder, we generated a mouse with a loss-of-function mutation by inserting a self-excising Cre-lox-neo cassette into exon 7 of the murine orthologue, Cacna1f. Electroretinography of the mutant mouse revealed a scotopic a-wave of marginally reduced amplitude compared with the wild-type mouse and absence of the post-receptoral b-wave and oscillatory potentials. Cone ERG responses together with visual evoked potentials and multi-unit activity in the superior colliculus were also absent. Calcium imaging in Fluo-4 loaded retinal slices depolarized with KCl showed 90% less peak signal in the photoreceptor synapses of the Cacna1f mutant than in wild-type mice. The absence of post-receptoral ERG responses and the diminished photoreceptor calcium signals are consistent with a loss of Ca2+ channel function in photoreceptors. Immunocytochemistry showed no detectable Cav1.4 protein in the outer plexiform layer of Cacna1f-mutant mice, profound loss of photoreceptor synapses, and abnormal dendritic sprouting of second-order neurons in the photoreceptor layer. Together, these findings in the Cacna1f-mutant mouse reveal that the Cav1.4 calcium channel is vital for the functional assembly and/or maintenance and synaptic functions of photoreceptor ribbon synapses. Moreover, the outcome of this study provides critical clues to the pathophysiology of the human retinal channelopathy of X-linked incomplete CSNB.
INTRODUCTION
Retinal neurotransmission is the biological process that enables the visual signal generated by the phototransduction cascade in photoreceptors to move across the retina to the retinal ganglion cells for translocation to the brain. Several genetic disorders are known from electroretinographic analysis to be defective in retinal neurotransmission. One of these, the incomplete form of X-linked stationary night blindness (iCSNB, also referred to as Type 2 or CSNB2) is characterized by the reduced function of the rod photoreceptor pathway and cone system (1,2). Patients with CSNB2 show highly variable clinical features that may include reduced visual acuity, impaired night vision, high myopia or hyperopia, nystagmus and strabismus (1,3–5). These manifestations are the consequence of loss-of-function and missense mutations in the human Cav1.4 calcium channel subtype gene CACNA1F (6,7), which is expressed preferentially in the retina (6,7) but also detected in other tissues (8). In transient expression systems, Cav1.4 shows sensitivity to dihydropyridine, slow inactivation kinetics and a sustained voltage current over a large range of membrane potentials (8,9).
We have used targeted mutagenesis of the mouse homologue of CACNA1F, Cacna1f (9,10), to establish the functional and biological roles of the Cav1.4, an α1 calcium channel subunit, in the retina and in the pathophysiology of CSNB2. From the detailed phenotypic analysis of a loss-of-function Cacna1f mutation in the mouse, we found that one of the functional consequences of such a mutation, and presumably of at least some of the mutations of CACNA1F in patients with CSNB2, is to cause the developmental failure or loss of photoreceptor ribbon synapses and consequently profound deficits in synaptic transmission from photoreceptor to second-order retinal neurons.
RESULTS
Targeted disruption of Cacna1f
Mutant mice derived by a targeting disruption strategy (Fig. 1A) were recognized by a residual 70 bp insertion in exon 7 of Cacna1f (PCR analysis, Fig. 1B). DNA sequencing of exon 7 in such mutant mice revealed the expected in-frame (TAA) stop codon at position 305 (data not shown), which is predicted to result in the premature termination of Cacna1f translation. X-linked transmission of this 70 bp insertional mutation was observed consistent with the target having been inserted in the X-chromosome Cacna1f gene. RT–PCR analysis of mouse retinal transcripts was performed to confirm the disruption of Cacna1f in mutant mice. RNA isolated from both mutant male and homozygous mutant female mice showed a 70 bp insertion (Fig. 1C).
Mouse electroretinography
Electroretinograms were obtained in nine Cacna1f-mutant and seven wild-type control mice. Recordings obtained in scotopic conditions are shown in Figure 2A from an adult wild-type male mouse (left) and from a Cacna1f-mutant male littermate (right). At low stimulus intensities (upper traces), ERGs from the Cacna1f mutant showed poor and inconsistent responses, whereas in the normal mouse a b-wave of high amplitude developed. At higher stimulus intensities in the mutant mouse, an a-wave appeared with a threshold comparable to the one of normal littermates, but neither an b-wave nor oscillatory potentials could be detected. At the highest stimulus intensities in the mutant mouse, a small positive wavelet was present after the initial a-wave. This wavelet is of receptoral origin as the responses after blockade of synaptic transmission by Co2+ (Fig. 2B) in a wild-type mouse (left side of panel) were comparable to the responses obtained in an untreated mutant mouse (right side of panel). So both ERG components, the small positive short-latency wavelet observed at high intensity and the long-latency positive response observed at lower stimulus intensity are dependent exclusively on photoreceptor activity.
The amplitude and sensitivity of the remaining a-wave in the mutant mice were quantitated using the Michaelis–Menten hyperbolic equation (Fig. 2C). The a-wave in the mutant animals was found to have a smaller amplitude (Vmax: 200.8 versus 303.2 µV) than in the wild-type littermates, but a slightly higher sensitivity (K: 0.38 versus 0.99 cd s/m2).
ERG recordings in wild-type mice performed under photopic conditions to isolate the cone response were dominated by a positive wave at all background intensities tested (Fig. 2D). A small a-wave could be measured at background intensities <1.8 log cd/m2. In contrast, no reliable response could be detected in the Cacna1f mutant at any of the background intensities.
The absence of a scotopic b-wave and cone ERG signal in the Cacna1f mutant is consistent with a defect in neurotransmission between photoreceptors and second-order neurons, particularly bipolar cells. Similarly, cortical activation (as measured by visually evoked potentials, VEP) could not be detected in the mutant mice, while under similar conditions, a large cortical potential was identified in all wild-type littermates (Fig. 2E). To confirm the absence of input signal to the visual cortex, multi-unit activity was recorded in the superior colliculus, the main recipient of the retinofugal fibers (Fig. 2F). Whereas important spiking activity could easily be recorded in the wild-type animals (n=3), no activity could be detected in the Cacna1f mutant (n=3) despite several electrode penetrations. To ensure that the absence of response was not due to the animal condition or to defective electrodes, auditory activity was recorded in subsequent penetrations and judged qualitatively normal in the Cacna1f-mutant mice.
Calcium imaging in retinal slices
We assessed differences in calcium signaling in retinas of Cacna1f-mutant (hemizygous males and homozygous females) and wild-type mice (hemizygous males and homozygous females) by imaging fluorescent calcium-indicator dyes in living retinal slices. This technique allows changes in intracellular [Ca2+] to be quantitated and assessed in specific layers of the retina to determine the types of cells in which Ca2+ influx is altered. Retinal slices exposed to 40 mm K+, a treatment which moderately depolarizes the neurons and glia, responded with an increase in intracellular [Ca2+] in all layers of the retina (Fig. 3A). The time course of the calcium signal closely followed the time course of exposure to high K+ (Fig. 3C), and the increase in the amplitude of the signal in the outer retina (OR) was especially pronounced in the OR. The most intense Ca2+ signals were localized to the outer plexiform layer (OPL), a region of dense synaptic connections between rod and cone photoreceptors, and second-order neurons where they appeared in individual or clustered structures ∼1–5 µm across. As these are approximately the dimensions of rod and cone synaptic endings, this pattern of activity suggests that voltage-gated Ca2+ channels in the pre-synaptic terminals of photoreceptors produce large increases in intracellular [Ca2+] calcium signals. In contrast, retinal slices from Cacna1f-mutant mice (hemizygous males and homozygous females) developed markedly reduced calcium signals in the OR (Figure 3B and 3D), while essentially normal changes in intracellular [Ca2+] were recorded in the other retinal layers. For the time-course measurements (Fig. 3C and D), the retina was subdivided into three regions termed the OR consisting of the photoreceptor outer segments (OS), the outer nuclear layer (ONL) and the OPL, the inner retina (IR) consisting of the inner nuclear layer and the inner plexiform layer (IPL) and the ganglion cell layer (GCL). The summary of the calcium imaging data (Fig. 3E) shows that only calcium signaling in the outer retinal layers was significantly affected by the Cacna1f mutation. The peak calcium signal in the OR (photoreceptors and OPL) of Cacna1f-mutant mice (+0.48±0.14%; n=7) was reduced by 90% compared with wild-type mice (+4.64±0.77%; n=4). The IR and GCL responded similarly in Cacna1f-mutant mice (IR 2.98±0.33%; GCL 4.10±0.65%; n=7) and wild-type mice (IR 3.28±0.66%; GCL 3.74±1.37%; n=4).
Immunocytochemical analysis of Cacna1f-mutant retina
Histological and immunocytochemical studies of wild-type and Cacna1f-mutant mouse retinas showed that Cav1.4 immunoreactivity (hereafter termed Cav1.4 for convenience) was eliminated from the OPL and IPL of both hemizygous Cacna1f-mutant mice (Fig. 4A and B) and homozygous mutant female mice (data not shown). Photoreceptor cell bodies, inner and OS appeared to be unaffected by the absence of Cav1.4, as labeling with peanut agglutinin lectin (cone photoreceptors) or Rho-4D2 (rod photoreceptors) revealed similar structures in both wild-type and mutant mice (data not shown). The inner layers of the retina also appeared to be unaffected in Cacna1f-mutant retinas, as labeling for glutamic acid decarboxylase (GAD65) in GABAergic amacrine cells was the same in wild-type and Cacna1f-mutant retinas (Fig. 4G and H). However, second-order neurons were markedly affected. Labeling of wild-type retinas for the rod on-bipolar cell marker by PKCα showed bipolar cell dendrites terminating in the OPL of the wild-type retina (Fig. 4C); in contrast, in the Cacna1f mutant, rod bipolar cell bodies appeared flattened and rougher than in the wild-type control, axon terminals appeared irregular and dendritic appendages extended beyond the OPL, far into the ONL (Fig. 4D). Similarly, labeling of wild-type retinas with the horizontal cell marker, calbindin, showed strong labeling of horizontal cell bodies and a dense plexus of horizontal cell processes in the OPL (Fig. 4E), whereas in the mutant retina labeling for calbindin was much reduced in the OPL, and cell processes extended far into the ONL (Fig. 4F). In contrast, calbindin-expressing amacrine and ganglion cells appeared identical in the wild-type and mutant retinas. In histological sections labeled with toluidine blue, the overall structure of the Cacna1f-mutant retinas appeared to be unaffected except that the OPL was much thinner than normal (Fig. 4I and J). To investigate the possibility that this was due to displacement of synaptic terminals out of the OPL and into the ONL thus forming potentially ectopic synapses on the aberrant dendrites of second-order neurons, we double-labeled for the post-synaptic marker, metabotropic glutamate receptor (mGluR6) on-bipolar cell dendritic tips and the pre-synaptic marker, bassoon, at the base of the synaptic ribbon in synaptic terminals of rods and cones. The wild-type retina showed punctate labeling in the OPL with strong co-localization of mGluR6 and bassoon, whereas the Cacna1f mutant showed greatly reduced labeling for both markers in the OPL and infrequent bassoon or co-localization in the ONL. Bassoon labeling in the IPL of the Cacna1f-mutant retina, however, was the same as that in the wild-type retina (Fig. 5). The appearance of photoreceptor terminals and the OPL in the mutant retina were significantly different from that of the wild-type retina (Fig. 6). A normal rod synaptic terminal contains two lateral horizontal processes in addition to two vertical bipolar processes opposite a single synaptic ribbon (11). Several examples of these invaginations are evident in electron micrographs of the wild-type retina (Fig. 6). In contrast, we found no evidence of bipolar or horizontal cell invaginations into synaptic terminals of mutant retina (Fig. 6). In addition, outside of some rare exceptions, (Fig. 6, arrow) synaptic ribbons were essentially absent from the OPL of the Cacna1f-mutant retina.
DISCUSSION
We have constructed a Cacna1f-mutant mouse by targeted gene disruption leading to a loss-of-function mutation of the Cav1.4 calcium channel. Loss-of-function CACNA1F mutations (nonsense and frameshifts) are detected in nearly 60% of CSNB2 patients (12). Phenotypic analysis of the Cacna1f-mutant mouse showed loss of retinal neural transmission and pre-synaptic calcium signaling in the OPL. Moreover, this Cacna1f mutant also revealed the dendritic sprouting of second-order neurons and the virtual absence of photoreceptor ribbon synapses. The absence of post-receptoral ERG responses and the diminished photoreceptor calcium signals are consistent with a loss of Ca2+ ion channel function in photoreceptors and, consequently, loss of retinal neurotransmission. Moreover, the absence of the cortical and collicular responses in this mutant mouse gives a strong indication that these mice are functionally blind.
In a highly organized series of developmental events culminating at P14, the horizontal and bipolar cell processes invaginate the rod photoreceptor terminal to form the characteristic tetrad of two lateral horizontal cell and two central bipolar cell processes opposite the synaptic ribbon in the OPL (11,13). Glutamate release at these specialized synapses, as in conventional synapses, is in response to calcium influx via voltage-gated calcium channels clustered close to the ribbon. Recent work has localized Cav1.4 to the active zone of rod photoreceptors, suggesting that these channels mediate the release of glutamate in the OR (14,15).
Ca2+ imaging in the Cacna1f-mutant retina showed normal depolarization-evoked Ca2+ signals in all regions of the retina except those where rod and cone photoreceptors and their pre-synaptic terminals reside. The Ca2+ concentration increase in the OR was only 10% of the signal in control animals, consistent with a massive loss of voltage-gated Cav1.4 channel activity in rod and cone photoreceptors. The source of the remaining Ca2+ signal is not clear but may be due to depolarization-induced Ca2+ entry through Cav1.3 (α1D) channels, which appear to be presented in mammalian cones (14,16). The remnant signal may arise in part from scattered light from other retinal layers where additional subtypes of Ca2+ channels are present. We found a trend towards a mild reduction in Ca2+ signal in the IR. The total preservation of Ca2+ signaling in the GCL is expected, as there has been no indication that Cav1.4 channels are present in these cells. The pattern of Ca2+ signal loss in the Cacna1f-mutant retina is consistent with the notion that Cav1.4 channels are responsible for synaptic transmission from photoreceptors.
The absence of retinal output in the mouse (Fig. 2) is somewhat puzzling as near normal visual function is measured in patients presenting with the incomplete form of CSNB (1,2). As documented previously, ERGs in CSNB2 patients showed an electronegative scotopic bright-flash response as in the mouse model, but in humans large oscillatory potentials were recorded at high stimulus intensity suggesting the activation of the IR. Furthermore, contrary to the mouse model where no cone activity could be identified, the cone responses in CSNB2 patients show a definite a-wave but no identifiable b-wave and no oscillatory potentials. A change in the operational range of the cone output was proposed to explain the dichotomy between the near normal oscillatory potentials in scotopic conditions (even cone-driven ones) and their absence in photopic conditions (2). Patients are also present with variable, often mild, visual acuity decrease, mild or absent nystagmus and no color vision defect (1,2). However, it remains that despite similar functional disruption in the Cav1.4 calcium channel, the Cacna1f ERG signal of the mutant mouse presents with characteristics different from the human ERG, suggesting that in humans, the photoreceptor synaptic activation through voltage-dependent calcium channels is not under the unique control of the Cav1.4 subunit (17). For example, Ca2+ permeable cyclic nucleotide gated channels appear to have supporting role in the photoreceptor output synapse (18).
A pronounced alteration in the morphology of second-order neurons was observed in the Cacna1f-mutant retina (Figs 4 and 5). The most striking difference was that rod bipolar and horizontal cell processes extended outside the OPL and far into the ONL. Such cellular remodeling in the mammalian retina was originally observed in studies of retinal detachment (19,20). The intermittent co-localization of pre- and post-synaptic markers in the ONL, along with ONL labeling of the synaptic ribbon-associated protein, bassoon, suggests that the presence of ectopic photoreceptor synapses. Electron micrographs of the mutant retina show an absence of bipolar and horizontal cell dendritic invaginations into synaptic terminals in the OPL, coupled with an almost complete absence of synaptic ribbons. These unexpected observations indicate a possible role for Cav1.4 in the assembly and localization of the synaptic ribbon to the photoreceptor active zone.
Disrupted targeting of the synaptic ribbon to the active zone during development has also been suggested as a reason for ectopic synaptogenesis in the bassoon mutant (21). Bassoon, a key component of the pre-synaptic cytomatrix at the active zone (CAZ) in conventional synapses, is located at the base of the synaptic ribbon where it is anchored to the plasma membrane in photoreceptors. Bassoon-null retinas exhibit many of the same morphological changes as seen in the Cacna1f mutant, namely dendritic sprouting of second-order neurons and ectopic synapses in the ONL. These observations led to the conclusion that bassoon is required during retinal development for the anchoring of the synaptic ribbon to the active zone (21).
The CAZ in conventional synapses is a combination of several core structural proteins that not only act to define the active zone but also, through protein–protein interactions, organize the clustering of other plasma membrane proteins such as voltage-gated calcium channels (22). The synaptic ribbon is believed to be the equivalent of the CAZ (23). Absence of similar protein–protein interactions between Cav1.4 and synaptic ribbon-associated proteins may prevent the assembly of the synaptic ribbon, destabilize it or hasten its degradation because of failed localization to the active zone.
From targeted mutagenesis in the mouse, several other proteins in the photoreceptor pre-synaptic region are known to play important roles in the formation of the photoreceptor ribbon synapse and neurotransmission. In addition to bassoon, these include the β2-subunit of the voltage-dependent calcium channel (24), the calcium-binding protein 4 regulator of Cav1.4 (CaBP4) (25) and laminin β2 (26). Common features of these mice include unanchored ribbons, attenuated or absent b-wave ERG responses, reduction in Cav1.4 levels in the outer plexiform level (VGCC β2 and CaBP4) and ectopic synapses (VGCC β2 and CaBP4), suggesting a general interrelationship of these additional proteins in the functional development of ribbon synapses.
The organization of the protein components of this structure, along with the clustering of other proteins associated with the neurotransmitter release mechanism such as Cav1.4, is only beginning to be understood. Our work shows that this channel subunit protein is required not only for calcium influx for neurotransmitter release but also has a greater role in the organization of the synapse.
Over 75 different mutations in CACNA1F are known to cause the incomplete form of X-linked CSNB (CSNB2) (http://archive.uwcm.ac.uk/uwcm/mg/hgmd0.html; NTBH unpublished data) (6,7,12). Thus, the understanding of the detailed phenotype of the Cacna1f-mutant mouse is highly relevant to an appreciation of the pathophysiology underlying this CSNB condition. There is extensive clinical variability in the expression of the CSNB2 phenotype (5) which is further reflected in the finding of a CACNA1F mutation in a family with retinal and optic disc atrophy (27) and in a family reported to have X-linked cone–rod dystrophy (28). In addition, there may be rare examples of individuals, as yet to be identified, with an incomplete CSNB phenotype who carry mutations in the other genes that play a role in assembly of a functional pre-synaptic terminal (e.g. calcium channel β2-subunit, CaBP4, bassoon and laminin β2 genes).
The premature truncation mutation that we constructed and backcrossed onto a C57Bl/6 genetic background appears to reflect a severe form of CSNB2 and phenotypically more like a cone–rod dystrophy. Judging from the detailed phenotypic characterization of patients with CSNB2, it is clear that the clinical variability of these patients is not entirely correlated with the CACNA1F genotype but also influenced by modifying genetic factors (5). Illustrating this is a CACNA1F mutation that we recently identified in a Finnish family with cone–rod dystrophy (CORDX3) (28). Possibly the Finnish genetic background may, like the C57Bl/6 background, contribute to a more severe clinical phenotype. As such it will be of interest to evaluate the phenotype of other Cacna1f mutations and to establish the influence of different genetic backgrounds on rod and cone function in the mouse. In doing so, it may be relevant to keep in mind that the fovea of the human retina is extremely rich in L and M cones to the exclusion of rods, whereas the mouse retina lacks a fovea and is primarily dominated by rods. It is plausible that in this enriched and cone-homogeneous environment of the human retina the ravages of a Cav1.4 mutation is not expressed as severely as it would be in a mouse.
The Cacna1f-mutant mouse characterized in this study has provided clues to the pathophysiology which leads to the functional defects of CSNB2. The features that we observed using immunocytochemistry in this mouse clearly show that the ribbon synapses at the OPL are disrupted and essentially lost (Figs 4 and 5) and readily provides an explanation for the retinal neurotransmission deficit of CSNB2. An explanation for the high myopia, nystagmus and strabismus are not obvious and must await further study. In this regard, this mouse also provides the opportunity for investigating the expression of the murine orthologue of CACNA1F, Cacna1f, and the function of their encoded protein, Cav1.4, outside of the retina as it relates to the phenotype of CSNB2 patients.
The Cacna1f-mutant mouse may also provide the opportunity to investigate the role of modifying genes in influencing the phenotypic variability observed in CSNB. Finally, this Cacna1f-mutant mouse presents the opportunity for initiating the development and assessment of treatment options for patients with CSNB2.
MATERIALS AND METHODS
Construction of the Cacna1f targeting vector
The strategy used to disrupt Cacna1f is shown in Figure 1(A). An exon 9 PCR product was used to screen a λTK gene targeting phage library (29) via plaque lifts. Resulting Cacna1f homologous clones were restriction mapped and partially end sequenced using the primer λTK 1a revs 1 (AAC ACT CGT CCG AGA ATA AC). A selected 12 kb homology clone was selected to introduce a unique SrfI site into exon 7 via transplacement recombination (30) using annealed 65 bp mutagenesis oligos cloned into the recombination plasmid πANγ: Cex7mutF, GATCCGTTCATGCACACTGAACCATACCGAGTGGCCCGGGCGCTGGCCAGGACCCAACGGTGGCT and Cex7mutR, CTAGAGCCACCGTTGGGTCCTGGCCAGCGCCCGGGCCACTCGGTATGGTTCAGTGTGCATGAACG. A single clone containing the engineered SrfI site was then used to clone in the positive selection cassette, pACN (31).
Targeting of ES cells
Targeting vector DNA (150 µg) was cut using Not1 and introduced into R1 ES cells using a Gene Pulser II electroporator (BioRad). Following 2 days on non-selective media, cells were selected on 300 µg/ml G418 and/or 300 µg/ml G418 and 2×10⁻⁷m FIAU [1-(2-deoxy-2-fluoro-b-d-arabinofuranosyl)-5-iodouracil]. Resistant clones were picked on days 5–10 of selection and cultured in wells with a fresh layer of irradiated mouse embryonic fibroblasts (MEFs). Individual clones were grown, split further and frozen (10% DMSO, 90% fetal bovine serum) at −80°C for storage again using 12-well tissue culture dishes with fresh MEFs. ES cells from each clone were also grown on gelatinized wells without MEFs for DNA extraction. Following collection in DNA lysis buffer, proteinase K treatment, phenol chloroform extraction and DNA precipitation. PCRs were carried out using 35 cycles of 94°C for 1 min, 57°C for 1 min, 72°C for 4 min, 72°C for 10 min using the following flanking and internal primers: pACNF2, CCA TGG AGA TCC ATA ACT TCG TAT AAT GTA TGC and Int12R, CCA TGG AGG TGG ACT GGT CTC AAA TTC. A flanking probe (homologous to exons 12–14 of Cacna1f and external to the 3′ extremity of the vector) was also used for genomic Southern blotting using Sma1 and PspA1.
Following identification of five targeted ES cell lines via PCR and Southern blotting, targeted lines were karyotyped via a previously described method (32). Twenty to 40 intact spreads were counted per cell line to ensure a minimum of 60% diploid cells.
Generation of Cacna1f loss-of-function mice
Blastocysts were microinjected with ES cells from several individual diploid-targeted lines and transferred to 2.5 dpc CD1 foster mothers. Resulting chimeras were bred with C57BL/6 animals of the opposite sex. One male chimera showing 40% agouti pigmentation produced germline pups. DNA was extracted from tail tips of resulting agouti pups using the DNAeasy tissue system (Qiagen) and genotyped for the presence of the loxP site in exon 7 using PCR (35 cycles of 94°C for 1 min, 57°C for 1 min, 72°C for 4 min, 72°C for 10 min) and the following primers. Exon 7F, ATA TGG AAG CAG AGG AGG ACC and exon 7R, CCA GTA GAG GAC GTC TGT CCA.
Reverse transcription analysis was performed using RNA isolated from mouse retina using Trizol Reagent (Invitrogen, Burlington, ON, USA). Isolated RNA was treated with MessageClean kit (GenHunter, Nashville, TN, USA) to remove contaminating DNA and then reverse transcribed using the Qiagen Omniscript RT kit (Qiagen, Mississauga, ON, USA). The PCR reaction was performed as above using the primers: exon 7 forward primer (gac gaa tgc aca aga cat gc) and exon 9 reverse (caa gca caa ggt tga gga ca). The primers for RPGR, used as a positive control, were exon 16 forward (gca gca cct tag gct caa tc) and exon 19 reverse (agg tgt ggt tcc ttc cac ag).
Reverse transcriptase was omitted from one reaction to show the absence of genomic DNA amplification during the reverse transcription reaction. PCR products were electrophoresed on a 1.5% agarose gel containing 6% ethidium bromide. The ‘One KB Plus’ DNA ladder (Invitrogen) was used to determine product sizes.
Our studies included adult male (hemizygous) and female (homozygous) mutants and wild-type mice (30–50 days of age). The Cacna1f-mutant mice investigated were derived from at least eight cycles of back-crossing into C57Bl/6. Gender-matched wild-type littermates were used as controls in all experiments.
Electroretinography
Animal preparation.
All electrophysiological recordings were performed with the experimenter blinded to the mouse genotype. Mice (males and females of ∼2–3 months age) were dark-adapted for at least 45 min before the recording session. Under dim red light, the animal was anesthetized by an intraperitoneal injection of a mixture 90 mg/kg ketamine HCl and 5 mg/kg xylazine HCl and then placed into a stereotaxic frame. Pupils were dilated with cyclopentolate HCl 0.5%. Body temperature was kept constant at 37°C through a heated pad with rectal temperature feedback. At the end of the experiment, mice were sacrificed with an overdose of anesthetics. Tail snips were collected and frozen for subsequent genotyping.
A silver-impregnated nylon fiber (Retina Technologies, Scranton, PA, USA) was laid down on the corneal surface as the active electrode. Platinum subdermal electrodes (Grass Instruments, Quincy, Mass, IL, USA) were inserted at the base of the nose (reference) and at the right hind leg (ground). Electrodes were connected to a differential amplifier and the signal amplified 10 000-fold with an opened bandwidth of 3–1000 Hz (P511, Grass Instruments). Three hundred points were digitized at a sampling rate of 1000 Hz (A/D Instrument converter, GW Instruments, Summerville, SC, USA).
Recordings.
In complete darkness, a series of stimuli with increasing intensities spanning from −4.8 log units to the maximum flash intensity (10 cd s/m2 measured at the corneal surface; 0 log attenuation; PS3 photostimulator, Grass Instruments) in steps of 0.4 log units (Kodak Wratten no. 96 neutral density filters) were delivered in a Ganzfeld stimulator (LKC Technologies). Five responses were acquired with an interstimulus interval of at least 5 s.
Recordings in photopic conditions were performed after 5 min of exposure to a background intensity of 150 cd/m2. Flash intensity was maximal (10 cd s/m2) and provided at a rate of 0.9 Hz, against background intensities varying between 5 and 150 cd/m2. Ten to 20 responses were averaged, and three traces were acquired per background intensities tested.
Analysis.
The a-wave amplitude was measured from the baseline to the most negative trough. The b-wave was measured from the a-wave trough to the maximum positive peak which follows that trough, after the signal was processed through a low-pass finite impulse response filter (cutoff frequency of 50 Hz, −80 dB stopband; Superscope II, GW Instruments) to eliminate the overlying high frequency oscillatory potentials.
The intensity-response function for the a-wave was fitted with a Michaelis–Menten hyperbolic equation: V(I)=Vmax [In/(In+Kn)], where Vmax is the maximum amplitude response and is an indicator of the total number of generators contributing to the signal, K (sensitivity) is a constant that describes the luminance required to produce a response one-half of the maximum response and is a reflection of the ability of the system to transduce the input signal and ‘n’ is a dimensionless scaling parameter. Data were fitted by this equation using a least-squares method after 100 iterations without constraints on values for Vmax, K and n (Deltagraph 4.0 software, SPSS Inc.).
Cobalt chloride injections.
A quantity of 0.5 µl cobalt chloride 2 mm was injected into the vitreous cavity of three wild-type mice through a Hamilton syringe with a 30-gauge needle. The syringe was mounted on a micromanipulator oriented to the injection side 0.5 mm behind the ora serrate, under dim red illumination. Twenty minutes were allowed for diffusion before initiating the ERG protocol described previously. No attempt was made to allow recovery from the Co2+ effect.
Visual evoked potentials and multi-unit activity
Animal preparation.
Under general anesthesia (mentioned earlier) and after the overlying skin has been infiltrated by xylocaine HCl, a craniotomy (2×2 mm) was performed 2.5 mm lateral to the midline at the level of the occipito-parietal suture. The craniotomy site was over the visual cortex contralateral to the stimulated eye. A platinum subdermal electrode, insulated up to 0.1 mm from the tip, was gently lowered to the pial surface of the cortex with the help of a micromanipulator, 2 mm anterior and 1 mm lateral to lambda. The reference electrode was inserted in the cervical muscles, away from retinal activity sources. Multi-unit activity was recorded using a broken-tip micropipette filled with 3 m KCl (impedance between 5 and 10 MΩ) positioned with a micromanipulator within the superior and inferior colliculi using stereotaxic coordinates. The microelectrode was attached to a high-impedance probe via a chlorided silver pellet and recordings made with the animal enclosed in a grounded Faraday cage.
Recordings and analysis.
VECP responses were obtained to decreasing flash intensities, starting with an intensity of 10 cd s/m2, under mesopic background intensity (5 cd s/m2). Responses to 100 flash stimuli were averaged after 50 000× amplification with a bandwidth of 1–300 Hz. The response amplitude was measured from trough to peak and the implicit time from the stimulus artifact to the peak of the first major positive peak. Multi-unit activity was amplified 20 000× with a band-pass between 100 and 1000 kHz. Spiking activity in the superior colliculus was elicited from a single strobe flash presentation (visual stimulus). Auditory activity in the inferior colliculus was elicited by the noise from the discharge of a masked strobe flash. Electrode penetrations were serially performed every 0.3 mm for a distance of 3.3 mm starting at 5 mm anterior to Lambda and at 2 mm from the midline. The determination of the optimal response intensity was determined by audio monitoring.
Calcium imaging in retinal slices
Cacna1f-mutant and wild-type mice were sacrificed by cervical dislocation. The eyes were removed and placed in cold saline solution of the following composition (in mm): 152 NaCl, 3 KCl, 3 CaCl2, 1 MgCl2, 5 N-2-hydroxyethylpiperazine-N′-2-ethanesulfonic acid (HEPES) and 5 glucose at pH 7.4. Retinal slices were prepared by removing the cornea and lens, and then inverting the eyecup onto a piece of filter (Millipore GS 0.22 µm). Once the retina sealed to the filter, the sclera was peeled away. Retinal slices were then cut with a razor blade to a thickness of 100–150 µm and transferred to a 1 ml imaging chamber made from a 35 mm polystyrene tissue culture dish and coated with 0.01% poly-l-lysine. Slices were incubated for 1 h in the cell-permeant calcium indicator dye Fluo-4 AM (5 µm) on ice in darkness.
Retinal slices loaded with Fluo-4 were imaged using a SenSys cooled charge-coupled device camera fitted to a Nikon UM-2 fluorescence microscope employing a 10× objective (N.A. 0.25). Fluo-4 fluorescence was produced by excitation from a 100 W mercury-vapor lamp and appropriate filter set (Nikon B-2A, excitation 450–490 nm; emission 520–560 nm; dichroic 510 nm). Images were captured every 15 s with Axon Imaging Workbench v2.2. To reduce photobleaching, excitation illumination was reduced with a 1 log unit neutral density filter and the period of illumination limited by an electronic shutter. Slices were constantly superfused with saline at a rate of 1 ml/min. To measure the activity of voltage-gated calcium channels, retinal slices were superfused with a 40 mm K+ solution for 2 min. This high-concentration potassium solution was made isosmotic by adjusting [Na+] as required. At the conclusion of each experiment, bright-field images of the slices were captured. Differences between mean baseline and treatment ΔF/F ratios were tested for statistical significance with Student's t-test. Overlay images were constructed by subtracting representative baseline from peak fluorescent images using Scion Image for Windows release Beta 4.0.2, a PC adaptation of NIH Image. The resulting false-color image, representing the change in fluorescence, was then superimposed onto the bright-field image of the retinal slice using Adobe Photoshop v5.0.
Immunohistochemistry
Tissue sectioning.
Adult male C57Bl/6 control and experimental Cacna1f-mutant mice were euthanized by carbon dioxide asphyxiation, eyes were enucleated, opened and fixed in 4% paraformaldehyde–3% sucrose in 0.2 m phosphate buffer, pH 7.4 for 30–45 min. Eyes were then washed in PBS, cryoprotected overnight in 30% (w/v) sucrose, mounted in OCT (Sakura Finetek Inc.) and sectioned at 12 µm on a cryostat.
Antibodies and immunocytochemistry
The following primary antibodies were used: mouse monoclonal antibodies specific to Cav1.4 (α1F) (14), a gift from C.W. Morgans (Oregon Health and Science University); PKCα (P16520, Transduction Laboratories); Calbindin-D-28K (C9848, Sigma); GAD65 (Developmental Studies Hybridoma Bank) (33); Bassoon (VAM-PS003, Stressgen); rhodopsin (Rho-4D2), a gift from R. Molday (University of British Columbia) (34); a rabbit polyclonal antibody to mGluR6, a gift of S. Nakanishi (Kyoto University) (35). FITC-conjugated peanut agglutinin lectin was purchased from Sigma (L7381), and labeling was as by Banks and Johnson (36). We used Alexa 488 (Molecular Probes) or Cy3 (Jackson Immunoresearch) conjugated secondary antibodies. Immunocytochemical procedures are described in detail elsewhere (14). Sections were analyzed with a conventional fluorescence or confocal laser-scanning microscope. Images were captured digitally and exported to Adobe Photoshop for editing. Image enhancement was strictly limited to minor adjustments of image brightness and contrast applied uniformly to any pairs of images to be compared.
All animal experiments were approved by local Animal Care Committees (Calgary and Halifax) and complied with the ARVO Resolution on the Care and Use of Animals for Research.
ACKNOWLEDGEMENTS
We thank Drs Catherine Morgans (OHSU), Robert Molday (UBC) and Shigetada Nakanishi (Kyoto University) for the antibodies used in these studies, Rose Tobias for the mouse genotyping, Artee Karkhanis and Wei Dong for EM and Brenda Carson and Eileen Rattner for expert assistance in establishing the mutant mouse. This research was supported in part by the Foundation Fighting Blindness-Canada (N.T.B.H.), Canadian Institutes for Health Research (MT-10968 to S.B., MOP-15660 to N.T.B.H.), NSHRF and CIHR-RPP grants (F.T.); Dalhousie Medical Research Foundation (S.B.); E.A. Baker/CIHR studentship award to M.R.L.; FFB-C studentship to N.C.O., NSERC (W.K.S.). N.T.B.H. is the Roy and Joan Allen Professor in Sight Research at the University of Calgary.
Conflict of Interest statement. None declared.
The authors wish it to be known that, in their opinion, the first two authors should be regarded as joint First Authors.
Present address: Department of Biosciences, Cardiff University, Biomedical Sciences Building, Museum Avenue, Cardiff, UK.
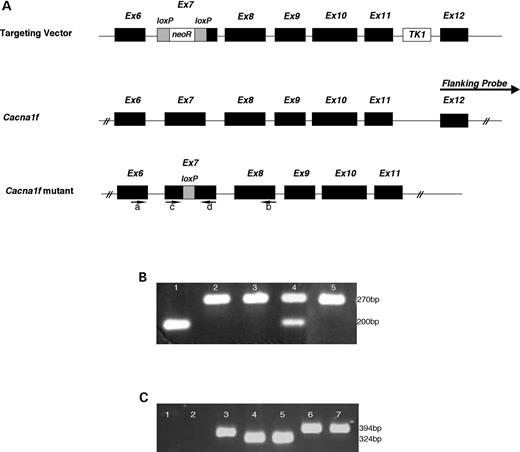
Figure 1.Cacna1f targeting strategy and genotyping of mice. (A) Targeting vector: the Cacna1f targeting vector illustrated with the ACN cassette positioned in exon 7. Cacna1f: position of the flanking probe used to screen targeted ES cells is shown against wild-type genomic Cacna1f. Cacna1f mutant: depicts the targeted mutation in Cacna1f after excision of ACN in the male germline. The location of primers for RT–PCR are indicated by arrows labeled (a) and (b), whereas arrows (c) and (d) indicate genotyping primers. For details, refer Materials and Methods. (B) Genotyping of mice. Lane 1, wild-type male; lanes 2 and 3, Cacna1f-mutant males; lane 4, heterozygous female; lane 5, homozygous Cacna1f-mutant female. (C) RT–PCR analysis of Cacna1f-retinal transcript. DNA ladder: lane 1, no reverse transcriptase control; lane 2, water control; lane 3, Rpgr control; lane 4, wild-type, homozygous female; lane 5, wild-type male; lane 6, homozygous mutant female; lane 7, hemizygous mutant male. Sizes of standards are indicated in base pairs (bp).
![Figure 2. Electrophysiological analysis of Cacna1f-mutant mouse. (A) Intensity-response series of scotopic electroretinograms in wild-type and Cacna1f-mutant mice. In the mutant mice, the ERG b-wave is absent, providing an electronegative configuration to the bright-flash responses. Numbers at left of individual recordings are stimulus intensity in log cd s/m2. Circles: flash onset. Calibration bars: as shown. (B) Comparison of ERG responses between a mutant mouse and a wild-type animal with intravitreal injection of CoCl2. The bright-flash response after CoCl2 injection in the wild-type is identical to the one in the mutant, suggesting that the Cacna1f-mutant ERG response is mostly generated by photoreceptor activity. (C) Best fit curves for intensity–response functions (V(I)=Vmax [In/(In+Kn)]) of scotopic ERG a-wave in wild-type (open circle, mean+1SD, n=7) and Cacna1f-mutant mice (closed circle, mean±1SD, n=9), showing increased sensitivity (K) and reduced amplitude (Vmax) in the mutant. (D) ERG recordings obtained under light background adaptation, showing that the mutant mice did not have any detectable ERG activity under these conditions. (E) Visual evoked potentials obtained in scotopic conditions to a bright-flash stimulus (0 log attenuation), showing that no cortical activity could be detected in the mutant mice. (F) Multi-unit activity recorded from the superior and inferior colliculi following visual and auditory stimuli. No visual responses could be elicited in the superior colliculus of the mutant mice, whereas reliable activity was elicited from auditory stimuli in the inferior colliculus, supporting the contention that the mutant mice are severely visually deficient.](https://oup.silverchair-cdn.com/oup/backfile/Content_public/Journal/hmg/14/20/10.1093/hmg/ddi336/2/m_ddi33602.jpeg?Expires=1716393003&Signature=0fm0dqtiekkGYoP9HKNsJHpWwFHFSKLjAzwqgrs334oyJzevgAwTI8xw6nIcBwKMj-gHRdBeoXMKVja9GqlsQlgJ1hAdAFPnVUU0rW~RFwG7~XXCVRTQD~QDjwwz5rZiGZsfXbgUiYAtIaVxOdZ0eGvYO9ZXatVJs1V6r5Dr9UndklJy0Iq7mKzz9Hphw9u9t5kf~bxHOM12momk0572L4DARJu7hL2ixOBVzxJaY3aQ1msq5eImBUG3GU6~vOGNZe2Gcm8e10t16wgJqoP19DLfdSRTKQG~H9wyuOaS0GxfbpSLUt0x1-Orf~SzQ3UFi9sZDx7vap2CroitY6JHzQ__&Key-Pair-Id=APKAIE5G5CRDK6RD3PGA)
Figure 2. Electrophysiological analysis of Cacna1f-mutant mouse. (A) Intensity-response series of scotopic electroretinograms in wild-type and Cacna1f-mutant mice. In the mutant mice, the ERG b-wave is absent, providing an electronegative configuration to the bright-flash responses. Numbers at left of individual recordings are stimulus intensity in log cd s/m2. Circles: flash onset. Calibration bars: as shown. (B) Comparison of ERG responses between a mutant mouse and a wild-type animal with intravitreal injection of CoCl2. The bright-flash response after CoCl2 injection in the wild-type is identical to the one in the mutant, suggesting that the Cacna1f-mutant ERG response is mostly generated by photoreceptor activity. (C) Best fit curves for intensity–response functions (V(I)=Vmax [In/(In+Kn)]) of scotopic ERG a-wave in wild-type (open circle, mean+1SD, n=7) and Cacna1f-mutant mice (closed circle, mean±1SD, n=9), showing increased sensitivity (K) and reduced amplitude (Vmax) in the mutant. (D) ERG recordings obtained under light background adaptation, showing that the mutant mice did not have any detectable ERG activity under these conditions. (E) Visual evoked potentials obtained in scotopic conditions to a bright-flash stimulus (0 log attenuation), showing that no cortical activity could be detected in the mutant mice. (F) Multi-unit activity recorded from the superior and inferior colliculi following visual and auditory stimuli. No visual responses could be elicited in the superior colliculus of the mutant mice, whereas reliable activity was elicited from auditory stimuli in the inferior colliculus, supporting the contention that the mutant mice are severely visually deficient.
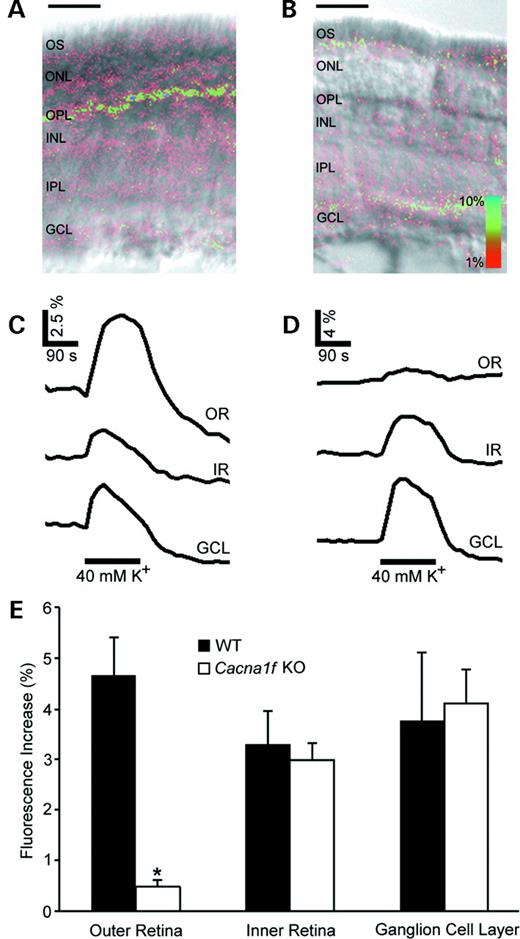
Figure 3. Calcium imaging in Cacna1f-mutant mice. (A) Digital overlay representing peak calcium influx in response to 40 mm potassium depolarization in a wild-type retinal slice. The retinal layers are designated as outer segments (os), outer nuclear layer (onl), outer plexiform layer (opl), inner nuclear layer (inl), inner plexiform layer (ipl) and ganglion cell layer (gcl). Scale bar: 50 µm. (B) Digital overlay representing peak Ca2+ influx in a Cacna1f-mutant retinal slice. Scale bar: 50 µm. (C) Traces showing Ca2+ influx in response to a 40 mm K+ depolarization (lower black bar) from three layers of a wild-type retina. Upper trace, outer retina (OR); middle trace, inner retina (IR); lower trace, ganglion cell layer (GCL). Scale bar, y-axis=2.5% fluorescence increase, x-axis=1.5 min. (D) Traces showing Ca2+ influx from three major layers of a Cacna1f-mutant mouse retina in response to 40 mm K+ depolarization. Upper trace, outer retina; middle trace, inner retina; lower trace, ganglion cell layer. Scale bar, y-axis=4% fluorescence increase, x-axis=1.5 min. (E) Histogram showing averaged, normalized peak calcium influx in response to potassium depolarization from the three layers of the retina. Black bars, control retinal slices (n=5). White bars, Cacna1f-mutant retinal slices (n=7). Asterisk denotes significant difference at P<0.05.
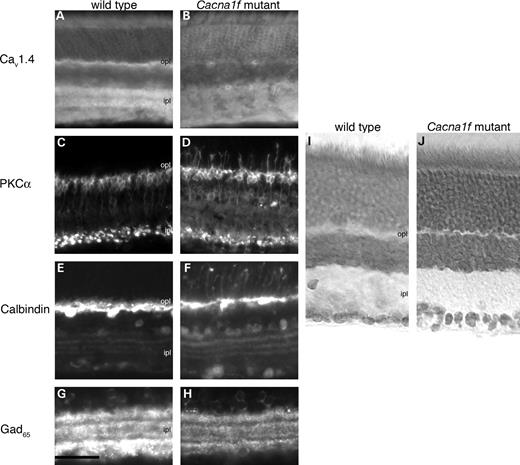
Figure 4. Immunolabeling of retinal cross-sections from wt (A,C,E,G) and mutant (B,D,F,H). Antibodies were directed to α1F (A and B), PKCα (C and D), calbindin (E and F) and GAD65 (G and H). Frozen sections of the wild-type (I) and mutant (J) retina stained with toluidine blue. GCL, ganglion cell layer; remaining abbreviations are as in Figure 3. Scale bar: 50 µm.
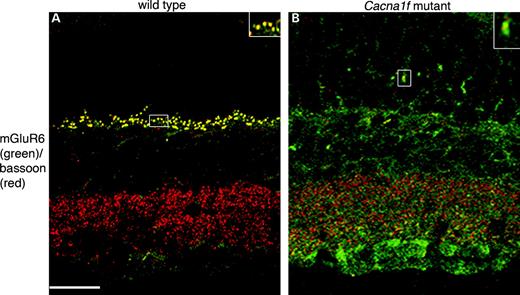
Figure 5. Double-labeling of cross sections from wild-type (A) and Cacna1f-mutant mice (B). Antibodies were directed to bassoon (red), mGluR6 (green). GCL, ganglion cell layer; IPL, inner plexiform layer; INL, inner nuclear layer; OPL, outer plexiform layer; ONL, outer nuclear layer. Scale bar: 50 µm.
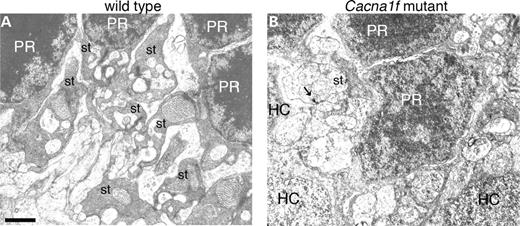
Figure 6. Electron micrographs of the wild-type (A) and Cacna1f-mutant (B) retinas. The arrow in the right panel indicates a residual synaptic ribbon. PR, photoreceptor nucleus; HC, horizontal cell; st, synaptic terminal. Scale bar: 1 µm.
References
Miyake, Y., Yagasaki, K., Horiguchi, M., Kawase, Y. and Kanda, T. (
Tremblay, F., Laroche, R.G. and De Becker, I. (
Miyake, Y. (
Héon, E. and Musarella, M.A. (
Boycott, K.M., Pearce, W.G. and Bech-Hansen, N.T. (
Bech-Hansen, N.T., Naylor, M.J., Maybaum, T.A., Pearce, W.G., Koop, B., Fishman, G.A., Mets, M., Musarella, M.A. and Boycott, K.M. (
Strom, T., Nyakatura, G., Apfelstedt-Sylla, E., Hellebrand, H., Lorenz, B., Weber, B.H.F., Wutz, K., Gutwillinger, M., Ruther, K., Drescher, B. et al. (
McRory, J.E., Hamid, J., Doering, C.J., Garcia, E., Parker, R., Hamming, K., Chen, L., Hildebrand, M., Beedle, A.M., Feldcamp, L. et al. (
Baumann, L., Gerstner, A., Zong, X., Biel, M. and Wahl-Schott, C. (
Naylor, M., Rancourt, D.E. and Bech-Hansen, N.T. (
Rao-Mirotznik, R., Harkins, A.B., Buchsbaum, G. and Sterling, P. (
Boycott, K.M., Maybaum, T.A., Naylor, M.J., Weleber, R.G., Robitaille, J., Miyake, Y., Bergen, A.A.B., Pierpont, M.E., Pearce, W.G. and Bech-Hansen, N.T. (
Parsons, T.D. and Sterling, P. (
Morgans, C.W. (
Berntson, A., Taylor, W.R. and Morgans, C.W. (
Morgans, C.W., El Far, O., Bernstson, A., Wassle, H. and Taylor, W.R. (
Rieke, F. and Schwartz, E.A. (
Barnes S. and Kelly M.E.M (
Lewis, G.P., Linberg, K.A. and Fisher S.K. (
Fisher, S.K., Lewis, G.P., Linberg, K.A. and Verardo, M.R. (
Dick, O., tom Dieck, S., Altrock, W.D., Ammermuller, J., Weiler, R., Garner, C.C., Gundelfinger, E.D. and Brandståtter, J.H. (
Dresbach, T., Qualmann, B., Kessels, M.M., Garner, C.C. and Gundelfinger, E.D. (
Garner, C.C., Kindler, S. and Gundelfinger, E.D. (
Ball, S.L., Powers, P.A., Shin, H.-S., Morgans, C.W., Peachey, N.S. and Gregg, R.G. (
Haeseleer, F., Imanishi, Y., Maeda, T., Possin, D.E., Maeda, A., Lee, A., Rieke, F. and Palczewski, K. (
Libby, R.T., Lavallee, C.R., Balkema, G.W., Brunken, W.J. and Hunter, D.D. (
Nakamura, M., Ito, S., Piao, C.-H., Terasaki, H. and Miyake, Y. (
Jalkanen, R., Mantyjarvi, M., Tobias, R., Alitalo, T. and Bech-Hansen, N.T. (
Woltjen, K., Bain, G. and Rancourt, D.E. (
Unger, M.W.T., Liu, S.Y. and Rancourt, D.E. (
Bunting, M., Bernstein, K.E., Greer, J.M., Capecchi, M.R. and Thomas, K.R. (
Kato, H. and Moriwaki, K. (
Chang, Y.C. and Gottlieb, D.I. (
Laird, D.W. and Molday, R.S. (
Nomura, A., Shigemoto, R., Nakamura, Y., Okamoto, N., Mizuno, N. and Nakanishi, S. (
