


Abstract
Glucose is the most important energy substrate for the brain, and its cellular distribution is a subject of great current interest. We have employed fluorescent glucose probes, the 2-deoxy-d-glucose derivates 6- and 2-([N-(7-nitrobenz-2-oxa-1,3-diazol-4-yl) amino]-2-deoxy-D-glucose) (2-NBDG), to measure transport and metabolism of glucose in acute slices of mouse hippocampus and cerebellum. In the hippocampus, 6-NBDG, which is not metabolized and hence indicates glucose transport, was taken up faster in astrocyte-rich layers (Stratum radiatum [S.r.], Stratum oriens [S.o.]) than in pyramidal cells. Metabolizable 2-NBDG showed larger signals in S.r. and S.o. than in Stratum pyramidale, suggesting faster glucose utilization rate in the astrocyte versus the neuronal compartment. Similarly, we found higher uptake and temperature-sensitive metabolism of 2-NBDG in Bergmann glia when compared with adjacent Purkinje neurons of cerebellar slices. A comparison between 6-NBDG transport and glucose transport in cultured cells using a fluorescence resonance energy transfer nanosensor showed that relative to glucose, 6-NBDG is transported better by neurons than by astrocytes. These results indicate that the preferential transport and metabolism of glucose by glial cells versus neurons proposed for the hippocampus and cerebellum by ourselves (in vitro) and for the barrel cortex by Chuquet et al. (in vivo) is more pronounced than anticipated.
Introduction
The main energy-rich compound supplied to the brain is glucose, delivered via the blood circulation. While neurons are presumed to be the principal energy consumers, it is not known to what extent they are fed directly by glucose or by lactate, which is present in the brain interstitium at millimolar levels and is an efficient energy substrate for neurons. According to the Astrocyte-to-Neuron Lactate Shuttle Hypothesis (ANLSH; Pellerin and Magistretti 1994), glucose, taken up by astrocytes, is funelled into glycolysis (partly via the glycogen shunt, see Dringen et al. 1993), and the formed lactate would then be transferred to neurons via monocarboxylate transporters. This would allow astrocytes to take up the major fraction of available glucose, although neurons are the main consumers of energy. However, ANLSH has been controversially discussed in the last years (Chih et al. 2001; Hertz and Dienel 2002; Dienel and Cruz 2004; Pellerin et al. 2007; Mangia et al. 2009; Jolivet et al. 2010; Magistretti 2011), and there have been divergent conclusions from results obtained in vivo, in situ, and in vitro (for further references see Barros and Deitmer 2010; Bélanger et al. 2011). Recently, studies have provided in vivo support for the ANLSH by showing that lactate can efficiently energize brain activity during deep hypoglycemia (Wyss et al. 2011), and by demonstrating the significance of astrocytic lactate supply to neurons via monocarboxylate transporters for memory formation (Newman et al. 2011; Suzuki et al. 2011).
In our previous study on glucose uptake and metabolism in acute rat cerebellar tissue slices, we found that the glucose transport capacity and glycolytic rate of the Bergmann cell, a special type of glia, are larger and faster than those of the Purkinje cell, its intimate neighbor and principal neuron of the cerebellum, suggesting substantial shuttling of an energy-rich metabolite between glial cells and neurons (Barros, Courjaret et al. 2009). Now we have explored the hippocampus, where astrocytes and neurons are lying in close proximity and can be easily identified. The species chosen for the present study was the mouse, which is currently the most intensively studied animal model. An additional set of experiments were carried out in mouse cerebellum, which allowed a direct comparison between the 2 brain regions and the use of a transgenic mouse expressing a red fluorescent protein specifically in Bergmann glia. In addition, we have applied to hippocampal and cerebellar slices a refinement in the use of fluorescent glucose analogs that involves the l-form of 2-([N-(7-nitrobenz-2-oxa-1,3-diazol-4-yl) amino]-2-deoxy-D-glucose) (2-NBDG) and have compared neuronal and astrocytic glucose transporters in terms of their capacity to handle glucose and 6-NBDG. In both brain regions, glucose transport and metabolism were faster in the glial compartment when compared with the neuronal compartment, suggesting that a large fraction of the supplied glucose is passed to neurons, possibly in the form of lactate.
Materials and Methods
Cell Culture and Slices
Mixed cortical cultures of neuronal and glial cells (1–3-day-old neonates; astrocyte-enriched cultures) and cultures of hippocampal neurons (17.5-day embryos; neuron-enriched cultures) were prepared as detailed previously (Bittner et al. 2010). Animals used were mixed F1 male mice (C57BL/6J × CBA/J), kept in an animal room under SPF conditions at a room temperature of 20 ± 2 °C, in a 12/12 h light/dark cycle with free access to food and water. Pregnant mice were killed by cervical dislocation. Embryos and neonatal mice were killed by decapitation. Animal procedures were approved by the Centro de Estudios Científicos Animal Care and Use Committee, following the recomendations of the Guide for the Care and Use of Laboratory Animals, Institute of Laboratory Animal Resources, National Research Council, United States of America. Cultures were transfected at day 5–7 (cortical) or 4–6 (hippocampal) with 5 µg of a plasmid coding for the glucose sensor FLII12Pglu-600 µΔ6 (Takanaga et al. 2008; available through www.addgene.org), using Lipofectamine 2000 (Gibco). Alternatively, cortical cultures were exposed to 5 × 10⁶ PFU of Av FLII12Pglu600 µΔ6 (custom made by Vector Biolabs). As reported previously (Bittner et al. 2010), there was no apparent difference in the metabolic behavior of cells transfected with plasmid or transduced with the adenoviral vector. 3T3-L1 fibroblasts stably transfected with FLII12Pglu600 µΔ6 were cultured as described previously (Bittner et al. 2010).
Experiments in slices were performed on wild-type NMRI (New Medical Research Institute) mice and on transgenic mice (GRFT, provided by Dr. Frank Kirchhoff, Homburg) expressing a monomeric red fluorescent protein (mRFP1) under control of the hGFAP promotor in astrocytic cells (Hirrlinger et al. 2005). The animals were maintained on a 12-h day/night cycle at constant room temperature with free access to water and standard mouse fodder in the animal facility of the Technical University of Kaiserslautern. All procedures involving animals were approved by the Landesuntersuchungsamt Rheinland-Pfalz, Koblenz (23 177–07). Animals from postnatal day 14 to 21 were decapitated, and their brains were quickly transferred to an ice-cold, Ca2+-reduced artificial cerebrospinal fluid (ACSF1), containing (in mM): NaCl 125, KCl 2.5, NaH2PO4 1.25, Glucose 25, MgCl2 2.5, CaCl2 0.5, NaHCO3 26, gassed with 5% CO2/95% O2 to set the pH to 7.4. Parasagittal cerebellar slices of GRFT animals were obtained at a thickness of 250 µm using a vibratome (VT 1000, Leica, Darmstadt, Germany) and were stored in ACSF1 for 60min at 30 °C. About 250-µm-thick coronal hippocampal slices of NMRI animals were at first kept for 20min in ASCF1 additionally containing 0.5 µM Sulforhodamine 101 (SR101) to obtain reliable astrocytic red fluorescent signals, then for further 40min in normal ACSF1 at 30 °C.
Optical Measurements and Protocols
Cultured cells were imaged at room temperature (22–24 °C) after 3–8 days of infection/transfection in a buffer of the following composition (in mM): 136 NaCl, 3 KCl, 1.25 CaCl2, 1.25 MgCl2, 0–2 glucose, 10 HEPES, pH 7.4. with an Olympus Fluoview FV1000 confocal microscope (BX61) equipped with a 20×-water-immersion objective (NA 1.0) and a 440-nm laser. FLII12Pglu-600 µΔ6 is a fusion protein comprising a fluorescence resonance energy transfer (FRET) donor (CFP, cyano fluorescent protein) and a FRET acceptor (Citrine) linked by a bacterial protein that upon binding glucose or galactose changes its conformation and the distance/orientation between the FRET pair, thus changing FRET efficiency. The FRET sensor was excited at 440 nm and its emission was split at 515 nm (DM405-440/515). CFP and Citrine emissions were collected with band-pass filters (BP465-495 nm and BP535-565 nm, respectively), and the Citrine/CFP ratio was calculated. The Citrine/CFP emission ratio was transformed into glucose concentration using the calibration curves determined previously (Bittner et al. 2010). Five minutes before uptake, glucose in the medium was removed to allow intracellular glucose concentration to reach zero (Ruminot et al. 2011). Uptake was started by addition of 2-mM glucose. The uptake of the fluorescent hexose 6-NBDG was assayed in real time by a modification of a method used previously in astrocytes and neurons (Loaiza et al. 2003; Porras et al. 2004). As with the FRET measurement, glucose in the medium was removed 5 min before uptake. Uptake was initiated by addition of 300-µM 6-NBDG. Intracellular 6-NBDG concentration was calculated by comparing intracellular fluorescence with the signal outside the cells. Astrocytes, neurons, and fibroblasts were examined at similar levels of FRET sensor expression. Previously, we have shown that the level of expression of the FRET sensor over a wide range does not affect glucose measurement or metabolic parameters (Bittner et al. 2010).
Hippocampal and cerebellar slices were perfused with oxygenated ACSF2 (in mM: NaCl 135, KCl 2.5, NaH2PO4 1.25, glucose 5, lactate 0.5, MgCl2 1, CaCl2 2, NaHCO3 26), in a chamber (<100 µL volume) at a flow rate of about 1 mL/min. A glass coverslip was positioned slightly above the slice to reduce the volume and to increase the exchange rates of the solutions. The fluorescence of the glucose analogs was recorded with a custom-built multiphoton laser microscope (Till Photonics, Gräfelfing, Germany). The excitation was produced by a Mira900 pulsed laser pumped with a 5-W Verdi laser (Coherent Systems, Dieburg, Germany). The mean wavelength of the pulsed laser was set to 840 nm. The excitation light was sent to an upright Olympus BX50WI microscope equipped with a 550-nm dichroic mirror and a 40× water immersion objective (Numerical Aperture NA, 0.8). Scanning and recording parameters were controlled using the Fluoview 4.1 software (Olympus, Japan). The green fluorescent signals of the glucose analogs (∼540 nm) and the red fluorescent signals deriving from either mRFP1 (∼600 nm) or SR101 were separated by 2 band-pass filters BP605/55 and BP535/50 (Till Photonics). The acquisition rate was 0.33 Hz. After recording the autofluorescence for a few minutes, the acute slices were superfused with different fluorescent tracers, diluted in oxygenated ACSF2. Signals external to the tissue (Fbath) were used as a reference for the signals obtained within the tissue (F).
For estimating metabolism, acute hippocampal and cerebellar slice preparations were incubated for 60min in oxygenated ACSF2 with 5-µM 2-NBDG (PeptaNova) at different temperatures. To avoid nonspecific, extracellular signals, the tissue slices were washed afterwards for 1 or 2h as indicated. Acquisitions were carried out in 10-µm steps from the top of the slice down to a depth of 100 µm. Tissue slices not loaded with dye were used as a reference for autofluorescence background; these autofluorescence values (FA) taken in corresponding ROIs, were subtracted from the fluorescence signals taken in the ROIs of tissue slices loaded with glucose analogs (F).
Protein Extraction and Immunoblot Analysis
Brain tissue samples were lysed by sonication in a 200–300 µL of 2% SDS solution (MP Biomedicals, Illkirch, France) containing protease inhibitors (Complete Mini EDTA-free, Roche Diagnostics GmbH, Mannheim, Germany). Protein content was determined by microspectrophotometry (NanoDrop Technologies). Samples (250 µg) were loaded onto 4–20% Run Blue SDS Gel (Biozol Diagnostica Vertrieb GmbH, Eching, Germany) and electrotransferred onto nitrocellulose membranes. Blots were probed with anti-GLUT1 rabbit polyclonal antibody or anti-GLUT3 rabbit polyclonal antibody (diluted 1:500, Millipore) and visualized with a 1:4000 dilution of peroxidase-conjugated goat anti-rabbit IgG secondary antibody (Santa Cruz). The signal was revealed using a chemiluminescence kit (Lumi-Light, Roche).
Mathematical Modeling
Hexose dynamics were simulated with a model of 2 compartments, intracellular and extracellular, interconnected by an equilibrative glucose transporter according to a 4-state model with the kinetic parameters listed in Barros et al. (2007). Transporter concentration was varied between 0.1 and 0.3 µM and the Vmax of hexokinase was varied between 6 and 9 µM/s. Numerical simulations were done using Berkeley Madonna. Regression analyses were carried out with the computer program SigmaPlot (Jandel).
Data Analysis
Analysis was performed with the ImageJ software either using regional ROIs or ROIs of identified cells. Values are presented as mean values ± SEM. Statistical differences of paired and unpaired samples were evaluated with Student's t-test. Comparison between multiple groups was done with ANOVA, followed by Tukey's post hoc test. The significance level was set at P < 0.05, and indicated with *P < 0.05, **P < 0.01, and ***P < 0.005.
Results
Our main objective was to investigate the relative importance of astrocytes and neurons in the metabolism of glucose in the brain. To achieve sufficient spatial resolution to distinguish the specific contribution of these closely interacting cell types, we used the fluorescent glucose analogs 2-NBDG and 6-NBDG and multiphoton microscopy. In diverse cell types including astrocytes, neurons, muscle cells, epithelial cells, tumor cells, and so forth, 2-NBDG and 6-NBDG are preferentially transported into cells via the glucose transporters (discussed in Barros, Bittner et al. 2009; Kim et al. 2012). It is not known, however, whether these fluorescent glucose analogs are handled differently by the various isoforms of the glucose transporter, which do transport glucose with different kinetic parameters.
Measurement of Glucose Transport in Neurons and Astrocytes in Culture Using a FRET Biosensor
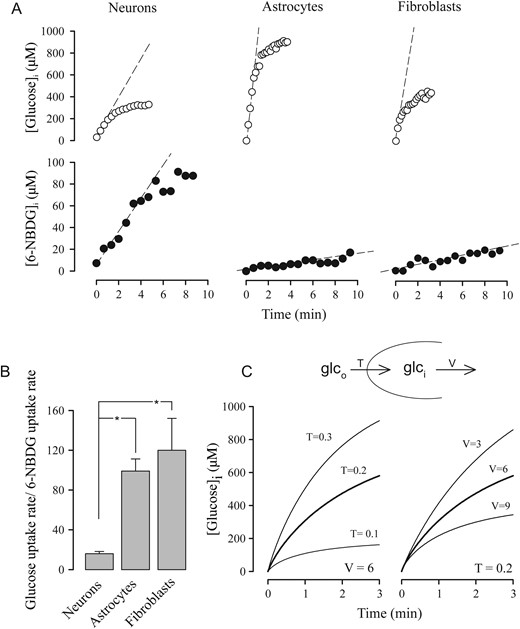
To investigate whether neurons and astrocytes differ in the way they handle glucose and 6-NBDG, we took advantage of the recent availability of a genetically encoded FRET glucose nanosensor that allows real-time measurement of intracellular glucose concentration in single cells (Takanaga et al. 2008; Bittner et al. 2010). With the glucose biosensor and a confocal microscope equipped for FRET measurements, it was possible directly to compare the transport properties of neurons and astrocytes. The uptake of glucose was assayed by exposing the cultures to 2-mM glucose after 5-min incubation in the absence of glucose to bring the intracellular concentration of glucose to zero. As illustrated in Figure 1A (upper panels), the uptake of glucose was faster in astrocytes than in neurons. Astrocytes showed a tendency to reach a higher level of steady-state glucose concentration, consistent with a higher transport capacity (Fig. 1A).
Comparison of glucose uptake and 6-NBDG uptake in different cell types. (A) The uptake of 2 µM glucose was measured by FRET microscopy of the glucose nanosensor and the uptake of 300 µM 6-NBDG was measured by confocal microscopy. Representative traces are shown corresponding to single cells. Interrupted lines illustrate initial rates of uptake. (B) Bars show average ratios between the initial rates for at least 18 cells in 3 experiments for each cell type. (C) The uptake of glucose (2 µM) in a metabolizing cell was simulated according to the mathematical model described in Material and Methods section. The left panel shows glucose accumulation at 3 transporter concentrations (T, µM) and the right panel shows glucose accumulation at 3 values of hexokinase's Vmax (V, µM/s).
Measurement of 6-NBDG Transport in Neurons and Astrocytes in Culture
Next, the cells were compared in terms of their capacity to take up 6-NBDG. In contrast to the behavior of glucose, the uptake of 6-NBDG was faster in neurons than in astrocytes (Fig. 1A, lower panels). The ratio between the initial rate of glucose uptake and the initial rate of 6-NBDG uptake was 6 times lower for neurons than for astrocytes (Fig. 1B), showing that the tracer is not handled equally by all GLUT isoforms. The predominant isoforms of the glucose transporter are GLUT3 in neurons and GLUT1 in astrocytes (Carruthers 1990; Simpson et al. 2007), so a parsimonious explanation is that the kinetic divergence is due to a kinetic difference between GLUT3 and GLUT1. Consistently, 3T3-L1 fibroblasts that mostly express GLUT1 (Yang et al. 1992) behaved much like astrocytes (Fig. 1A,B). Neurons may also express other isoforms of the glucose transporter, but these are thought to reside in intracellular organelles (Simpson et al. 2008). Regardless of the precise mechanism involved, these experiments show that relative to astrocytes, neurons are less effective at transporting glucose than 6-NBDG, and that the 6-NBDG signal overestimates the neuronal contribution to the transport of glucose. As 6-NBDG and 2-NBDG are transported at similar rates in both neurons and astrocytes (Loaiza et al. 2003; Porras et al. 2004), this conclusion can be extended to both dyes. A possible caveat regarding this interpretation is the possibility that glucose metabolism interferes with the uptake of glucose. To help visualizing the impact of metabolism on the accumulation of glucose, glucose dynamics were simulated according to a mathematical model in which glucose enters the cells via GLUTs, and is then metabolized by hexokinase. As shown in Figure 1C, both transport and metabolism affect the accumulation of glucose and the steady state reached, but only transport influences the initial rate of glucose accumulation. In practice, given sensitivity limitations, it was not possible to measure true initial rates; therefore rates had to be estimated across glucose concentrations at which metabolism should have dampened the accumulation to some extent (Fig. 1A). However, glycolysis in cultured astrocytes is faster than in cultured neurons (Bittner et al. 2010), and therefore the dampening should have been more significant for astrocytes, underscoring our main conclusion.
Glucose Metabolism in the Hippocampus
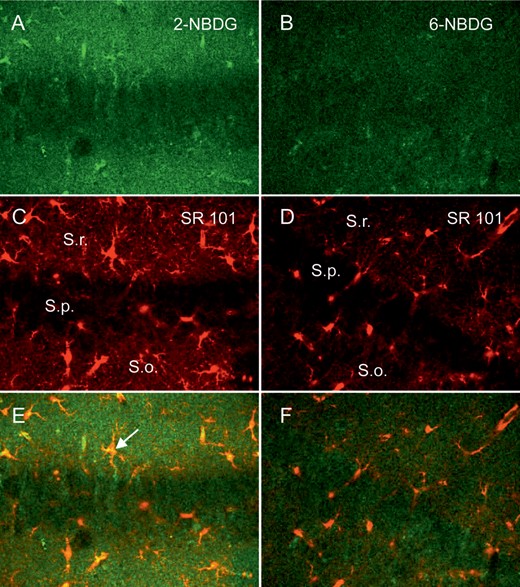
The speed of glucose utilization in acute slices of both hippocampus and cerebellum was estimated with the fluorescent analog 2-NBDG, which like 2-deoxyglucose is phosphorylated and trapped in cells. Figure 2A,B shows images of hippocampal slices, which were incubated in the 2 different fluorescent glucose analogs, 2-NBDG and 6-NBDG for 1 h and washed-out for another hour. The retained staining after wash-out was clearly stronger in the slices incubated with 2-NBDG when compared with 6-NBDG, which is not metabolized and leaves the cell during wash-out. Astrocytes in the hippocampus can be marked with the dye Sulforhodamine 101 (SR101; Fig. 2C,D), which is selectively taken up by astrocytes in the brain (Nimmerjahn et al. 2004; Kafitz et al. 2008). The images of the glucose analogs and the SR101 images were superimposed (Fig. 2E,F), and single astrocytes could be identified, which incorporated and retained 2-NBDG (Fig. 2E, arrow). While the astrocyte-rich layers Stratum radiatum (S.r.) and Stratum oriens (S.o.) contained significant green fluorescence from the glucose analogs, the Stratum pyramidale (S.p.) showed much less fluorescence, indicating less retention of the glucose analogs in pyramidal cells (Fig. 2A–C). Fluorescence recovery after photobleaching experiments have shown that the phosphorylated form of 2-NBDG diffuses freely inside cells (Barros, Courjaret et al. 2009). Notwithstanding possible differences in the density of transporters between neuronal somata and processes, given the prolonged incubation time of the present uptake assay (1h), it seems reasonable to assume that the low signal observed in pyramidal somata is a close representative of the signal in neuronal processes within S.r. and S.o.
Multiphoton images of hippocampal brain slices (p 18) incubated in different glucose analogs as indicated, for 1 h and subsequent wash-out for 1 h (A and B), the same slice regions were stained with Sulforhodamine 101 (SR101) for astrocyte identification (C and D), with indication of the different layers, Stratum radiatum (S.r.), Stratum pyramidale (S.p.), and Stratum oriens (S.o.). The images of (A–D) were superimposed (E and F), showing colocalization of astrocytes and staining pattern of the glucose analog.
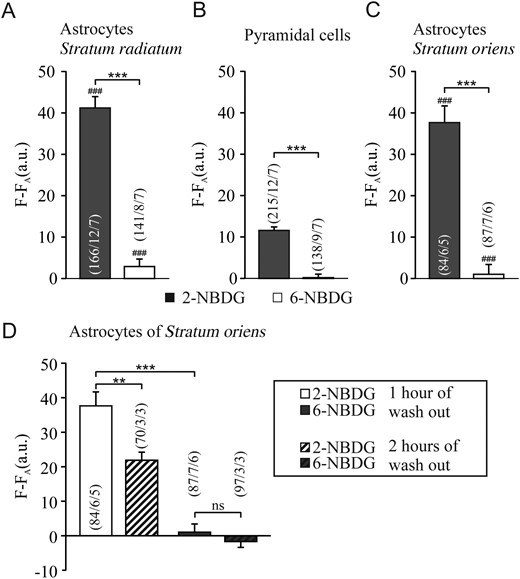
The retained staining of the fluorescent glucose analogs after 1 h incubation and 1 h wash-out of the analogs are summarized in Figure 3A–C. Individual astrocytes in the S.r. and S.o. and pyramidal cells in the S.p. were analyzed as the fluorescence signal in the cellular regions of interest. The bar plots indicate that 3 times more 2-NBDG fluorescence was retained in astrocytes of S.r. and S.o. than in pyramidal cells. The fluorescence of 6-NBDG was very low or negligible, confirming that it was removed by >95% during wash-out in all cell types.
Plot of background-corrected fluorescence intensity (F-FA) in hippocampal brain slices after 1 h incubation in different glucose analogs and 1 h wash, as indicated for astrocytes and neurons in the Stratum radiatum (A), Stratum pyramidale (B), and Stratum oriens (C). Comparison of fluorescence intensity after 1 h and 2 h wash-out time in astrocytes of the Stratum oriens (D). Sharp symbols (#) represent significant differences in comparison to pyramidal cells.
When the wash-out time of the fluorescent glucose analogs was increased to 2 h, 2-NBDG was further reduced to 57%, whereas no difference was detected with 6-NBDG, when compared with images obtained after 1 h wash-out, and shown for astrocytes of the S.o. (Fig. 3D). This suggest that 6-NBDG was indeed washed-out, while the decrease of 2-NBDG taken up by the cells is much slower.
Cellular Glucose Uptake in the Hippocampus
To study the transport of glucose in the different layers and cell types in the hippocampus, we monitored the fluorescent increase during addition of 6-NBDG (Fig. 4A). In the bath, >95% of the dye was washed-in within 30 s. The uptake into the regions of the layers S.r., S.o., and S.p. occurred with at least 2 time courses, a fast one over the first 2–4 min, and a slower, nearly linear one after 5 min. In comparison, calcein, a dye that is not expected to be taken up by cells and should hence remain in the extracellular spaces of the tissue slice, was also washed-in and its fluorescence monitored in the different layers for comparison (Fig. 4B). While the calcein bath signal had the same time course as the glucose analogs, the regional signals in the tissue layers were considerably lower than those of 6-NBDG.
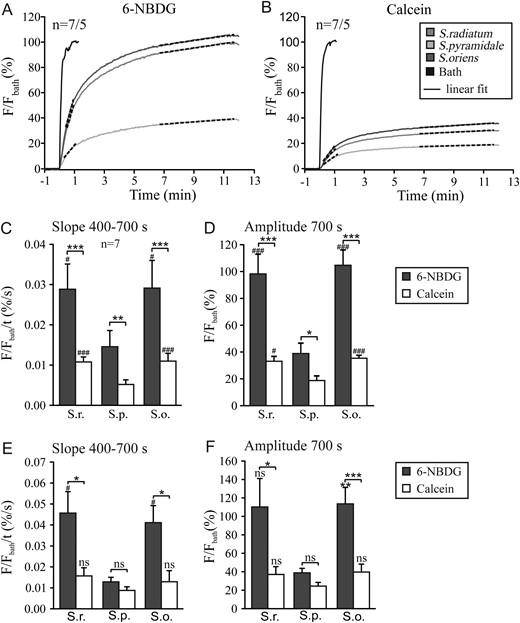
Multiphoton recording in hippocampal brain slices after addition of 6-NBDG (A) or calcein (B) to the experimental chamber, with regions of interest in the bath and in the 3 layers as indicated in the inset of B. Analysis of the recordings shows the slope of the fluorescence increase in the second, more linear phase (C and E) and the amplitude after 700 s (D and F) for regions (C and D) and for identified cell somata (E and F) in the 3 layers, Stratum radiatum, Stratum pyramidale, and Stratum oriens for both 6-NBDG and calcein. Sharp symbols (#) represent significant differences in comparison to pyramidal cells.
For analysis, we chose the rate of rise of the fluorescent signals (slope) between 400 and 700 s, that is, the second, slow phase, after wash-in of the dye (Fig. 4C,E) and the amplitude after 700 s (Fig. 4D,F), and compared the regional signals (Fig. 4C,D) and the signals analyzed for the individual cells (Fig. 4E,F) in the 3 layers S. radiatum, S. pyramidale, and S. oriens. The bar plots clearly show that both slope and amplitude, analyzed for region and cell type, were 2–4 times larger in the astrocyte-rich S.r. and S.o. than in S.p., and larger in astrocytes than in pyramidal cells, respectively. In S.r. and S.o., the signal was nearly 3 times faster and larger for 6-NBDG than for calcein (Fig. 4C), similarly as found for astrocytes (Fig. 4E). In the S. pyramidale, the 6-NBDG signal was also 2–3 times faster and larger than calcein, but when analyzed for individual pyramidal cells, there was no significant difference remaining in the signals for 6-NBDG and calcein. These results suggest that uptake of 6-NBDG is considerably faster and larger in the astrocytic than in the neuronal compartment, and is significantly faster and larger than calcein, which should largely remain in the extracellular spaces. Considering that 6-NBDG transport overestimates glucose transport in neurons by a factor of 6, relative to astrocytes (Fig. 1), it can be stated that the glucose transport capacity of hippocampal neurons in slices is about one order of magnitude lower than that of astrocytes.
Glucose Uptake in the Cerebellum
Our previous data obtained in rats indicated that fluorescent glucose analogs in acute cerebellar slices were taken up faster and to a larger extent in Bergmann glial cells than in Purkinje neurons. Here, we have extended the study to mouse cerebellum and have employed the l-glucose-based 2-NBDLG, which is expected to be a less efficient substrate for the glucose transporter. Additionally, the green fluorescent glucose analog distribution was compared with that of a genetically encoded red reporter specifically expressed in Bergmann glia. In an experiment similar to that shown in Figure 4 for hippocampal slices, we compared the uptakes of 2-NBDG and 2-NBDLG in cerebellar slices for 3 different regions; granule cell layer, and the proximal and distal part of the molecular layer (Fig. 5A). The recordings are shown from the point in time at which the bath had reached 90% of the final fluorescence following addition of the fluorescent glucose analogs. The distal part of the molecular layer showed the fastest and largest uptake of the glucose analogs. While during the first minutes the signal was similar for 2-NBDG and 2-NBDLG, uptake of 2-NBDG was 2.7-fold faster in the later phase between 200 and 400 s than uptake of 2-NBDLG (Fig. 5B). As more than 80% of the fluorescent signal was already reached after 200 s, the difference between the signal amplitude for 2-NBDG and 2-NBDLG after 400 s was only 15%, though highly significant (Fig. 5C). The difference signal between 2-NBDG and 2-NBDLG for the 3 regions is shown in Figure 5D, revealing that the 2-NBDG-specific fluorescence signal was fastest and largest in the distal part of the molecular layer and smallest in the granule cell layer (Fig. 5E,F). Nevertheless, there appeared a significant uptake signal also from 2-NBDLG, which may indicate that GLUTs may discriminate between the l- and d-form of NBDG less than expected.
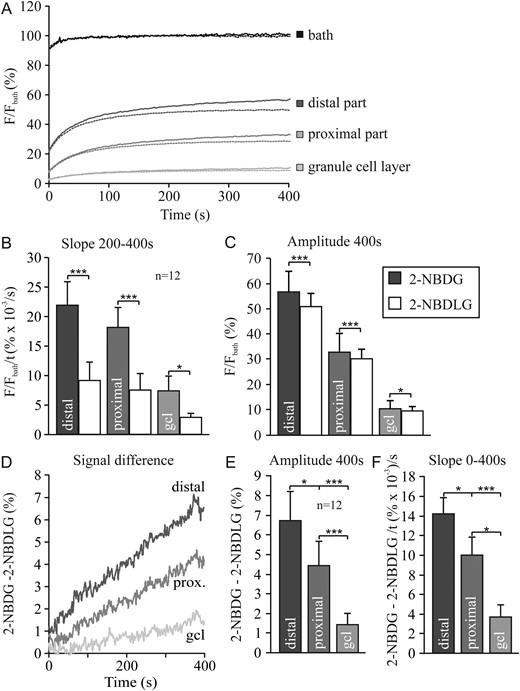
Multiphoton recording in cerebellar brain slices after addition of 2-NBDG or 2-NBDLG to the bath, in the distal and proximal part of the molecular layer and in the granule cell layer (A). Analysis of the recordings shows the slope of the fluorescence increase between 200 and 400 s (B) and the amplitude after 400 s (C) for the 3 regions as indicated for the 2 glucose analogs. Subtraction of the fluorescence of 2-NBDG and 2-NBDLG is shown as the signal difference over time (D), the corresponding amplitudes (E) and slopes (F).
Glucose Metabolism in the Cerebellum
Glucose metabolism in the cerebellum was studied by incubating 2-NBDG for 1 h and washing-out for another hour at room temperature. Images of different depths (20–60 µm) in acute cerebellar slices after 1 h incubation of 2-NBDG are shown in Figure 6 (left column). GFRT mice were used to identify astrocytes (Fig. 6, middle column). The superimposed images show the colocalization of red fluorescent protein, staining Bergmann glia in the molecular layer and the green fluorescence of 2-NBDG (Fig. 6, right column). The lower left panel shows a single Purkinje cell filled with 2-NBDG via a patch pipette demonstrating the shape of the Purkinje cell dendritic tree, which differs markedly from the cell processes of the Bergmann glial cells.
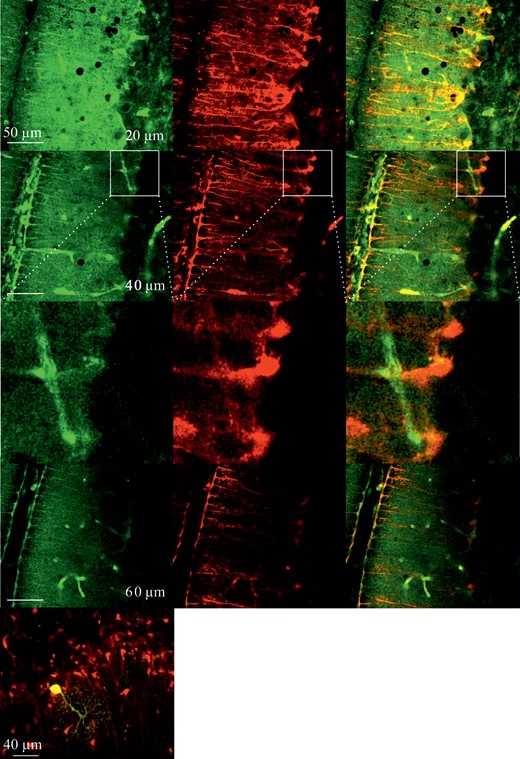
Multiphoton images of cerebellar brain slices incubated in 2-NBDG for 1 h and washed-out for 1 h at different tissue depths between 20 and 60 µm (left). Images of the same slices at the same depth, respectively, of astrocyte-specific labeling of GFRT mice, showing primarily Bergmann glial cells (middle) and the superimposed images (right), indicating colocalization of 2-NBDG fluorescence and mRFP1 staining. The lower left image shows a slice image with a single Purkinje cell loaded with 2-NBDG (yellow) and labeled astrocytes (red) in the GFRT mouse.
Incubation in 2-NBDG was carried out at a room temperature of near 21 °C (Fig. 7A) and at 35 °C (Fig. 7B), showing that the fluorescent signal was much higher in Bergmann glia than in Purkinje neurons at both temperatures. Deep into the tissue, the recorded signals decreased due to light absorption by the tissue; however, the 2-NBDG signal of the molecular layer remained more than twice as high when compared with the signal of the granule cell layer (Fig. 7C). As oxygen levels are expected to be lower deeper into the slices, the metabolic status of such cells may be different from that of cells located near the surface. The ratio of the measured autofluorescence in the 2 regions hardly changed with tissue depth (Fig. 7D), while the ratio of the 2-NBDG signals in the proximal part and the granule cell layer increased with depth, suggesting higher uptake of glucose into the glial compartment.
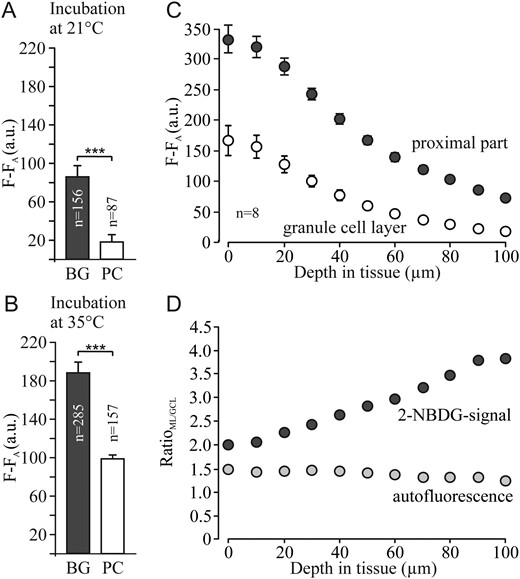
Plot of fluorescence intensity (F-FA) in cerebellar brain slices incubated in different glucose analogs for 1 h at 21 °C (A) and 35 °C (B) and after washing-out for 1 h, as indicated for Bergmann glial cells (BG) and Purkinje cells (PC). The fluorescence of 2-NBDG was measured and plotted at different tissue depth for the proximal part of the molecular layer and the granule cell layer (C). The intensity ratio between the proximal part of the molecular layer and the granule cell layer for both, the 2-NBDG signal and the autofluorescence, shows a marked diversion (D).
In adult rodents, the brain is energized almost exclusively by glucose, but the present study was performed in young animals, in which the brain is partly energized by other oxidative substrates such as lactate and ketone bodies. Consistent with less reliance on glucose, semiquantitative measurement of GLUT1 and GLUT3 in brain tissue showed a lower expression of both isoforms in young animals compared with adults (Fig. 8). This confirms previous studies showing a developmental increase in GLUT1 and GLUT3 expression (Simpson et al. 2007; Simpson et al. 2008). As in young animals, both isoforms are reduced to the same extent, there does not seem to be a relative change in fuel preference but rather a gradual conversion of neurons from blood-borne lactate/ketones to astrocytic lactate.
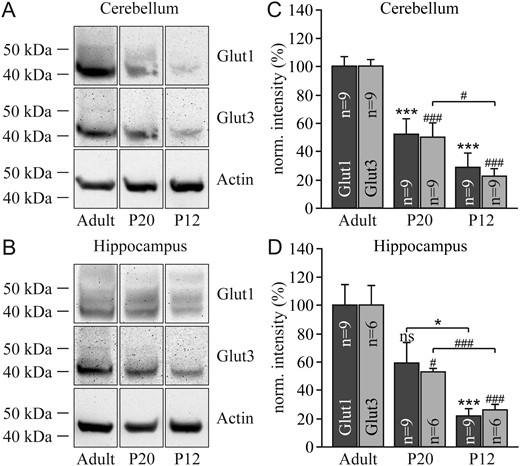
Detection of the GLUT1 and GLUT3 proteins by immunoblotting in the cerebellum (A) and hippocampus (B) at postnatal days 12 and 20 and in adult animals. Corresponding quantification of the 2 transporters in the cerebellum (C) and the hippocampus (D). Results were normalized to the individual protein levels of adult animals. Significant differences for GLUT1 are indicated by asterisks (*) and for GLUT3 by sharp symbols (#).
Discussion
The main conclusion of the present study of mouse hippocampal slices is that the transport and metabolism of glucose is considerably higher in astrocytes than in the neurons located in their vicinity. Our previous analysis of rat cerebellar slices indicated that Bergmann glial cells transport and metabolize fluorescent glucose analogs faster than Purkinje neurons (Barros, Courjaret et al. 2009). The present study in mouse tissue confirmed these findings in rat tissue, and thanks to colocalization with a red protein selectively expressed in Bergmann glia, confirmed their identification as the main glucose sink. The metabolic similarity observed here between hippocampus and cerebellum, despite their anatomical and functional divergence, suggests a general metabolic arrangement that may be present throughout the brain. In a separate study, somatosensory cortex measurements in vivo showed that astrocytes and neurons have similar rates of 6-NBDG uptake under resting conditions, and that whisker stimulation preferentially increased the uptake in astrocytes (Chuquet et al. 2010), a correlate of the stimulatory effect of glutamate on the astrocytic glucose transporter GLUT1 observed in culture (Loaiza et al. 2003; Bittner et al. 2011). The comparison provided here between the behavior of 6-NBDG and glucose in cultured astrocytes and neurons, suggests a much stronger uptake of glucose by astrocytes both under resting conditions in slices (this study and Barros, Courjaret et al. 2009) and under resting and stimulated conditions in vivo (Chuquet et al. 2010).
An important issue regarding the interpretation of fluorescent glucose tracer data is the extent to which it truly represents the behavior of glucose. Evidence collected in several cell types, including epithelial cells, erythrocytes, tumor cells, astrocytes, and neurons, shows that 6-NBDG and 2-NBDG are transported via the glucose transporter and that 2-NBDG is phosphorylated intracellularly by hexokinase (Kim et al. 2012). 6-NBDG is transported very slowly and is only partially inhibited by the GLUT inhibitor cytochalasin B (Cloherty et al. 1995). 6-NBDG uptake is saturable with a Km of about 300 µM, shows a temperature dependence consistent with a carrier-mediated process (Porras et al. 2008), and can be inhibited up to 80% by the exofacial GLUT inhibitor 4,6-ethylidine-d-glucose or by neuronal activation (Loaiza et al. 2003; Porras et al. 2004; Barros, Bittner et al. 2009). The uptake properties are consistent with a kinetic model in which 6-NBDG binds to the glucose transporter with a much higher affinity than glucose itself, but translocates extremely slowly, resulting in slower uptake. The model also explained why cytochalasin B inhibits the uptake of glucose better than the uptake of NBDG (Barros, Bittner et al. 2009). As an extension of the previous characterization, the present study has contributed by showing the l-stereoisomer of the 2-NBDG to be less efficiently handled by the transporter than the d-stereoisomer. However, it is remarkable that 2-NBDLG has been taken up by glial cells and neurons at all. According to the stereospecific properties that have been assigned to the GLUTs, the analog based on l-glucose was not expected to be a substrate for the transporters. Following the predictions of 2-NBDG in terms of affinity and transport rates (Barros, Bittner et al. 2009), it is reasonable that the large hydrophobic fluorophore also increased the potential binding of 2-NBDLG to the glucose transporters and therefore its chance of being transported. Thus, we think that the difference between 2-NBDG and 2-NBDLG represents only a fraction of the specific uptake.
Glucose measurements in astrocytes with a FRET nanosensor have shown that 6-NBDG and glucose are equally good at detecting acute changes in transport capacity (Loaiza et al. 2003; Bittner et al. 2011). In summary, available experimental evidence and kinetic analyses show that 6-NBDG and 2-NBDG are transported largely through glucose transporters, with a minor contribution by simple diffusion.
While the uptake of these tracers is much slower than that of glucose, it is still proportional to the number and intrinsic activity of GLUTs and can be used quantitatively to monitor changes in real time. However, before this study, it was not known whether neurons and astrocytes might differ in the way they handle NBDGs relative to glucose, a key piece of information for the interpretation of in situ data. Thanks to the recent availability of methods to measure glucose using a FRET nanosensor, we could address this issue directly by comparing the uptake of glucose and 6-NBDG in cultured neurons and astrocytes. The results in astrocytes confirmed our previous observation that 6-NBDG is transported 100 times slower than glucose (Barros, Bittner et al. 2009). Notably, neurons took up 6-NBDG at a rate only 16 times slower than that for glucose, which means that in these cells 6-NBDG uptake overestimates glucose uptake when compared with the uptake by astrocytes or fibroblasts. We conclude that astrocytes in hippocampal slices and Bergmann glia in cerebellar slices transport glucose much more rapidly than their neighboring neurons, and that the same applies for the somatosensory cortex in vivo (Chuquet et al. 2010). A caveat to this conclusion, and for that matter to all culture cell data, is that it is not known to what extent the glucose transporters in cultured astrocytes and neurons behave like the transporters in situ.
A mathematical model of glucose dynamics in brain tissue was formulated based on the high-glucose transport activity of cerebellar granule cells in culture (Mangia et al. 2009). However, as shown here and in our previous study, cerebellar granule cells do not present high rates of glucose transport or glucose metabolism when studied in slices. A possible reason for this discrepancy is that in culture, neurons may lack a local inhibitory signal, for instance from glial cells. Also, cerebellar granule cells in culture (but not in situ) are notable for requiring high concentrations of potassium for their survival, a non-physiological condition likely to stimulate the Na+/K+ ATPase and glycolysis.
Another finding of this study is that astrocytes metabolized 2-NBDG faster than neurons. So to what extent does 2-NBDG phosphorylation represent glucose phosphorylation? In contrast to GLUTs, there is no differential expression of hexokinase isoforms between neurons and astrocytes, both cell types expressing mainly hexokinase I (Wilson 2003). Without evidence for a differential kinetic behavior, it seems reasonable to consider 2-NBDG as an unbiased tracer of glucose phosphorylation when comparing neurons and astrocytes. Under this assumption, the current observation that astrocytes metabolized 2-NBDG faster than neurons, even though neurons are relatively better at transporting these dyes, suggests that astrocytes indeed metabolize glucose at a much higher rate than neurons. As neurons are regarded as consuming more energy than astrocytes, higher transport and metabolism of glucose in astrocytes relative to neurons can only be reconciled with the transfer of energy-rich compounds from astrocytes to neurons. Lactate is the other major fuel present in the brain tissue at millimolar levels and has been shown capable of sustaining neuronal energy status and neuronal signaling both in vitro (reviewed by Pellerin et al. 2007) and in vivo (Wyss et al. 2011). Given the lack of afferent input and weaker electrical activity, the metabolic status of an acute slice is more representative of the resting condition than of the activated condition. However, even in the resting state, neurons are thought to consume more energy than astrocytes (Attwell and Laughlin 2001). Therefore, our results here provide support for the existence of robust astrocyte-to-neuron lactate shuttling in the resting state.
Funding
This work was supported by the Deutsche Forschungsgemeinschaft (DE 231/19-3, SPP 1172) and LSP RIMP to JWD, Fondecyt 1100936 to LFB, and a joint DFG-Conicyt grant to JWD and LFB (DFG-12, DE 231/25-1). The Centro de Estudios Científicos (CECs) is funded by the Chilean Government through the Centers of Excellence Base Financing Program of CONICYT and Gobierno Regional de Los Ríos.
Notes
We are grateful to Dr. Frank Kirchhoff, Homburg/Saar, Germany, who provided the knock-in mouse ‘GRFT’. We thank Sandra Bergstein, Karin Alegría, and Jessica Molina for technical assistance and Karen Everett for critical reading of the manuscript. Conflict of Interest: None declared.