


Abstract
The temporal and spatial characteristics of the cortical processes responsible for absolute pitch (AP) and relative pitch (RP) were investigated by multi-channel event-related potentials (ERPs). Compared to listening, pitch-naming of tones in non-possessors of AP elicited three ERP components (P3b, parietal positive slow wave, frontal negative slow wave) over parietal and frontal scalp between 300 and 900 ms in latency, representing the cortical processes for RP. Possessors of AP elicited a unique left posterior-temporal negativity (‘AP negativity’) at 150 ms in both listening and pitch-naming conditions, representing the cortical processes for AP that were triggered by pitch input irrespective of the task the subjects were asked to perform. Congruency of auditory Stroop stimuli modulated the amplitudes of parietal positive slow wave (non-possessors of AP) and ‘AP negativity’ (possessors of AP), confirming that these components reflect the verbal labeling or pitch-to-pitch-name associative transformation that is central to pitch-naming. These results are consistent with the hypothesis that AP is subserved by neuronal processes in the left auditory association cortex that occur earlier and more automatically than the processes for RP, which involve broader areas of the cortex over longer periods of time.
Introduction
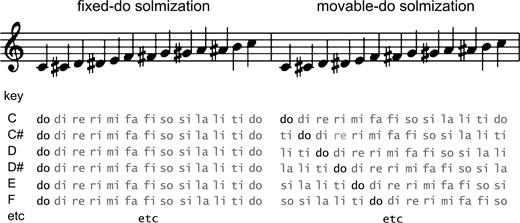
The continuum of sound frequency is psychologically categorized into discrete pitches at certain intervals (Burns, 1999) which serve as basic elements for musical activities in many cultures. Such categorization essentially enables verbalization, and pitches subsequently acquire their respective names. In Western music, there are two systems for associating pitches and pitch names: fixed and unfixed (Fig. 1). The former is represented by fixed-doh solmization (Randel, 1986), in which each solfege syllable (doh, ray, me, etc.) is associated in a fixed relationship with a single pitch class (C, D, E, etc.) irrespective of key. In movable-doh solmization, by contrast, syllables represent different pitches under different keys, as doh always represents the keynote and pitches of the other syllables are determined according to their interval relations to the pitch of doh.
Fixed and unfixed systems for naming pitches. In fixed-doh solmization, each pitch of an ascending chromatic scale is fixedly associated with a single solfege syllable irrespective of key. In movable-doh solmization, the pitches are associated with different names under different keys, as doh always represents the keynote.
The fixed and unfixed solmization systems in music apparently parallel the two neural strategies for associating pitches and pitch names, namely pitch-naming using absolute pitch (AP) and that using relative pitch (RP). A series of behavioral studies (Miyazaki, 1990, 1992, 1995, 2000, Miyazaki and Rakowski, 2002) has shown that possessors of AP — the ability to name pitches of arbitrary tones or to produce a tone with designated pitch without being given a reference tone (Takeuchi and Hulse, 1993; Ward, 1999; Zatorre, 2003) — spontaneously utilize the fixed naming system, whereas those without AP utilize the unfixed system. Auditory Stroop tasks clearly differentiated their solmization strategies (Miyazaki, 2000). Stimuli concurrently held both pitch and pitch name information that were either congruent or incongruent (e.g. pitch of C sung as doh or ray). When possessors and non-possessors of AP reported the pitch while ignoring the syllable, reaction times were shorter in the former, irrespective of congruency, demonstrating faster naming consistent with their unambiguously fixed pitch–pitch-name association. More striking, when the subjects reported the syllable ignoring pitch, reaction times were longer for incongruent than for congruent stimuli in possessors of AP, further demonstrating that their fixed pitch-naming was automatic.
The auditory cortical anatomy of AP possessors is organized differently to that of non-possessors (Schlaug et al., 1995; Zatorre et al., 1998; Keenan et al., 2001). Moreover, various auditory stimuli are processed by distinct neuronal circuitries in AP possessors as evidenced by electrophysiological (Klein et al., 1984; Hantz et al., 1992; Wayman et al., 1992; Barnea et al., 1994), magnetic field (Hirata et al., 1999) and neuroimaging (Ohnishi et al., 2001) studies. Nevertheless, to our knowledge, no systematic studies have as yet investigated the cortical processes for their differential solmization strategies in AP possessors and non-possessors.
In this event-related potential (ERP) study, two experiments were conducted to temporally and spatially characterize cortical processes for naming pitches using AP or RP. The pitch-naming experiment first identified the ERP correlates of AP and RP by manipulating the task demand of overt pitch-naming in listeners with various levels of AP possession. The auditory Stroop experiment further elucidated the functional significance of the identified components in relation to solmization by probing the effect of stimulus incongruency on the ERPs: components reflecting the pitch-to-pitch-name associative transformation were expected to be affected by the manipulation of this stimulus feature.
Materials and Methods
Subjects
Forty-five right-handed subjects (18–28 years old, three males) participated in the pitch-naming experiment. They were categorized into four age-matched groups according to their levels of AP and musical training: High-AP, Mid-AP, Low-AP and Untrained (Table 1). Subjects who had received no more than one year of formal training in music (see below) were categorized as Untrained. The remaining subjects were sorted by their AP ability into three groups (High-AP, Mid-AP and Low-AP). In the auditory Stroop experiment, 22 right-handed subjects (18–22 years old, all female) were sorted by their AP ability into two age-matched groups, High-AP and Low-AP (Table 1). Nine participated in both experiments. None were professional musicians. The subjects were predominantly females because AP possessors were more readily available to us in this gender at our university. All gave written informed consent, and the study was carried out in accordance with the human research guidelines of the Internal Review Board of the University of Niigata.
Musical profiles of subject groups and their behavioral performance
| Group (no. of subjects) | Musical profiles | Behavioral results | |||
|---|---|---|---|---|---|
| AP test (%) | Training (years) | ||||
| Pitch-naming experiment | % correct in Naming Task | ||||
| High-AP (11) | 98 (3)a | 13 (4)a | 99.9 (0.3)a | ||
| Mid-AP (11) | 60 (20)b | 13 (3)a | 99.9 (0.3)a | ||
| Low-AP (11) | 14 (7)c | 8 (2)b | 99.2 (1.8)a | ||
| Untrained (12) | 8 (7)c | 0 (0.4)c | 88.8 (12.3)b | ||
| Auditory Stroop experiment | Reaction time (ms) | ||||
| Pitch Task | Syllable Task | ||||
| High-AP (11) | 97 (3)a | 15 (4)a | Cong: 574 (147) | Cong: 544 (156) | |
| Incong: 668* (168) | Incong: 589* (175) | ||||
| Low-AP (11) | 10 (11)c | 5 (4)b | Cong: 935 (190) | Cong: 607 (90) | |
| Incong: 1059* (214) | Incong: 616 (97) | ||||
Values represent mean (standard deviation). Within each column, superscripts mark statistically significant differences, P < 0.01, in the order of a > b > c, and common superscripts across the two experiments indicate statistically comparable means (see Materials and Methods). Asterisk indicates significantly longer reaction times for incongruent (Incong) than for congruent (Cong) stimuli, P < 0.001.
The subjects' AP ability was assessed by a pitch-naming test (Miyazaki, 1990), in which they identified pitch classes (e.g. C, C#, D, etc., not distinguishing octaves) of 60 randomly presented piano tones covering five octaves, without feedback about correctness of their responses. No training of this task preceded the test. The level of musical training was determined based on years of music training given by professional music teachers outside standard school education. Because all participants, including those in the Untrained group, had received at least nine years of basic-level music education as one of the curriculum requirements for all schools throughout Japan, the task instructions were fully understood irrespective of group.
AP test scores and years of musical training were compared across subject groups separately for each experiment by one-way analysis of variance (ANOVA). The analysis disclosed that the main effect of group was significant for AP test scores and years of training in both experiments, P < 0.001. In the pitch-naming experiment, all pair-wise comparisons (Tukey–Kramer's test) of AP test scores were significant except between the Low-AP and Untrained groups, P < 0.01. With regard to years of musical training, all pair-wise comparisons were significant except between the High-AP and Mid-AP groups, P < 0.01. AP test scores and years of training were comparable between the High-AP group in the first experiment and the High-AP group in the second experiment when compared by t-test, P > 0.05, as were the two measures of the two Low-AP groups. Table 1 summarizes these results.
Stimuli and Procedure
In the pitch-naming experiment, stimuli were sinusoidal tones of pitches C3 (262Hz), D3 (294Hz) and E3 (330Hz), 350 ms in duration (10 ms rise-time, 50 ms fall-time). Two separate tasks were assigned to the same set of stimuli, namely Naming Task and Listening Task. In the Naming Task, subjects reported vocally the pitches of stimuli as either doh, ray or me after hearing a cue (wide-band noise, 10 ms duration) presented 900–1100 ms after the onset of the stimuli and 2 s before the next stimulus was presented. No feedback about the correctness of their responses were given. All aspects of the Listening Task were the same as above, except that the subjects responded by vocalizing the syllable ‘ah’ to all stimuli irrespective of their pitches. Each task was conducted as a separate block consisting of 90 trials, lasting ∼4.5 min. The order of the tasks was balanced between subjects.
In the auditory Stroop experiment, stimuli were notes of pitches C3, D3 and E3, sung by a trained male vocalist with syllables doh, ray or me, 350 ms in duration. There were nine stimuli: C3-doh, C3-ray, C3-me, D3-doh, D3-ray, D3-me, E3-doh, E3-ray and E3-me, three of which were congruent. Two different tasks were assigned to the same set of stimuli, namely Pitch Task and Syllable Task. In the Pitch Task, subjects reported orally the pitches of the stimuli as either doh, ray or me, ignoring the syllables with which they were sung. In the Syllable Task, they reported vocally the syllables of stimuli as either doh, ray or me, ignoring pitch. For measuring reaction times, subjects responded as accurately and as quickly as possible in a behavioral experiment. Each task was presented in a separate block consisting of 180 stimuli (congruent stimuli:incongruent stimuli = 1:1) randomized in sequence with an inter-trial interval (ITI) of 1.5 s. The order of the blocks was balanced between subjects. The ERP experiment was conducted after the behavioral experiment using the same stimuli. The tasks were also the same, except that the subjects responded vocally after hearing a cue (wide-band noise, 10 ms duration) presented 900–1100 ms after the onset of the stimuli and 2 s before the next stimulus was presented. [This was the same time schedule as that employed in the pitch-naming experiment. The insertion of the response cue obviated vocalization-related artifacts on electroencephalogram (EEG) data segments utilized for analyses.] Pitch Task and Syllable Task each consisted of a randomized sequence of 180 trials (congruent stimuli:incongruent stimuli = 1:1) split into first and second blocks, lasting ∼4.5 min each. The order of the blocks was balanced between subjects. Throughout both experiments sounds were presented binaurally at comfortable listening levels.
EEG Recording and Analysis
Subjects sat in a comfortable chair in a temperature controlled, electrically shielded and sound attenuated room. Twenty-one Ag electrodes were applied according to the international 10–20 system (Jasper, 1958), positioned at Fpz, Fp1, Fp2, Fz, F3, F4, F7, F8, Cz, C3, C4, T3, T4, T5, T6, Pz, P3, P4, Oz, O1 and O2. Horizontal (hEOG) and vertical (vEOG) electro-oculograms (EOGs) were also recorded. All channels were recorded against linked earlobe electrodes. EEG and EOG were amplified by a SynAmp amplifier (Neuroscan Labs, El Paso, TX) at 16-bit resolution, gain of 500, and at an analog–digital conversion rate of 1 kHz, band-passed between 0.05 and 100 Hz. Electrode impedance was kept below 5 KΩ throughout the recording.
The EEG data from 100 ms prior to and 900 ms following the onset of each stimulus were segmented and baseline-corrected by the pre-stimulus period average. Then the data were artifact rejected at ±100 μV using Fpz, Fp1, Fp2, F7, F8, T3, T4 and the EOG channels. The non-rejected data segments were averaged irrespective of subjects' behavioral responses, time-locked to the stimulus onset, separately for each task to obtain ERPs, which were then low-pass filtered at 30 Hz (48 dB/oct). Finally, the ERPs were group averaged separately for each group and condition.
In the pitch-naming experiment, ANOVA at selected latency ranges was conducted using all electrodes to delineate electrophysiological correlates of RP. P values were adjusted by Greenhouse–Geisser correction, ϵ, whenever appropriate. ϵ is reported in these cases. Post-hoc analyses at selected electrodes (Pz for P3b, Pz for posterior parietal slow wave, Fpz for frontal negative slow wave) were performed when the main effect (or interaction) of interest or its interaction with the electrode factor was significant. To analyze the electrophysiological correlate of AP (‘AP negativity’), t-tests were performed (only) at the electrode (T5) at which AP negativity had its maximal amplitude over the scalp as observed in the group-averaged ERP. The global analysis of ERP activity in the AP negativity time slot by ANOVA using all channels did not reveal any significant effects. Although it remains speculative, this is likely to be primarily due to low peak amplitude of AP negativity (∼1 μV, T5) which tended to be buried within the large central N1 component (∼10 μV, Cz). Greater sensitivity for detecting the AP negativity was attained by analyzing at T5 where AP negativity was maximal and N1 was reduced in amplitude.
In the auditory Stroop experiment, focused statistical analyses of an ERP component at a single electrode site (post-hoc analyses in ANOVA or t-tests) were performed only at the electrode used in the previous experiment as representing that specific ERP component of interest. One-way ANOVA with four (pitch-naming experiment) or two (auditory Stroop experiment) levels of group was used to compare behavioral measures (percentage of correct responses and reaction time), followed by Tukey–Kramer's post-hoc test. All P-values represent two-tailed probabilities unless specified.
Results
Pitch-naming Experiment
Substantial differences in ERPs were observed between the Naming Task and Listening Task in listeners with lower levels of AP. Naming-minus-Listening difference waves in these subjects reflected the cortical processes for RP, because the Naming Task but not the Listening Task involved overt naming of pitches that inevitably necessitated their utilization of RP: behavioral results confirmed that the task had been executed properly. On the other hand, ERPs were more similar between the Listening Task and Naming Task in individuals of the High-AP group, consistent with the previous behavioral finding that they name pitches covertly and automatically even when this is unnecessary (Miyazaki, 2000). (See also results of the next experiment.) Reflecting this automatic pitch-naming, the ERPs of AP possessors were distinguishable from those of non-possessors in the Listening condition ∼150 ms in latency, revealing an electrophysiological marker of AP.
Behavior
Table 1 summarizes the behavioral results in the Naming Task. All three musically trained subject groups (High-AP, Mid-AP and Low-AP) performed almost perfectly, whereas the task was apparently more difficult for untrained listeners (Untrained). There was a significant main effect of group, F(3,41) = 8.5, P < 0.001, and the Untrained group performed significantly less well than each of the other groups by pair-wise comparisons, P < 0.01.
ERP Correlates of Relative Pitch
Group-averaged ERPs are shown in Figure 2a. Apparently, the task demand of overt pitch naming had a differential effect on the waveforms across subject groups. Naming-minus-Listening difference waves depict this more clearly in Figure 3a. Three ERP components — two parietal positivities and one frontal negativity — were identified as being greater in amplitude in listeners with lower levels of AP, reflecting the cortical processes for RP.
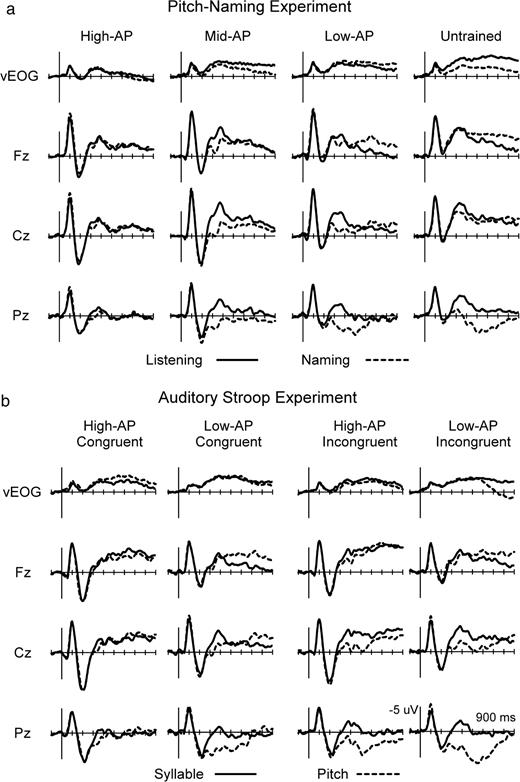
Group averaged ERPs in pitch-naming experiment (a) and auditory Stroop experiment (b). The baseline condition (solid) was to listen to simple tones (pitch-naming experiment) or to repeat syllables of auditory Stroop stimuli (auditory Stroop experiment). Overt naming of pitches (dotted) in both experiments significantly affected the ERPs in a manner dependent on AP ability, revealing the ERP correlates of RP (Fig. 3). See Figure 4 for the locations of electrodes on the scalp.
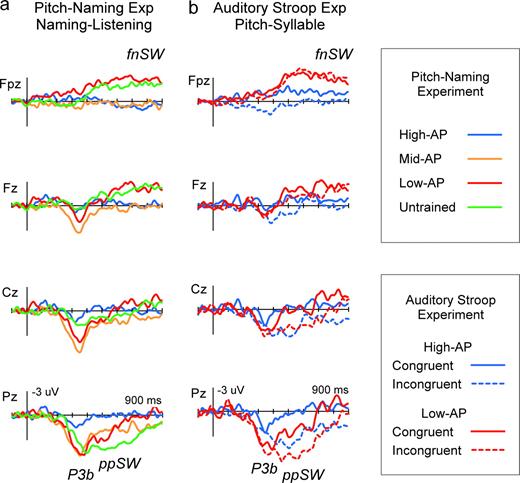
The ERP correlates of RP. Naming-minus-Listening difference waves in the pitch-naming task revealed P3b, parietal positive slow wave (ppSW) and frontal negative slow wave (fnSW), representing the cortical processes for pitch-naming using RP (a). Significant P3b was elicited in the Mid-AP, Low-AP and Untrained groups. Significant ppSW was found in all groups except the High-AP group, extended in duration in Untrained. fnSW was observed specifically in the Low-AP and Untrained groups. Auditory Stroop Experiment replicated the elicitation of these components in Pitch-Task-minus-Syllable-Task difference waves (b).
P3b
The earlier of the two positive components was a P3b-like wave (Fig. 3a), which peaked centro-parietally between 300 and 450 ms. Statistically significant elicitation of this wave was observed in all groups except the High-AP, when the ERP amplitudes (averaged over 300–450 ms) were analyzed using a three-way ANOVA model (4 Groups × 2 Tasks × 21 Electrodes). The Group × Task × Electrode interaction was significant, F(60,820) = 2.9, P < 0.005, ϵ = 0.195, and post-hoc analysis indicated that the simple interaction of Group × Task was significant at Pz, F(3,861) = 6.8, P < 0.001. Further analysis at Pz revealed that the simple simple main effect of Task was significant in the Mid-AP [F(1,861) = 42.2, P < 0.001], Low-AP [F(1,861) = 48.6, P < 0.001] and Untrained [F(1,861) = 41.7, P < 0.001] but not in the High-AP group [F(1,861) = 2.2, P > 0.05]. Musical training had negligible effect on this measure, as pair-wise comparisons by Tukey's HSD test did not find significant differences (P > 0.05) in P3b amplitude among the Mid-AP, Low-AP and Untrained groups that differed significantly in their levels of musical training (Table 1). These results showed that significant P3b elicitation accompanied the utilization of RP irrespective of musical experience.
Parietal Positive Slow Wave (ppSW)
A parietal positive ‘slow wave’ (Squires et al., 1975; Ruchkin et al., 1980) immediately followed the P3b in all except the High-AP group (∼450 ms, Fig. 3a). That is, statistical analysis of the ERP amplitudes averaged over 450–550 ms yielded the following results. In the three-way ANOVA, the Group × Task × Electrode interaction was significant, F(60,820) = 3.2, P < 0.005, ϵ = 0.141, and in post-hoc analysis the simple interaction of Group × Task was significant at Pz, F(3,861) = 6.8, P < 0.001. At Pz, the simple simple main effect of Task was significant in the Mid-AP [F(1,861) = 9.9, P < 0.005], Low-AP [F(1,861) = 22.7, P < 0.005] and Untrained [F(1,861) = 40.9, P < 0.005] groups, but not in the High-AP group, P > 0.05. ppSW was more sustained and had a longer duration in the Untrained group compared with the Mid-AP and Low-AP groups (Fig. 3a). The identical methods of analysis conducted using amplitudes averaged over 550–750 ms indicated that the simple simple main effect of Task at Pz remained significant in this latency range only in the Untrained group, F(1,861) = 26.5, P < 0.005. (The Group × Task × Electrode interaction and the Group × Task simple interaction at Pz were both significant, P < 0.005.) Therefore, ppSW was found to represent an aspect of cortical processes for RP, the processing time of which could be shortened by training in music.
Frontal Negative Slow Wave (fnSW)
In the Low-AP and Untrained groups, P3b was followed by a frontal negative slow wave that emerged after 400 ms and was sustained to the end of the analyzed time window (Fig. 3a). Using amplitudes averaged over the 500–900 ms window, the three-way ANOVA revealed a significant Group × Task × Electrode interaction, F(60,820) = 2.7, P < 0.05, ϵ = 0.119, and the simple interaction of Group × Task was significant at Fpz, F(3,861) = 14.8, P < 0.005. At Fpz, the simple simple main effect of Task was significant in the Low-AP [F(1,861) = 16.4, P < 0.001] and Untrained [F(1,861) = 9.0, P < 0.005] groups, but not in the other two groups, P > 0.05. Because the Mid-AP group did not elicit this wave, fnSW apparently reflected cortical processes for RP that were particularly necessary for those who had no or little AP or those who had not received more extensive musical training (Table 1).
ERP Correlate of Absolute Pitch (AP)
Although the Listening Task did not require pitch-naming in an overt form in all subject groups, there was a remarkable difference in the ERPs between possessors and non-possessors of AP in this task, as expected by the behavioral finding that AP possessors inescapably name pitches in an covert form even when it is unnecessary.
Left Posterior Temporal Negativity (AP Negativity)
The High-AP group elicited a unique left posterior temporal negativity in the Listening Task, which we refer to here as ‘AP negativity’. It peaked at 150 ms in latency, and was maximal in amplitude at T5 (Fig. 4a,b). Analyzed at T5, the ERP amplitude (averaged over 145–155 ms) was significantly negative compared to the pre-stimulus baseline in the High-AP group, t(10) = 4.4, P < 0.005, but not in the Mid-AP and Low-AP groups, P > 0.05, demonstrating the specificity of AP negativity to high-level AP possession. Because the High-AP and Mid-AP groups had received comparable levels of musical training (Table 1), the unique elicitation of AP negativity in the High-AP group could not be explained by general training in music alone. Although the result of the t-test indicated significant negativity also in the Untrained group, t(11) = 2.6, P < 0.05, this reflected the decreasing phase of the normal N1 component (Näätänen and Picton, 1987; Woods, 1995), which peaked earlier, more anteriorly and more symmetrically than AP negativity (see T3 and T4 in Fig. 4a). A marked positive deflection at 100 ms post-stimulus before the occurrence of AP negativity at T5 also contrasted the waveforms of the High-AP and Untrained groups: the wave (averaged over 95–105 ms) was significantly negative compared to the baseline in the Untrained group reflecting normal N1 elicitation, t(11) = 2.4, P < 0.05, but not in the High-AP group, P > 0.05, one-tailed. AP negativity exhibited a unique scalp topography that was dominant over the left posterior temporal cortex in the Listening Task (Fig. 4b). In addition, as is apparent from the topographical map (Fig. 4b), a similarly left-lateralized temporal negativity was also found in the Naming Task. Overall, these results were consistent with the interpretation that AP negativity represented the neural processes for AP in the left auditory association cortex that was triggered automatically by pitch input irrespective of task. Nevertheless, the precise sources of AP negativity remains to be determined.
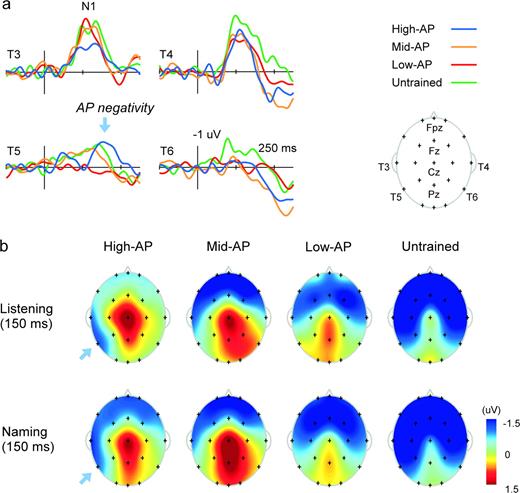
The ERP correlate of AP as identified in the pitch-naming experiment: temporal (a) and spatial (b) characteristics. A unique left posterior temporal negativity, or AP negativity (blue arrow), was found in the High-AP group undertaking the Listening Task, peaking at 150 ms maximal at T5. AP negativity was distinguishable from the N1 component that peaked earlier, more anteriorly and more symmetrically (see T3 and T4 in a). Topographical maps illustrate the distribution of this component over left posterior temporal scalp (b, top). A similarly left-lateralized wave was also found in the Naming Task in the High-AP group (b, bottom).
Auditory Stroop Experiment
Two groups of listeners that matched the High-AP or Low-AP group of the previous experiment in musical profiles participated in this experiment (Table 1). In the Pitch Task, subjects reported the pitch of auditory Stroop stimuli irrespective of the syllable with which they were sung. In the Syllable Task, they repeated the syllable of the stimuli ignoring pitch. The ERP correlates of AP and RP were all identified validating the previous experiment. More important, ppSW and AP negativity were significantly affected by the congruency of auditory Stroop stimuli, indicating that they reflected the pitch-to-pitch-name associative transformation central to solmization.
Behavior
Results essentially replicated the earlier findings by Miyazaki (2000). Reaction times (RTs) are presented in Table 1. The data were analyzed by two-way (Task × Congruency) repeated-measures ANOVA in each group. In the Low-AP group, RTs were significantly longer for incongruent stimuli than for congruent stimuli in Pitch Task [main effect of Congruency, F(1,10) = 15.2, P < 0.005; simple main effect of Congruency in Pitch Task, F(1,20) = 29.4, P < 0.001], but such an effect was not observed in Syllable Task [simple main effect of Congruency in Syllable Task, F(1,20) = 0.2, P > 0.05]. Disregarding the effect of congruency, RTs were significantly longer for answering the pitches (mean 997 ms) than for answering the syllables (611 ms), F(1,10) = 79.7, P < 0.001.
In the High-AP group, RTs were significantly prolonged by stimulus incongruity not only in Pitch Task [main effect, F(1,10) = 43.7, P < 0.001; simple main effect, F(1,20) = 42.2, P < 0.001] but also in Syllable Task [simple main effect, F(1,20) = 9.5, P < 0.001], indicating automaticity of their pitch-naming. Disregarding the effect of congruency, the RTs were comparable between the two tasks (621 and 566 ms for Pitch Task and Syllable Task respectively), F(1,10) = 2.9, P > 0.05, demonstrating fast pitch-naming. In fact, the RTs of the High-AP group were shorter than those of the Low-AP group in Pitch Task, F(1,40) = 31.8, P < 0.001, though comparable in Syllable Task, F(1,40) = 0.5, P > 0.05, when compared directly by three-way split-plot ANOVA. Converging results were obtained with error rates.
ERP: Replication
Group-averaged ERPs are shown in Figure 2b, separately for congruent and incongruent stimuli. Because only the Pitch Task required overt pitch naming, Pitch-Task-minus-Syllable-Task difference waves in the congruent-stimulus condition were expected to reveal P3b, ppSW and fnSW in the Low-AP group, whereas AP negativity was expected to be found in the High-AP group in regards to both tasks. (The effects of incongruity will be presented in the next section.)
The three ERP correlates of RP were all apparent in the Pitch-Task-minus-Syllable-Task difference wave: P3b peaked between 300 and 400 ms at Pz, ppSW immediately followed the P3b and peaked around 500 ms, and fnSW began after 400 ms and continued to the end of the analyzed time window at Fpz (Fig. 3b). The data in the congruent-stimulus condition were analyzed using a three-way ANOVA model (Group × Task × Electrode) analogous to that employed in the previous experiment. Post-hoc tests for the simple simple main effect of Task at single electrodes were conducted after confirming that the main effect of Task or the Group × Task interaction (or their interactions with Electrode) was significant and that the simple main effect of Task or its interaction with Group at the electrode of interest was also significant, P < 0.05. As a result, there were significant elicitations of P3b [F(1,420) = 66.1, P < 0.001, 300–400 ms, Pz], ppSW [F(1,420) = 23.0, P < 0.001, 450–550 ms, Pz] and fnSW [F(1,420) = 30.9, P < 0.001, 500–900 ms, Fpz] in the Low-AP group. Although elicitations of P3b [F(1,420) = 12.7, P < 0.001] and fnSW [F(1,420) = 4.3, P < 0.05] were also significant in the High-AP group, their amplitudes were significantly smaller compared to the Low-AP group [P3b, F(1,420) = 10.4, P < 0.005; fnSW, F(1,420) = 6.1, P < 0.05], and the elicitation of ppSW was not significant, P > 0.05.
Evidence for the elicitation of ERP correlate of AP, or AP negativity, was found specifically in the High-AP group. The unique waveform observed at ∼150 ms at T5 in the High-AP group in this experiment (Fig. 5a) strongly resembled that depicted in the previous experiment (Fig. 4a), despite different stimuli and tasks. Analyzed at T5, the ERP amplitude (averaged over 145–155 ms) was significantly negative compared to the pre-stimulus baseline in the High-AP group in the Pitch Task, t(10) = 2.3, P < 0.05, although it did not reach statistical significance in the Syllable Task, P > 0.05. In the Low-AP group, by contrast, the negativity was not apparent in the waveforms (Fig. 5a) and statistical tests did not find significant negativity regarding both tasks, P > 0.05. The positive deflection at 100 ms before the occurrence of AP negativity also contrasted the waveforms of the High-AP and Low-AP groups. Analyzed at 95–105 ms, the wave at T5 was significantly negative compared to the baseline reflecting normal N1 elicitation only in the Low-AP Group, t(10) > 2.0, P < 0.05, one-tailed, for both tasks. The left-lateralized scalp distribution of this negativity was also replicated (Fig. 5b, left), although the distribution was shifted somewhat more posteriorly than in the previous experiment.
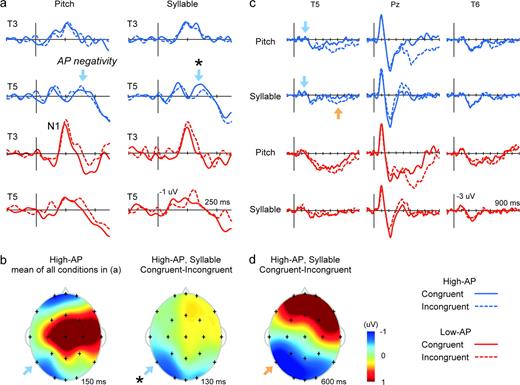
The ERP correlate of AP as identified in the auditory Stroop experiment. AP negativity (blue arrow) was elicited irrespective of task, localized at T5 uniquely in the High-AP group (a). Its left-lateralized distribution (b, left) resembled that observed in the pitch-naming experiment (Fig. 4b). The amplitude of AP negativity was significantly affected by stimulus incongruity, diminished for incongruent stimuli in Syllable Task (* in a and b). Furthermore, incongruent stimuli elicited a left-lateralized positive slow wave (orange arrow) in Syllable Task at T5, specifically in the High-AP group (c), scalp distribution of which resembled that of AP negativity (d).
ERP: Effects of Incongruity
Stimulus incongruity was expected to affect electrophysiological markers indexing cortical processes for pitch-to-pitch-name associative transformation, whereas it was less likely to modulate ERP components reflecting processes not directly involved in the associative mapping, e.g. identification of pitch or its retention in working memory.
Among the electrophysiological correlates of RP, only the ppSW amplitude was significantly modulated by stimulus incongruity. The Pitch-minus-Syllable difference waves obtained separately for congruent and incongruent stimuli (Fig. 3b) were submitted to three-way ANOVA (Group × Congruency × Electrode) using the 450–550 ms time window. Results revealed a significant Congruency × Electrode interaction, F(20,400) = 3.6, P < 0.05, ϵ = 0.106, and post-hoc analysis at Pz found a significant simple main effect of Congruency, F(1,420) = 38.4, P < 0.001, indicating increased ppSW amplitude for incongruent stimuli. There was no significant Group × Congruency interaction at Pz, P > 0.05, indicating that not only the Low-AP group but also the High-AP group elicited greater ppSW for incongruent stimuli (Fig. 3b). Incorrect pitch-syllable association might have activated the neural circuitry for RP even in those who usually used AP. Nonetheless, because significant ppSW was not found in the congruent condition in these subjects (Fig. 3b, see previous section for statistics), it did not constitute a significant component of pitch-naming using AP.
P3b and fnSW were unaffected by stimulus incongruity in either subject groups as apparent in Figure 3b. As for P3b (300–400 ms), AVOVA did not find a significant main effect of Congruency, P > 0.05, or interaction with Electrode, P > 0.05, ϵ = 0.146, Group × Congruency × Electrode interaction P > 0.05, ϵ = 0.133. Although the Congruency × Electrode interaction was significant for fnSW (500–900 ms), F(20,400) = 3.2, P < 0.05, ϵ = 0.120, neither the simple main effect of Congruency or its interaction with Group was significant at Fpz, P > 0.05. Therefore, these ERP components reflected cortical processes for RP that were less directly related to the pitch-pitch-name associative transformation than ppSW.
AP negativity was affected by stimulus incongruity, suggesting that it reflected the pitch–pitch-name associative transformation in possessors of AP (Fig. 5a, *). Its amplitude (averaged over120–150 ms) at T5 was significantly smaller for incongruent stimuli than for congruent stimuli in Syllable Task, t(10) = 3.5, P < 0.01. Moreover, the spatial distribution of this modulating effect was left-lateralized (Fig. 5b, right) and resembled the scalp topography of AP negativity (Fig. 5b, left). There was no measurable effect of incongruity on AP negativity in Pitch Task, however. The effect thus appeared to be task-dependent, possibly diminished by selective attention to pitch by as yet unknown mechanisms.
Further evidence that the function of neural processes underlying AP negativity concerned pitch–pitch-name associative mapping in AP possessors was provided by an elicitation of a late incongruence-related positivity over the left posterior temporal region in Syllable Task (Fig. 5c,d; orange arrow). That is, incongruent pitch had the significant effect of shifting the potential positively between 500 and 700 ms at T5 during syllable-repetition, t(10) = 3.0, P < 0.05, and strikingly, the left-lateralized spatial distribution of this effect again resembled the scalp topography of AP negativity (Fig. 5d).
Discussion
The pitch-naming experiment identified electrophysiological correlates of AP and RP by manipulating the task demand of overt pitch-naming in listeners with various levels of AP possession. The auditory Stroop experiment validated these results and further clarified the functional significance of the identified components in relation to pitch-naming. The electrophysiological correlate of AP was found early in latency (150 ms), localized over left posterior temporal cortex. The ERP correlates of RP were found later in latency (300–900 ms), distributed more broadly over parietal and frontal areas. Such contrasts in electrophysiological manifestations concurred with the qualitative distinction between the AP and RP strategies (Fig. 1). Due to the unambiguous pitch–pitch-name association, solmization using AP would require fewer processing steps than that using RP, the unfixed pitch–pitch-name association of which would necessitate additional processes of storing and comparing pitches in working memory. Such apparent simplicity of the AP strategy would allow fast and automatic processing involving limited areas of the cortex.
The ERP correlate of AP was identified as AP negativity, or the left posterior temporal negativity that peaked at 150 ms. The current data alone do not provide definitive evidence for determining the neural source(s) of this novel ERP component. Nevertheless, AP negativity was distributed over the scalp near the left planum temporale, the anatomical and functional organization of which has been reported to be unique in possessors of AP (Schlaug et al., 1995; Zatorre et al., 1998; Keenan et al., 2001; Ohnishi et al., 2001). Moreover, in a magnetoencephalography experiment that presented tones to possessors and non-possessors of AP, equivalent current dipoles at around the N1 latency were localized in the posterior temporal cortex uniquely in the left hemisphere of AP possessors (Hirata et al., 1999). Therefore, the spatial and temporal properties of AP negativity converged with previous descriptions of AP-related neural activities in the left auditory association cortex (planum temporale) that occur at a relatively early latency. Functional significance of this cortical area in relation to solmization has been unknown, but the current experiments suggested its role in the automatic associative transformation of pitch to pitch name. Considering that pitch-naming is essentially a verbal function, the left-lateralized localization of AP negativity was highly plausible. Previous imaging studies that presented pitch intervals or music as stimuli have identified the left dorsolateral prefrontal cortex as also constituting the neural substrates of AP (Zatorre et al., 1998; Ohnishi et al., 2001). However, evidence that this area contributed significantly to solmization was not obtained in the current study that employed pitch-naming of individual sounds. Areas other than the left planum temporale may exhibit AP-specific activities in musical tasks that involve cognitive functions other than solmization.
Solmization using RP could be considered as consisting of multiple cognitive components, that include (i) identification of pitch relatively against prior pitches; (ii) verbal labeling of the identified pitch; and (iii) retention of pitch in working memory while it is being named as well as to be utilized in coming trials. Occurring earlier than the two slow waves, P3b probably reflected the first process of utilizing working memory to identify pitch relative to prior pitches (Klein et al., 1984), a process underpinned by neural activities in frontal and temporo-parietal cortices (Zatorre et al., 1994; Soltani and Knight, 2000). The P3b amplitude was unaffected by stimulus incongruency, which was a reasonable result because pitch–syllable interaction could not have occurred at this stage of processing. In fact, the absence or diminution of P3b in auditory oddball tasks has long been considered the hallmark of AP (Klein et al., 1984; Hantz et al., 1992; Wayman et al., 1992; Barnea et al., 1994). In this study, small P3b was apparent also in the High-AP group (Fig. 3a,b), possibly indicating that these highly trained listeners implicitly compared the pitches using the neural processes for RP. (Their P3b elicitation was not statistically significant in the results presented in the first experiment, but the positivity was clearly discernible in Figure 3a, suggesting that a different analysis using a narrower time window centered to its peak might have yielded a statistically significant effect in this group.) P3b elicitation in possessors of AP was not incompatible with their AP-based solmization (Ward, 1999; Hirose et al., 2002), as long as the pitch comparison did not culminate in naming those pitches in subsequent processing. They did not elicit the two later slow waves, supporting this assumption.
Following P3b, ppSW was demonstrated to represent the process of giving verbal labels to pitches as identified and stored in working memory, or the second step of pitch-naming using RP. The significant effect of stimulus incongruity on ppSW amplitude showed that this ERP component reflected the pitch-to-pitch-name associative transformation. In general, ppSW is elicited by a variety of cognitive tasks that require further processing beyond target identification represented by P3b (Kok and Looren de Jong, 1980; Ruchkin et al., 1980; Johnson and Donchin, 1985; García-Larrea and Cézanne-Bert, 1998). More specifically, a parietal positive wave (labeled ‘P-CR’) that followed P3b (labeled ‘P-SR’) was related to stimulus–response mapping in choice reaction tasks (Falkenstein et al., 1993, 1994), relevant to our current interpretation of ppSW that it reflected the pitch–syllable (i.e. pitch–response) mapping. Incongruity might have necessitated additional cortical processes of negating the incorrect association as well as establishing the correct mapping in working memory, resulting in greater ppSW amplitude. Interestingly, significant ppSW was elicited by incongruent stimuli in the High-AP group. Violations of the correct pitch–syllable associative rule appeared to have activated the neural circuitry for RP even in those who usually used AP, to accommodate with inappropriate pitch–syllable association that had to be extinguished in working memory.
Occurring after P3b and unaffected by stimulus incongruity, fnSW probably signified retention of pitch in frontal-lobe working memory while it was being associated with its name (Ruchkin et al., 1990, 1995; Honda et al., 1996; Smith and Jonides, 1998; Fletcher and Henson, 2001). Because its amplitude was sustained not only throughout the entire ppSW latency range but also into the end of the analyzed time window, the results further suggested that the pitch was held in memory to serve as the reference pitch in coming trials. fnSW was found in the Untrained and Low-AP groups but not in the Mid-AP group in the pitch-naming experiment, a plausible result considering that the task would have required greater effort for maintaining pitch in memory in these listeners who possessed lower levels of AP and had received shorter musical training: large frontal negative slow waves were elicited only for exceptionally high information loads that required effortful retention, not necessarily correlating with behavioral performance (Ruchkin et al., 1990). The current fnSW was unlikely to have been a type of contingent negative variation (Walter et al., 1964) associated with the anticipation of response cue presented at 900–1100 ms, because it was an implausible supposition that such anticipation was greater in the pitch-naming condition compared with listening or syllable-repetition conditions specifically in the Low-AP and Untrained groups.
In contrast to AP negativity that could be considered as representing the specialized cortical function of pitch–pitch-name association in high-level AP possessors, P3b, ppSW and fnSW were more general waves that are observable under many different experimental conditions. A possible interpretation of these waves was that they reflected non-specific cortical processes (e.g. increased attention) associated with undertaking difficult auditory tasks. Nonetheless, it was difficult for such general factors alone to account for the entire results because behavioral measures in the first experiment did not distinguish the High-AP, Mid-AP and Low-AP groups in terms of task difficulty (Table 1) despite substantial differences in their P3b, ppSW and fnSW responses, and also because P3b and fnSW amplitudes were not significantly affected by stimulus incongruity (or difficulty) in the second experiment.
In summary, the findings demonstrate that verbalization of pitch can be accomplished by two distinct neural implementations in the human brain. An individual's choice of strategy appears to be determined during the critical period for acquiring language (Lenneberg, 1967; Krashen, 1973), as early training is crucial to obtaining AP (Takeuchi and Hulse, 1993; Ward, 1999; Zatorre, 2003). All of the High-AP subjects in the current experiments began their training between three and seven years of age. Such early training probably affects the organization of the cerebral cortex during development, establishing the fixed pitch–pitch-name association in the left auditory association cortices. In general, AP is defined to be the ability to name pitches without reference. Therefore, it is plausible to consider that fixed verbal labeling of pitches is likely to be the central cognitive component of AP, although non-verbal labeling may also be possible (Zatorre and Beckett, 1989). AP may represent a unique ‘verbal’ ability more than a prodigious ‘musical’ ability.
We thank Drs Ingrid L. Kwee and David L. Woods at University of California, Davis, for their valuable comments on an earlier version of the manuscript. The work was supported by grants from the Ministry of Education, Culture, Sports, Science, and Technology (Japan).
References
Barnea A, Granot R, Pratt H (
Burns EM (
Falkenstein M, Hohnsbein J, Hoormann J (
Falkenstein M, Hohnsbein J, Hoormann J (
García-Larrea L, Cézanne-Bert G (
Hantz EC, Crummer GC, Wayman JW, Walton JP, Frisina R D (
Hirata Y, Kuriki S, Pantev C (
Hirose H, Kubota M, Kimura I, Ohsawa M, Sakakihara Y (
Honda M, Barett G, Yoshimura N, Ikeda A, Nagamine T, Shibasaki H (
Jasper HH (
Johnson R, Donchin E (
Keenan J P, Thangaraj V, Halpern AR, Schlaug G (
Klein M, Coles MGH, Donchin E (
Kok A, Looren de Jong, H (
Krashen S (
Miyazaki K (
Miyazaki K (
Miyazaki K (
Miyazaki K (
Miyazaki K, Rakowski A (
Näätänen R, Picton R (
Ohnishi T, Matsuda H, Asada T, Aruga M, Hirakata M, Nishikawa M, Katoh A, Imabayashi, E (
Ruchkin DS, Sutton S, Kietzman ML, Silver K (
Ruchkin DS, Johnson R Jr, Canoune HL, Ritter W (
Ruchkin DS, Canoue HL, Johnson R Jr, Ritter W (
Schlaug G, Jäncke L, Huang Y, Steinmetz H (
Smith EE, Jonides J (
Squires NK, Squires KC, Hillyard SA (
Walter WG, Cooper R, Aldridge V, McCallum WC, Winter A (
Ward WD (
Wayman JW, Frisina RD, Walton JP, Hantz EC, Crummer GC (
Woods DL (
Zatorre RJ (
Zatorre RJ, Beckett C. (
Zatorre RJ, Evans AC, Meyer E. (
Author notes
1Center for Integrated Human Brain Science, Brain Research Institute, University of Niigata, Niigata, Japan and 2Department of Psychology, Faculty of Humanities, University of Niigata, Niigata, Japan