


Abstract
Although the basal ganglia play an important role in self‐generated movement, their involvement in externally paced voluntary movement is less clear. We recorded local field potentials (LFPs) from the region of the subthalamic nuclei of eight patients with Parkinson’s disease during the performance of a warned reaction time task in which an imperative cue instructed the subject to move or not to move. In ‘go’ trials, LFP activity in the beta frequency band (∼20 Hz) decreased prior to movement, with an onset latency that strongly correlated with mean reaction time across patients. This was followed by a late post‐movement increase in beta power. In contrast, in ‘nogo’ trials the beta power drop following imperative signals was prematurely terminated compared with go trials and reversed into an early beta power increase. These differences were manifest as power increases when go trials were subtracted from nogo trials. In six patients these relative beta power increases in nogo–go difference trials were of shorter latency than the respective reaction time. The findings suggest that, firstly, the subthalamic nucleus is involved in the preparation of externally paced voluntary movements in humans and, secondly, the degree of synchronization of subthalamic nucleus activity in the beta band may be an important determinant of whether motor programming and movement initiation is favoured or suppressed.
Introduction
The basal ganglia are generally considered to be less involved in externally than internally paced movements (Martin, 1967; Georgiou et al., 1993, 1994; Curra et al., 1997), providing a rationale for alternative motor strategies that seek to compensate for movement deficits associated with internal volitional motor control (Morris and Iansek, 1996). Functional neurosurgery provides an opportunity to record directly from the basal ganglia in the human and thereby to assess their involvement and the timing of any such involvement in different types of movement. The opportunity most commonly arises in patients with Parkinson’s disease undergoing implantation of the subthalamic nucleus (STN) for therapeutic stimulation at high frequency. Two possibilities exist: either single‐unit recordings can be made intra‐operatively through microelectrodes, or local field potentials (LFPs) can be recorded from the deep‐brain stimulation electrode (DBS electrode) in the few days that follow implantation, while the DBS electrode leads are externalized prior to connection to the subcutaneous stimulator. The latter approach, adopted here, allows patients to fully engage in lengthy cognitive motor paradigms.
There is good evidence that the LFP activity recorded in the cortex is representative of aggregate activity in large local synchronous neuronal populations (Creutzfeldt et al., 1966; Frost, 1968; Murthy and Fetz, 1992; Sanes and Donoghue, 1993; Baker et al., 1997; Donoghue et al., 1998). The basal ganglia do not share the laminar structure seen in the cortex, but nevertheless there is evidence that LFPs recorded in these nuclei also reflect synchronized aggregate activity (Tsubokawa and Sutin, 1972; Goto and O’Donnell, 2001). This view has recently been supported by studies in parkinsonian patients. Coupling has been demonstrated between single‐unit and LFP recordings in STN (Levy et al., 2002a), while oscillations in STN LFPs are coupled to those in distant but connected sites, such as the globus pallidus and cerebral cortex, suggesting that they are at least partly associated with synchronized presynaptic and/or postsynaptic effects (Brown et al., 2001; Marsden et al., 2001; Williams et al., 2002). Thus, changes in LFPs within the human STN may be informative about the aggregate activity of local neuronal elements and can be used to investigate the involvement of this nucleus in the preparation of externally paced voluntary movements.
LFP changes can be analysed in two complementary ways. The classical approach is to average activities that are phase‐locked to and, by implication, initiated by the imperative stimulus. This technique, however, fails to capture any activity that is not specifically phase‐locked to the stimulus. This includes the modulation of ongoing synchronized oscillatory activity, which may be involved in basal ganglia function (Brown et al., 2001; Marsden et al., 2001; Levy et al., 2002a, b; Williams et al., 2002). Here we analyse both STN activity that is phase‐locked to a stimulus instructing movement by averaging event‐related potentials and STN activity that is non‐phase‐locked, by averaging the power in a given frequency band with respect to the imperative stimulus. We were able thereby to detect any non‐phase‐locked event‐related desynchronizations (ERD, event‐related spectral power decrease) or synchronizations (ERS, event‐related spectral power increase). Using this technique, an ERD has been detected in the beta frequency band (11–30 Hz) in the human basal ganglia before internally paced movements (Cassidy et al., 2002; Priori et al., 2002; Sochurkova and Rektor, 2003), in line with studies demonstrating a Bereitschaftspotential (Rektor et al., 2001; Rektor, 2002) from the human basal ganglia. An ERD in the beta band may also accompany externally paced movement, but, given the brevity of the interval between the go cue and movement, it remains unclear whether the change in the basal ganglia activity actually precedes the movement and may therefore be involved in motor programming per se, as opposed to the online movement control and assessment of afferent feedback (Cassidy et al., 2002). On the other hand, with few exceptions (Neafsey et al., 1978; Schultz and Romo, 1992), studies of the discharge of single neurons in the basal ganglia tend to emphasize changes after the onset of movement‐related electromyographic activity (Georgopoulos et al., 1983; Kimura, 1990; Cheruel et al., 1994, 1996; Wichmann et al., 1994; Jaeger et al., 1995), suggesting that the activity in the basal ganglia is principally concerned with aspects of the control of ongoing movement, including feedback processing (DeLong et al., 1984). Nevertheless, the finding of a contingent negative wave in the basal ganglia does raise the possibility of the involvement of these nuclei in some degree of programming prior to externally driven movements (Bares and Rektor, 2001).
Here we show that an ERD in the STN precedes the motor response to imperative stimuli and has a latency that strongly correlates with reaction time. In addition we show that when this movement is inhibited the ERD is rapidly turned off. Taken together, these observations point to the involvement of the STN in the preparation of externally paced, as well as self‐paced, voluntary movements and raise the possibility that this is mediated, at least in part, by the dynamic modulation of the degree of synchronization in the beta band.
Material and methods
Patients and surgery
All patients participated with informed consent and the permission of the ethics committees of Charité Hospital and Amsterdam Medical Centre, and The Joint Medical Ethics Committee of The National Hospital for Neurology and Neurosurgery, and The Institute of Neurology, London. Their clinical details are summarized in Table 1. The surgical procedure and beneficial clinical effects of stimulation have been described previously (Limousin et al., 1995; Starr et al., 1998). DBS electrodes were inserted after STN had been identified by ventriculography in all but one patient (Case 5) and preoperative MRI. Simultaneous implantation of bilateral STN DBS electrodes was performed in all cases. No microelectrode recordings were used in the patients. The intended coordinates at the tip of contact 0 were 12 mm from the midline, 0–2 mm behind the midcommissural point and 4–5 mm below the AC‐PC (anterior–posterior commissure) line. MRI confirmed that at least one DBS electrode contact was within the STN, except in Case 7 from Amsterdam, who was not imaged postoperatively. A representative example of postoperative imaging of electrode position is illustrated in Fig. 1. The DBS electrode used was model 3389 (Medtronic Neurological Division, Minneapolis, MN, USA) with four platinum–iridium cylindrical surfaces (diameter 1.27 mm, length 1.5 mm) and a centre‐to‐centre separation of 1.5 mm. Contact 0 was the most caudal and contact 3 was the most rostral.
Paradigm
Subjects were seated and recorded while performing a visual choice reaction task. This consisted of watching a fixation cross at the centre of a portable PC screen while holding a push button in each hand. A warning signal (a pair of arrows) appeared either side of this central cross for 500 ms (Fig. 2), indicating the laterality of a subsequent imperative signal.
The warning arrows and fixation cross subtended a visual angle of 2°. Two‐and‐a‐half seconds after the disappearance of the warning cue, a 500‐ ms duration imperative ‘go’ signal appeared, with similar eccentricity. Subjects were instructed to press the button ipsilateral to the imperative signal as quickly as possible. Inter‐trial durations were pseudorandomized between 6 and 7s, limiting prediction of the timing of warning cues. Each block consisted of 100 such runs, with a few minutes rest between blocks. The warning cue was 100% informative of the subsequent imperative location, with the exception of 20% of trials, in which the go signal was replaced by a nogo signal (an S either side of the fixation cross). The latter instructed patients to withhold their response. Because go stimuli were far more common, all imperative cues were pre‐cued and the warning–go interval was fixed, engendering temporal expectancy of the imperative cue, the opportunity arose for some level of movement preprogramming following the warning cue and there was a strong tendency to respond upon stimulus presentation. Thus, active inhibition of movement was probably necessary following nogo cues. The order of trials was randomized. A short practice run of ten trials was given. In pilot recordings on four healthy subjects, the appearance of the cues did not elicit saccadic eye movements, as detected by electro‐oculography (using methods described in Brown and Day, 1997).
Recordings
In Cases 1–4 and 7 the blocks of trials were performed after the patient had been off medication overnight (OFF) and ∼1 h after the patient had taken levodopa 200 mg, given in combination with a decarboxylase inhibitor (ON). Recordings were only made in the ON state in Cases 6 and 8, and only in the OFF state in Case 5. Deep‐brain activity was recorded from the adjacent four contacts of each macroelectrode (0–1, 1–2, 2–3). LFPs were filtered at 1–250 Hz and amplified (×100 000). Signals were sampled either at 500 Hz (n = 1), 625 Hz (n = 3) or 1 kHz (n = 4) and recorded and monitored on‐line. Amplification, filtering and recording was performed using the Schwartzer 34 amplifier system (Schwartzer Medical Diagnostic Equipment, Munich, Germany) and Brainlab software (OSG, Rumst, Belgium) in Amsterdam. Signals were amplified and filtered using a custom‐made, 9‐V battery‐operated portable high‐impedance amplifier [which had as its front‐end input stage the INA128 instrumentation amplifier (Texas Instruments, Dallas, TX, USA)] and recorded through a 1401 A–D converter (Cambridge Electronic Design, Cambridge, UK) onto a portable computer using Spike2 software (Cambridge Electronic Design) in London and Berlin. Recordings of scalp EEG were prevented by surgical dressings except for Cases 4 and 6. In both the latter EEG activity was recorded from Fz, Cz, C3 and C4, referenced to the ears, using silver/silver chloride electrodes.
Analysis
Trials were resampled to a common sampling rate of 625 Hz, where necessary. Event‐related potentials (ERPs) were derived by averaging the raw trials about the go/nogo signal. To analyse non‐phase‐locked responses, recorded activity was digitally passband filtered in Spike2 v4.0 using a narrow recursive (finite impulse response) bandpass filter. The resultant activity was then squared, giving a dynamic measure of frequency band power. Activity in the spectral peak in the beta band (Table 1) was selected for filtering, as this was the peak that invariably had maximum amplitude >12 Hz and was present in all subjects. The choice of this band was further justified as activity in this range displays significant coherence with widespread cortical areas and the globus pallidus internus (Brown et al., 2001; Williams et al., 2002) and with single‐unit activity in STN (Levy et al., 2002a). Figure 3 shows an example of typical spectral analysis of STN LFP (Case 6).
Raw and squared filtered activities were averaged across trials of the same warning cue laterality, aligned to the go/nogo cue onset. Data segments were averaged from a period from 2 s prior to warning cue onset to 2 s after the go/nogo cue. Trials in which the patient failed to respond to the go signal or responded incorrectly or prematurely were excluded and underwent no further analysis. Similarly, nogo trials in which responses were made were excluded from LFP analyses. Trials corrupted by movement artefact or mains spikes were withdrawn. Our primary aims were to determine the precise latency of ERPs and ERDs with respect to reaction time and the difference between the response to go and nogo cues rather than address questions of laterality or medication effect. To maximize the number of trials available for these primary analyses, we combined trials requiring contralateral and ipsilateral button presses and those recorded on and off medication. Importantly, no one state dominated these combined averages; furthermore, it has been demonstrated that beta power responses to warning cues do not demonstrate evidence of significant lateralization or ON/OFF magnitude differences (Williams et al., 2003). Across the eight subjects, 50% of records were derived from contralateral responses, 50% from ipsilateral responses, 46% from OFF drug and 54% from ON drug.
The contact pairs with the biggest ERP and highest beta power were thereafter analysed for each side in each patient. The presence and timing of any deviations in ERPs and averaged beta band power were determined by control charting and change‐point analysis, using commercial software (Change‐Point Analyser 2.0 shareware program; Taylor Enterprises, Illinois, IA, USA, http://www.variation.com) and techniques described previously (Cassidy et al., 2002). Control charts consisted of plots of serial deviations from the mean power. Control limits were determined to give the maximum range over which values were expected to vary (with 95% probability), assuming no change had occurred. Change‐point analysis iteratively uses a combination of time‐varying cumulative sum charts (cusums) and bootstrapping to detect changes and is more sensitive to change than control charting (Taylor, 2000). For this analysis, cusums were determined by plotting the sequentially summed deviation of each data point from the average determined for the whole record segment. Ten thousand bootstraps were performed in each test and only changes with probabilities of >99% were considered. Band power was averaged across groups of four to eight points (depending on sampling rate) prior to analysis, so as to avoid violation of the assumption of independent errors. Upward gradients in cusums denote a positive ERP component or an increase in power over baseline (ERS), whereas downward gradients denote a negative ERP component or a decrease in power (ERD). Stretches of zero gradient represent no change from the control period. Note that in the illustrated cusums power changes are given relative to the pre‐cue mean rather than the power averaged for the whole record. Mean latencies are given together with the standard error of the mean.
Behavioural effects were assessed by two‐way repeated measures analysis of variance (ANOVA). Separate ANOVAs were performed with two within‐subject factors: drug state (two levels: ON and OFF drugs) and side (two levels: right and left hand) for reaction time, percentage errors of commission (false button‐presses) in nogo trials and percentage combined errors of omission or side of response in go trials, but only after the values were found to be normally distributed, as confirmed by the Shapiro‐Wilks W test.
Electrophysiological differences were evaluated by two‐tailed paired t‐tests. Cross‐correlation of LFP waveforms was performed as described by Brown and colleagues (Brown et al., 2000), while frequency analysis was performed using techniques outlined by Halliday and colleagues (Halliday et al., 1995) and Brown and colleagues (Brown et al., 2000).
Results
Behavioural measurements
With respect to reaction time, there was no significant effect for drug state or interaction between drug state and side, but there was a significant effect for side [F(1,7) = 15.4, P = 0.006]. The mean reaction times were 635 ± 107 and 577 ± 93 ms for the left and right hands, showing that the dominant hand was slightly faster (all subjects were right‐handed). The mean reaction times ON and OFF medication were 600 ± 71 ms, which is similar to results reported in previous studies on choice reaction time tasks in Parkinson’s disease patients (for example, see Schubert et al., 2002; Low et al., 2002; Werheid et al., 2003). With respect to the commission error rate in nogo trials and combined omission and laterality error rate in go trials, there were no main effects or interactions. The mean commission error rate in nogo trials and mean combined error rate in go trials were 18.3 ± 5.3 and 16.6 ± 6.9% respectively. Overall, errors were too infrequent to enable separate evaluation of the pattern of beta synchronization in error trials.
Go trials
The ERP evoked by warning and go cues averaged across all eight patients is shown in Fig. 4. It was of short latency and consisted of a biphasic potential. This picture was confirmed in all individual patients. The average onset latency of the go cue‐evoked initial component of the ERP was 171 ± 16 ms. Its latency did not correlate with reaction time in individual patients. The peak‐to‐peak amplitude of the ERP following the imperative cue was 100 ± 48% bigger (P < 0.01) than that of the wave following the warning cue. Note that the interval from the warning cue to the go cue was kept fixed so that size differences did not relate to greater blurring of warning cue responses with go cue‐locked averaging.
The filtered beta power cusums averaged across all eight patients are shown in Fig. 5. The average cusum for the go trials shows an ERD (negative‐going gradient) following the warning and go cues. The group mean ERD following the go cue precedes the mean reaction time (thin vertical line in Fig. 5), and is terminated by a late ERS (positive gradient).
This general picture was confirmed in individual patients, and Fig. 6A illustrates the results in Case 2. Go cusums always began with an ERD (324 ± 59 ms), followed, except in Case 1, by a late ERS (1055 ± 127 ms). The ERD preceded the mean reaction time in every case (600 ± 71 ms, P <0.001). The percentage of individual go responses in each subject that had a longer latency than the mean ERD onset in each subject varied between 85 and 100% (mean 96.3 ± 1.9%). ERD latency, as shown in Fig. 7, was variable and positively correlated with the mean reaction time in each patient (r = 0.986, r2 = 0.973, P < 0.001). The gradient of the regression line was not unity (1.52, confidence limits 1.26 to 1.77), indicating that there was a disproportionate increase in mean reaction time with increases in ERD latency. In addition, the intercept of the regression line was significantly different from zero (120 ms, 95% confidence limits 27–213 ms).
Nogo trials
The ERP evoked by nogo stimuli averaged across all eight patients was of similar latency to the go ERP but was of briefer duration (Fig. 4). Thus the average nogo–go difference trace demonstrated a delayed wave of opposite polarity to the initial component of the go ERP, which began just before the reaction time averaged across all subjects. A similar feature could be demonstrated in all the individual patients, with the exception of Case 7. The latency of this positive wave in nogo–go difference records was 463 ± 42 ms.
The average cusum of beta power for the nogo trials showed an ERD following the warning and nogo cues (Fig. 5). The ERD (negative gradient) following the nogo cue was terminated by an ERS (positive gradient) that began around the time of the mean reaction time and was a few hundred milliseconds shorter in latency than the ERS in the average go cusum. This general picture was again representative of the results in individual patients. With the exception of Case 3, nogo cusums began with an ERD with a latency (328 ± 128 ms) that was not significantly different from that in go cusums. This was followed by an ERS at 748 ± 147 ms. In four subjects (Cases 2, 3, 7 and 8) the ERS preceded the mean reaction time in the same patient. In Case 3 this was the first change following the nogo cue. The nogo ERS began significantly earlier than the late go ERS (P < 0.05).
The comparable latency and form of the initial response following the nogo and go cues suggests that it may have been a similar, if not identical, process (Fig. 5). However, the ERD was terminated and reversed earlier in nogo cusums. In line with investigations of cortical nogo‐related activity (Gemba and Sasaki, 1989; Naito and Matsumura, 1994; Filipovic et al., 2000), we highlighted this by deriving the difference between nogo and go trials: nogo–go.
The average nogo–go cusum is shown in Fig. 5 and demonstrates a relatively short‐latency increase in synchronization. This general picture was confirmed in all individual patients except one (Case 8): i.e. the predominant difference was that the magnitude of the go ERD was significantly greater than the nogo response (see Fig. 6B, for example). The mean latency of this difference across individual patients was 355 ± 68 ms, which was shorter than the overall reaction time in go trials (600 ± 71 ms, P <0.05). With the exception of Cases 5 and 6, the mean onset latency of the difference in nogo–go cusums in each subject was shorter than the reaction time in 95–100% of the individual go responses in the same subject (mean 97.7 ± 1.0%). Errors of commission were no more frequent in Cases 5 and 6 than in the remaining subjects. The net increase in nogo–go cusums was of much shorter latency than the late ERS in go cusums (P < 0.01). The latency of the nogo–go increase did not correlate with that of the ERD in go trials.
Origin of LFP recordings
The question arises of the extent to which the signals recorded from DBS electrodes were due to locally generated activity (Dinner et al., 2002) or the product of volume conduction of synchronous cortical activity (Wennberg and Lozano, 2003). In the latter case, one would expect that LFP power and ERP amplitudes would be either equally distributed between the contact pairs of the DBS electrode or show a decrement at contacts more distant from the cortical source. We found, however, a well‐defined maximum of beta power at one of the contact pairs of the DBS electrode in all patients (16 DBS electrodes), which was arbitrarily distributed (4× at STN 01; 4× at STN 12; 8× at STN 23; Fig. 8). The mean gradient of beta power at the remaining contact pairs was 59.2 ± 4.3%. Similarly, the maximum peak‐to‐peak amplitude of the ERPs was randomly distributed between the contacts (Fig. 8; mean gradient of ERP amplitude at the remaining contact pairs 61.2 ± 4.9%).
Conversely, polarity reversal of signals across the contacts of a macroelectrode is good evidence of a local source. The correlation of LFP waveforms between contact pairs revealed a phase reversal in nine out of 16 sides. Similarly, polarity reversal of the ERP was evident in seven sides (Fig. 9). We were unable to elicit ERPs in three of the remaining sides. Note that the same contact pair exhibited maximal beta power and ERP amplitude in seven out of the 13 DBS electrodes (56%) where this comparison was possible.
Further evidence of a local origin for the recorded features came from frequency analysis in Cases 4 and 6, in whom EEG was recorded. Coherence was elevated in the alpha and beta bands between the LFP from the contact pair with maximum beta power and the EEG over motor cortical areas bilaterally (Fig. 10). The temporal delay between the EEG and LFP signals was calculated from the phase spectra and, on the four available sides, EEG led STN LFP by 23.3 ms ± 6.5 (range 17.3–30.2 ms).
Discussion
The major findings of the current investigation were twofold. First, externally paced movements are preceded by an ERD in the beta band, the latency of which is strongly correlated with mean reaction time, suggesting that it may be related to motor programming. This was most strikingly true of two patients with particularly long reaction times, in whom the ERD was also of long latency but nevertheless preceded the motor response. Secondly, the response to stimuli instructing the inhibition of pre‐cued movement begins with a stereotypical ERD in the beta band that is reduced prior to movement and finally reversed into an ERS. This provides further evidence that desynchronization in the beta band is a feature of movement preparation in STN, as it is reduced when movement is inhibited.
Experimental limitations
Before considering our findings in greater detail we should stress some of the limitations of our experimental approach. Studies in patients are our only opportunity to record directly from the basal ganglia in humans, but by their nature have several major limitations. First, recording techniques are correlational in approach and indicate that a brain area is likely to be involved in a task, but not necessarily essential for that task. Nevertheless, an important role for STN in response preparation is supported by the prolongation of reaction time following bilateral STN lesions (Baunez et al., 2001). Secondly, there is no certainty that findings are physiological or pathological exaggerations of physiological activity rather than primarily related to the pathophysiology of Parkinson’s disease. In the case of the beta activity in the basal ganglia, it seems highly likely that this is increased in parkinsonism (Nini et al., 1995; Levy et al., 2000), although a study in an epileptic patient suggested that it may also be present in non‐parkinsonian subjects and show reactivity with movement similar to that in Parkinson’s disease (Sochurkova and Rektor, 2003). In addition, it should be noted that the comparative nature of the present study, assessing the degree of change in both go and nogo conditions, should reduce the effect of any additive pathological component. Thirdly, without histological verification of electrode site, placement in STN should be considered presumptive, even though surgical coordinates, clinical efficacy and postoperative imaging were consistent with placement of one or more DBS electrode contacts in the STN. Finally, recording time is limited in patients, even when recordings are made postoperatively from DBS electrodes. Given this, we opted to increase our signal‐to‐noise ratio and hence the certainty of our findings by averaging across sides and drug states. Nevertheless, this did not allow us to assess the effects of dopaminergic treatment or laterality on beta modulations.
The features identified in signals picked up from the STN macroelectrode were likely to be the product of local activity rather than due to the volume conduction of synchronous cortical activity. Unlike Wennberg and Lozano (2003), we used bipolar recordings from the contacts of our DBS electrodes, thereby avoiding a common scalp reference that may have contaminated depth signals with cortical EEG. Recordings from adjacent macroelectrode contact pairs showed clear gradients and, in many cases, polarity reversals, suggestive of a focal origin. Furthermore, in agreement with previous studies (Marsden et al., 2001; Williams et al., 2002), EEG phase‐led the STN‐LFP signal by ∼20 ms; this suggests that the cortex drives the STN‐LFP, and is incompatible with volume conduction of cortical activity.
Implications regarding motor control
Both the ERP and spectral power revealed consistent differences between go and nogo trials in single subjects but the ERP was of relatively fixed and short latency and did not correlate with reaction time. This suggests that the initial phase‐locked activity evoked by the imperative cue is less directly related to movement programming than the ERD, reflecting instead processes more closely related to afferent input. However, the ERP was still conditioned by the behavioural context in so far as the preceding, but otherwise identical, non‐imperative (warning) cue signal elicited an ERP of similar form but much lower amplitude. Thus, the ERP recorded in STN is not a simple visually evoked potential picked up through volume conduction. Indeed, visually evoked potentials picked up from the optic tract by depth electrodes during pallidotomy have an initial positive deflection latency that is around 120 ms shorter than the STN ERP (Tobimatsu et al., 1997). Instead, it seems likely that the STN ERP represents some degree of processing of the visual cue signal, perhaps related to the evaluation of the behavioural value of the cue or to cue‐induced attentional changes.
Nevertheless, it seems likely that the STN not only receives information regarding behaviourally relevant cues but also has the capacity to be involved in the motor programming prior to voluntary movements that are externally paced. This is suggested by the report of a conditioned negative wave prior to externally paced movements (Bares and Rektor, 2001) and by our finding of an ERD preceding movement and strongly correlated with reaction time. That motor programming is associated with a reduction in the degree of synchronization in the beta band within STN is in accord with the hypothesis that this activity may be considered antikinetic in nature (Brown, 2003). A relationship between beta band desynchronization and motor programming is also consistent with the dependency of the ERD in STN following warning cues upon the predictive value of the respective cue. In the case of unreliable warning cues, there is less possibility of preprogramming the movement prior to the imperative cue, the ERD is reduced and reaction time is prolonged (Williams et al., 2003).
It is interesting to note that the ERD in STN, albeit in parkinsonian patients, preceded the externally cued hand movement by several hundred milliseconds, whereas in single‐neuron recordings from monkey STN the median onset of firing rate changes has been generally estimated to occur around the time of the movement (Wichmann et al., 1994) or only 50 ms earlier (Georgopoulos et al., 1983), leading to the suggestion that the STN is not involved in the programming of movement before it occurs (DeLong et al., 1984; Wichmann et al., 1994). The disparity between the ERD and single‐neuron results could be species‐, disease‐ or paradigm‐dependent, but it should also be stressed that behaviourally related changes in synchronization may occur independently of changes in mean firing rate (König et al., 1996; Riehle et al., 1997).
The ERD following the imperative cue was variable in latency. It has been argued that motor organization time may be relatively preserved in Parkinson’s disease patients performing go/nogo tasks but that decision‐related processes may be prolonged (Tachibana et al., 1997). If we take the onset of the ERD as a marker of the onset of motor organization, the long and variable ERD latencies in the present study support the notion that decision‐related processes (which may not necessarily involve STN) may be prolonged in Parkinson’s disease. This assumes that afferent activity, modulated according to behavioural context, is not delayed, which is a reasonable assumption given the short and relatively consistent latency of the STN ERP following imperative cues. Nevertheless, the interval between ERD onset and reaction time was not fixed, longer ERD latencies being associated with disproportionate increases in reaction time. This raises the possibility of either a lengthening of the motor organization time and/or of movement time, with longer ERD latencies. The non‐zero intercept in the regression line linking ERD onset to reaction time affords an estimate of the minimum delay of motor programming and movement time: that is to say that even if ERD were to start immediately after the imperative cue, reaction time would still be around 120 ms.
Relationship to cortical activity
Although we were unable to simultaneously record EEG in most of our patients, cortical activities of comparable timing have been identified following imperative go cues in healthy subjects. Cortical ERPs may be recorded over frontal motor areas as well as more posteriorly, overlapping in latency with the STN ERP, and similarly modulated by the behavioural relevance of the cue (Mangun and Hillyard, 1991; Eimer, 1993; Thut et al., 2000). Transcutaneous magnetic stimulation over the premotor area at the same latency is able to delay reaction time following a visual cue (Schluter et al., 1999). Thus, both motor cortical areas and basal ganglia may be simultaneously activated by behaviourally relevant cues.
In addition, a beta band ERD occurs in healthy subjects over motor cortical areas with similar mean latency to the STN ERD recorded here (Klopp et al., 2001). This argues that the ERD may be a network phenomenon affecting cortico‐basal ganglia‐cortical loops during movement programming. On the other hand, the beta band ERS reported in the EEG over midline motor cortical areas occurs around 230 ms after nogo cues in healthy subjects (Shibata et al., 1999) and clearly precedes the nogo‐related ERS recorded in the STN of our parkinsonian subjects. Equally, nogo‐specific negative ERPs recorded over Cz begin at around 135 and 200 ms in healthy subjects (Gemba and Sasaki, 1989; Naito and Matsumura, 1994; Filipovic et al., 2000), 200–300 ms earlier than the latency of the negative ERP in nogo–go difference records from STN. Although we cannot at present discount the possibility that the nogo‐related cortical ERS and ERPs are delayed in Parkinson’s disease, it is interesting to note that two of our patients (Cases 5 and 6) had reaction times that were shorter than the onset latency of motor inhibitory‐related activity changes in STN, implying that alternative processes of shorter latency, and perhaps therefore cortical in origin, were sufficient to abort movement in these two patients. Alternatively, the apparently prolonged latency of motor inhibitory‐related activity relative to reaction time may have been a consequence of poor signal‐to‐noise ratio coupled with the conservative use of 99% confidence limits for cusums.
Conclusion
The reduction in the degree of synchronization of activity in the beta band occurring prior to movement strongly correlated with mean reaction time points to the involvement of the STN in the preparation of externally paced, as well as self‐paced, voluntary movement. At the same time, the degree of synchronization of STN activity in the beta band is emerging as an important determinant of whether or not motor programming and movement initiation are favoured or suppressed. Here and elsewhere (Williams et al., 2003), we have provided evidence that oscillatory synchronization in the STN is modulated according to context and task demands. This raises the important question of whether elevated background levels of synchronization in the beta band in parkinsonism (Nini et al., 1995; Silberstein et al., 2003) antagonize movement and contribute to bradykinesia (Brown, 2003).
Acknowledgements
We wish to thank Andries Bosch, Marina Tijssen, Gerard van Bruggen and Hans Speelman for their help in studying Case 7. We also thank Pascal Grosse for his help in recording Case 8 and Thomas Trottenberg for assistance with patients from Berlin. P.B., D.W. and K.Y. are supported by the Medical Research Council of Great Britain and A.K. by a fellowship from the German Academic Exchange Service (DAAD).
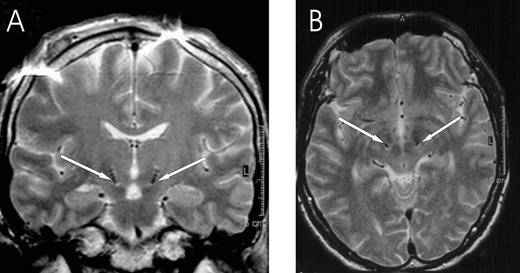
Fig. 1 Localization of DBS electrodes at the level of contact pair 12 in the postoperative MRI of Case 4 (A coronal, B axial MRI section; artefact in A at cortical level). Both are symmetrically placed within STN. Arrows point to the DBS electrode artefacts.
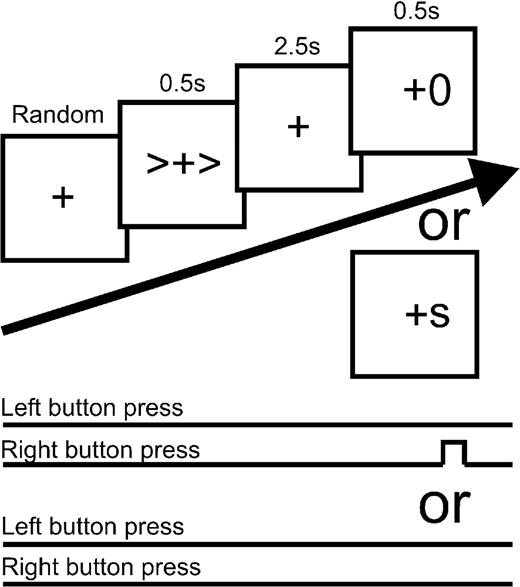
Fig. 2 Schema of the experimental paradigm. Warning cues and imperative go signals could point right or left and cue–go congruity was kept at 100%. The frequency of stop cues was 20%.
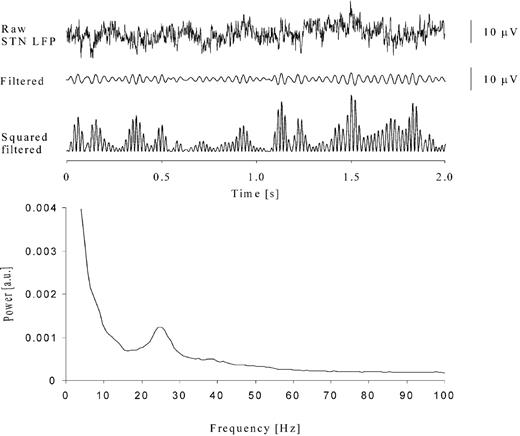
Fig. 3 Example of raw data, bandpass‐filtered (19–34Hz) and squared activity recorded from left STN at contact pair 23 in Case 6. The power spectrum shows a clear peak at ∼25 Hz. a.u. = arbitrary units.
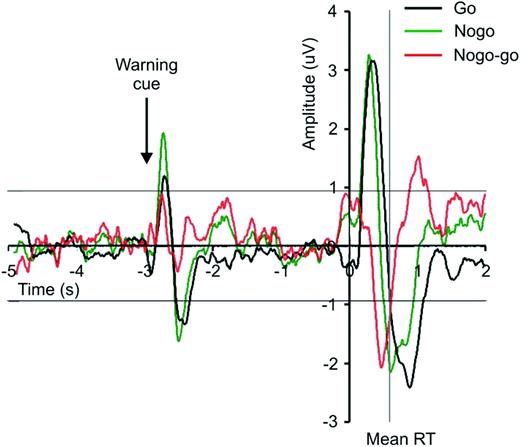
Fig. 4 Grand average (n = 8 subjects) of the go and nogo ERPs and their difference. The thin horizontal lines are the 99% confidence limits for the ERPs calculated from the period 5 to 3 s prior to the imperative cue at t = 0 s. RT = reaction time.
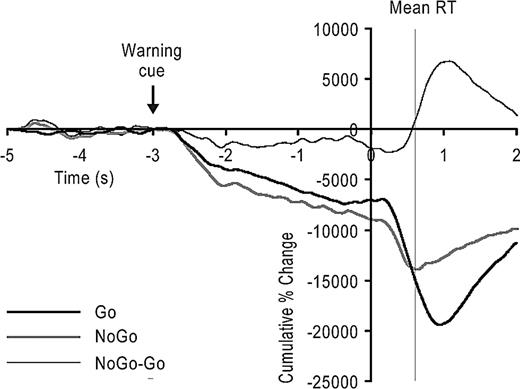
Fig. 5 Grand average (n = 8 subjects) of the normalized cusums showing the cumulative deviations of average squared‐filtered differential signals, expressed as a percentage of the baseline mean taken from 5 to 3 s prior to the go/nogo cue delivered at time zero. Upward gradients in cusums denote an increase in power (event‐related synchronization, ERS), whereas downward gradients denote a decrease in power (event‐related desynchronization, ERD) relative to baseline. Note that the go and nogo cusums have ERDs following both the warning and go/nogo cues, but that the second negative deflection in the nogo average is terminated by an early ERS. The difference between the grand average go and nogo cusums is also shown. This indicates that the only difference between the two was a net increase in power beginning before the mean reaction time (RT).
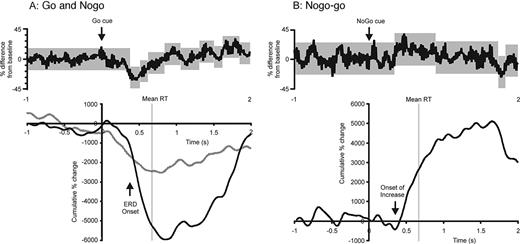
Fig. 6 Control charts and cusums of (A) go (and nogo in grey) and (B) nogo–go difference in Case 2. Grey in control charts (upper graphs) are 95% confidence limits of background prior to cue and of successive periods of change identified thereafter using change‐point analysis. Note that an event‐related desynchronization (ERD) and a net increase are represented in the go and nogo–go cusums, respectively, and that both start before the mean reaction time (RT).
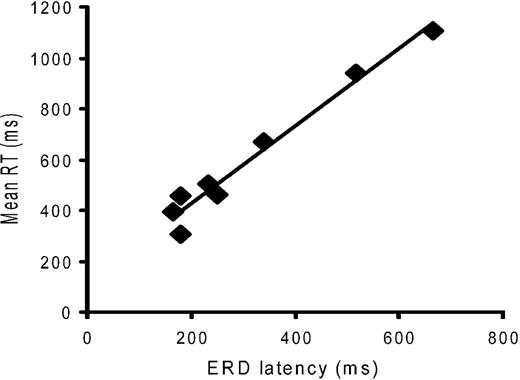
Fig. 7 Correlation between latency of onset of the go cue‐related desynchronization (ERD) and mean reaction time (RT) across the eight patients. Note the highly significant estimated correlation (r = 0.986, P < 0.001).
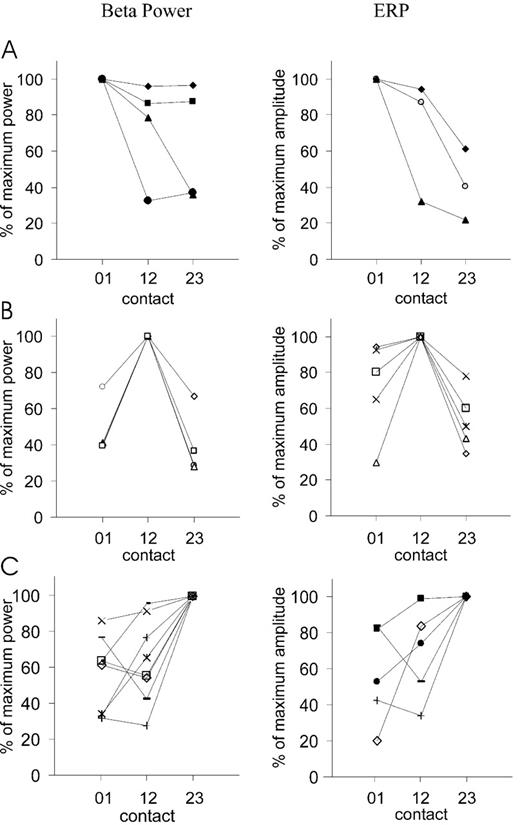
Fig. 8 Distribution of beta power (left column) and ERP amplitudes (right column) among the three contact pairs of the DBS electrode (STN 01 was the most caudal and STN 23 was the most rostral contact pair) expressed as percentage of individual maximum beta power and individual maximum amplitude, respectively. (A) DBS electrode sites with a maximum beta power/ERP amplitude at contact pair STN 01. (B) Maximum power/ERP amplitude at contact pair STN 12. (C) Maximum power/ERP amplitude at contact pair STN 23. Each symbol represents data from one DBS electrode. Note that no ERP was recorded at three DBS electrodes.
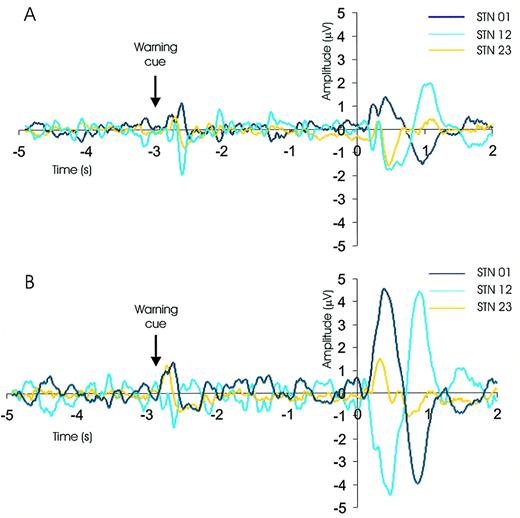
Fig. 9 Example of go ERPs in one representative subject (Case 2) recorded from the three contact pairs of the right (A) and left (B) DBS electrode (STN 01 was the most caudal and STN 23 was the most rostral contact pair). Raw activity was averaged across trials of the same warning cue laterality and aligned to the go cue onset at t = 0 s. ERP polarity reversal is present at contact 1 on both sides, with highest peak‐to‐peak amplitude of the ERP at STN 12.
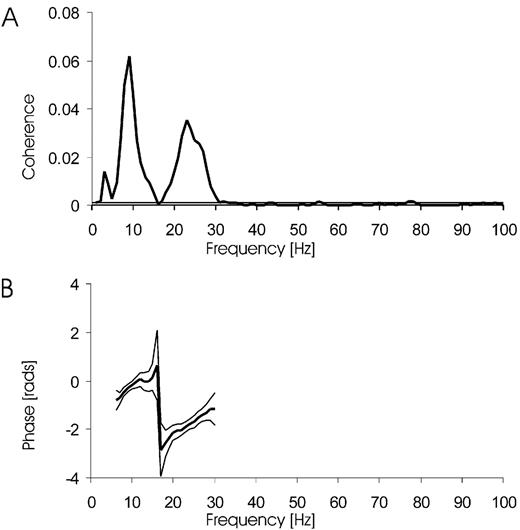
Fig. 10 Inter‐relationship between EEG recorded over the MOTOR cortical area and STN‐LFP in one subject (Case 6) taken during performance of the go/nogo task. (A) Coherence spectrum between C3 (referenced to left ear) and left STN23 LFP. (B) Phase relationship between EEG and LFP. Cortex leads STN‐LFP by 18 ms. The horizontal lines in the coherence spectrum and the thin lines in the phase spectrum are the 95% confidence limits.
Summary of patient details (all had bilateral STN implantation)
| Case | Age(years),sex | Diseaseduration(years) | Diagnosis and predominantsymptoms | Surgicalcentre | Motor UPDRSon/off drugspre‐op | Motor UPDRSon/off DBSpostop | Medication(daily dose) | Power bandused (Hz) |
| 1 | 69, M | 13 | PD, on–off fluctuations andfreezing | Berlin | 31/59 | 24/33 | Levodopa 900 mg,entacapone 800 mg,ropinirole 21 mg | R STN 15–21HzL STN15–21Hz |
| 2 | 71, F | 10 | PD, on–off fluctuations anddyskinesias | Berlin | 26/42 | 29/46 | Levodopa 850 mg,sotalol 80 mg | R STN 16–30HzL STN 14–24Hz |
| 3 | 62, F | 10 | PD, on–off fluctuations and | Berlin | 16/48 | 37/50 | Levodopa 675 mg, | R STN 20–30Hz |
| dyskinesias | entacapone 1400 mg, | L STN 22–34Hz | ||||||
| cabergoline 4 mg | ||||||||
| 4 | 50, M | 11 | PD, on–off fluctuations and | Berlin | 24/36 | 16/30 | Levodopa 500 mg, | R STN 11–28Hz |
| dyskinesias | amantadine 300 mg, | L STN 11–26Hz | ||||||
| ropinirole 20 mg, | ||||||||
| entacapone 1400 mg, | ||||||||
| amitriptyline 25 mg | ||||||||
| 5 | 58, M | 16 | PD, on–off fluctuations, | London | 15/61 | 16/54 | Levodopa 550 mg, | R STN 21–29Hz |
| off‐periods | cabergoline 3 mg | L STN 21–29Hz | ||||||
| 6 | 70, M | 22 | PD, on–off fluctuations and | Berlin | 13/58 | 14/35 | Levodopa 1500 mg, | R STN 20–30Hz |
| dyskinesias | entacapone 1400 mg | L STN 19–34Hz | ||||||
| 7 | 56, F | 13 | PD, on–off fluctuations and | Amsterdam | 6/28 | N/A | Levodopa 500 mg, | R STN 21–30Hz |
| freezing | selegiline 10 mg, | L STN 13–31Hz | ||||||
| amantadine 100 mg | ||||||||
| 8 | 58, F | 10 | PD, on–off fluctuations and | Berlin | 27/52 | N/A | Levodopa 600 mg, | R STN 12–32Hz |
| freezing | quetiapine 25 mg, | L STN 11–35Hz | ||||||
| tetrazepam 25 mg, | ||||||||
| diazepam 0.5 mg |
All patients were right‐handed. PD = Parkinson’s disease.
References
Baker SN, Olivier E, Lemon RN. Coherent oscillations in monkey motor cortex and hand muscle EMG show task‐dependent modulation.
Bares M, Rektor I. Basal ganglia involvement in sensory and cognitive processing. A depth electrode CNV study in human subjects.
Baunez C, Humby T, Eagle DM, Ryan LJ, Dunnett SB, Robbins TW. Effects of STN lesions on simple vs choice reaction time tasks in the rat: preserved motor readiness, but impaired response selection.
Brown P. Cortical drives to human muscle: the Piper and related rhythms.
Brown P. Oscillatory nature of human basal ganglia activity: relationship to the pathophysiology of Parkinson’s disease.
Brown P, Day BL. Eye acceleration during large horizontal saccades in man.
Brown P, Oliviero A, Mazzone P, Insola A, Tonali P, Di Lazzaro V. Dopamine dependency of oscillations between subthalamic nucleus and pallidum in Parkinson’s disease.
Cassidy M, Mazzone P, Oliviero A, Insola A, Tonali P, Di Lazzaro V, et al. Movement‐related changes in synchronization in the human basal ganglia.
Cheruel F, Dormont JF, Amalric M, Schmied A, Farin D. The role of putamen and pallidum in motor initiation in the cat. I. Timing of movement‐related single‐unit activity.
Cheruel F, Dormont JF, Farin D. Activity of neurons of the subthalamic nucleus in relation to motor performance in the cat.
Creutzfeldt O, Watanabe S, Lux H. Relations between EEG phenomena and potentials of single cortical cells. I. Evoked responses after thalamic and epicortical stimulation.
Curra A, Berardelli A, Agostino R, Modugno N, Puorger CC, Accornero N, et al. Performance of sequential arm movements with and without advance knowledge of motor pathways in Parkinson’s disease.
DeLong MR, Alexander GE, Georgopoulos AP, Crutcher MD, Mitchell SJ, Richardson RT. Role of basal ganglia in limb movements.
Dinner DS, Neme S, Nair D, Montgomery EB, Baker KB, Rezai A, et al. EEG and evoked potential recording from the subthalamic nucleus for deep brain stimulation of intractable epilepsy.
Donoghue JP, Sanes JN, Hatsopoulos NG, Gaal G. Neural discharge and local field potential oscillations in primate motor cortex during voluntary movements.
Eimer M. Spatial cueing, sensory gating and selective response preparation: an ERP study on visuo‐spatial orienting.
Filipovic SR, Jahanshahi M, Rothwell JC. Cortical potentials related to the nogo decision.
Frison L, Pocock SJ. Repeated measures in clinical trials: an analysis using mean summary statistics and its implications for design.
Frost JD Jr. EEG‐intracellular potential relationships in isolated cerebral cortex.
Gemba H, Sasaki K. Potential related to no‐go reaction of go/no‐go hand movement task with color discrimination in human.
Georgiou N, Iansek R, Bradshaw JL, Phillips JG, Mattingley JB, Bradshaw JA. An evaluation of the role of internal cues in the pathogenesis of parkinsonian hypokinesia.
Georgiou N, Bradshaw JL, Iansek R, Phillips JG, Mattingley JB, Bradshaw JA. Reduction in external cues and movement sequencing in Parkinson’s disease.
Georgopoulos AP, DeLong MR, Crutcher MD. Relations between parameters of step‐tracking movements and single cell discharge in the globus pallidus and subthalamic nucleus of the behaving monkey.
Goto Y, O’Donnell P. Network synchrony in the nucleus accumbens in vivo.
Halliday DM, Rosenberg JR, Amjad AM, Breeze P, Conway BA, Farmer SF. A framework for the analysis of mixed time series/point process data—theory and application to the study of physiological tremor, single motor unit discharges and electromyograms.
Jaeger D, Gilman S, Aldridge JW. Neuronal activity in the striatum and pallidum of primates related to the execution of externally cued reaching movements.
Kimura M. Behaviorally contingent property of movement‐related activity of the primate putamen.
Klopp J, Marinkovic K, Clarke J, Chauvel P, Nenov V, Halgren E. Timing and localization of movement‐related spectral changes in the human peri‐Rolandic cortex: intracranial recordings.
König P, Engel AK, Singer W. Integrator or coincidence detector? The role of the cortical neuron revisited.
Levy R, Hutchison WD, Lozano AM, Dostrovsky JO. High‐frequency synchronization of neuronal activity in the subthalamic nucleus of parkinsonian patients with limb tremor.
Levy R, Ashby P, Hutchison WD, Lang AE, Lozano AM, Dostrovsky JO. Dependence of subthalamic nucleus oscillations on movement and dopamine in Parkinson’s disease.
Levy R, Hutchison WD, Lozano AM, Dostrovsky JO. Synchronized neuronal discharge in the basal ganglia of parkinsonian patients is limited to oscillatory activity.
Limousin P, Pollak P, Benazzouz A, Hoffmann D, Le Bas JF, Broussolle E, et al. Effect of parkinsonian signs and symptoms of bilateral subthalamic nucleus stimulation.
Low KA, Miller J, Vierck E. Response slowing in Parkinson’s disease: a psychophysiological analysis of premotor and motor processes.
Mangun GR, Hillyard SA. Modulations of sensory‐evoked brain potentials indicate changes in perceptual processing during visual‐spatial priming.
Marsden JF, Limousin‐Dowsey P, Ashby P, Pollak P, Brown P. Subthalamic nucleus, sensorimotor cortex and muscle interrelationships in Parkinson’s disease.
Morris M, Iansek R. Characteristics of motor disturbance in Parkinson’s disease and strategies for movement rehabilitation.
Murthy VN, Fetz EE. Coherent 25‐ to 35‐Hz oscillations in the sensorimotor cortex of awake behaving monkeys.
Naito E, Matsumura M. Movement‐related potentials associated with motor inhibition as determined by use of a stop signal paradigm in humans.
Neafsey EJ, Hull CD, Buchwald NA. Preparation for movement in the cat. II. Unit activity in the basal ganglia and thalamus.
Nini A, Feingold A, Slovin H, Bergman H.
Priori A, Foffani G, Pesenti A, Bianchi A, Chiesa V, Baselli G, et al. Movement‐related modulation of neural activity in human basal ganglia and its L‐DOPA dependency: recordings from deep brain stimulation electrodes in patients with Parkinson’s disease.
Rektor I. Scalp‐recorded Bereitschaftspotential is the result of the activity of cortical and subcortical generators—a hypothesis.
Rektor I, Bares M, Kubova D. Movement‐related potentials in the basal ganglia: a SEEG readiness potential study.
Riehle A, Grun S, Diesmann M, Aertsen A. Spike synchronization and rate modulation differentially involved in motor cortical function.
Sanes JN, Donoghue JP. Oscillations in local field potentials of the primate motor cortex during voluntary movement.
Schluter ND, Rushworth MF, Mills KR, Passingham RE. Signal‐, set‐, and movement‐related activity in the human premotor cortex.
Schubert T, Volkmann J, Muller U, Sturm V, Voges J, Freund HJ, et al. Effects of pallidal deep brain stimulation and levodopa treatment on reaction‐time performance in Parkinson’s disease.
Schultz W, Romo R. Role of primate basal ganglia and frontal cortex in the internal generation of movements. I. Preparatory activity in the anterior striatum.
Shibata T, Shimoyama I, Ito T, Abla D, Iwasa H, Koseki K, et al. Event‐related dynamics of the gamma‐band oscillation in the human brain: information processing during a GO/NOGO hand movement task.
Silberstein P, Kühn AA, Kupsch A, Trottenberg T, Krauss J, Wöhrle JC, et al. Patterning of globus pallidus local field potentials differs between Parkinson’s disease and dystonia.
Sochurkova D, Rektor I. Event‐related desynchronization/synchronization in the putamen. An SEEG case study.
Starr PA, Vitek JL, Bakay RA. Ablative surgery and deep brain stimulation for Parkinson’s disease.
Tachibana H, Aragane K, Miyata Y, Sugita M. Electrophysiological analysis of cognitive slowing in Parkinson’s disease.
Taylor WA. Change‐point analysis: a powerful new tool for detecting changes.
Thut G, Hauert C, Viviani P, Morand S, Spinelli L, Blanke O, et al. Internally driven vs. externally cued movement selection: a study on the timing of brain activity.
Tobimatsu S, Shima F, Ishido K, Kato M. Visual evoked potentials in the vicinity of the optic tract during stereotactic pallidotomy.
Tsubokawa T, Sutin J. Pallidal and tegmental inhibition of oscillatory slow waves and unit activity in the subthalamic nucleus.
Wennberg RA, Lozano AM. Intracranial volume conduction of cortical spikes and sleep potentials recorded with deep brain stimulating electrodes.
Werheid K, Zysset S, Muller A, Reuter M, von Cramon DY. Rule learning in a serial reaction time task: an fMRI study on patients with early Parkinson’s disease.
Wichmann T, Bergman H, DeLong MR. The primate subthalamic nucleus. I. Functional properties in intact animals.
Williams D, Tijssen M, Van Bruggen G, Bosch A, Insola A, Di Lazzaro V, et al. Dopamine‐dependent changes in the functional connectivity between basal ganglia and cerebral cortex in humans.

