

Article Figures & Data
Figures
- Figure 1.
Elevated intraocular pressure and deficits in anterograde transport to the dLGN. A, Intraocular pressure (IOP) measurements from DBA/2J-gpnmb+ (D2-control) mice (n = 110 eyes from 55 mice included in this study). B, IOP measurements from DBA/2J (D2) mice (n = 168 eyes from 84 mice). C, Mean (±SEM) IOP measurements from D2 and D2-control eyes. Unpaired t tests: 2 months (m) t(147) = 2.942, p = 0.0038; 3m t(205) = 1.539, p = 0.13; 4m t(183) = 0.275, p = 0.78; 5m t(203) = 6.883, p = 1.0 × 10⁻¹⁰; 6m t(163) = 8.992, p = 2.3 × 10⁻¹⁴; 7m t(143) = 1.47, p = 0.14; 8m t(155) = 6.144, p = 6.6 × 10⁻⁹; 9m t(119) = 7.29, p = 4.0 × 10⁻¹¹; 10m t(81) = 6.881, p = 1.3 × 10⁻⁹; 11m t(69) = 4.63, p = 2.5 × 10⁻⁵. D, Fluorescently-tagged cholera toxin-B (CTb) was injected unilaterally in to the vitreous and the area of labeled contralateral dLGN was measured based on fluorescence signal in serial dLGN sections. E, Group data (mean ± SEM) showing fraction of CTb-labeled dLGN. There was a significant difference among groups (one-way ANOVA, F(3,28) = 15.0, p = 5.2 × 10⁻⁶) and the 9m group significantly differed from the control group (Dunnett’s multiple comparison test; p < 1 × 10⁻¹⁵). F, For the D2 mice, there was a significant negative correlation (linear regression with 95% confidence interval) of the fraction of dLGN labeled by CTb with the IOP integral (Pearson correlation, F(1,16) = 15.22, p = 0.0013). Sample size: Control n = 14 (controls by age: 4m n = 4, 6m n = 6, 9m n = 4); 4m D2 N = 5; 6m D2 n = 6; 9m D2 n = 7. **p < 0.005; ****p < 0.00005.
- Figure 2.
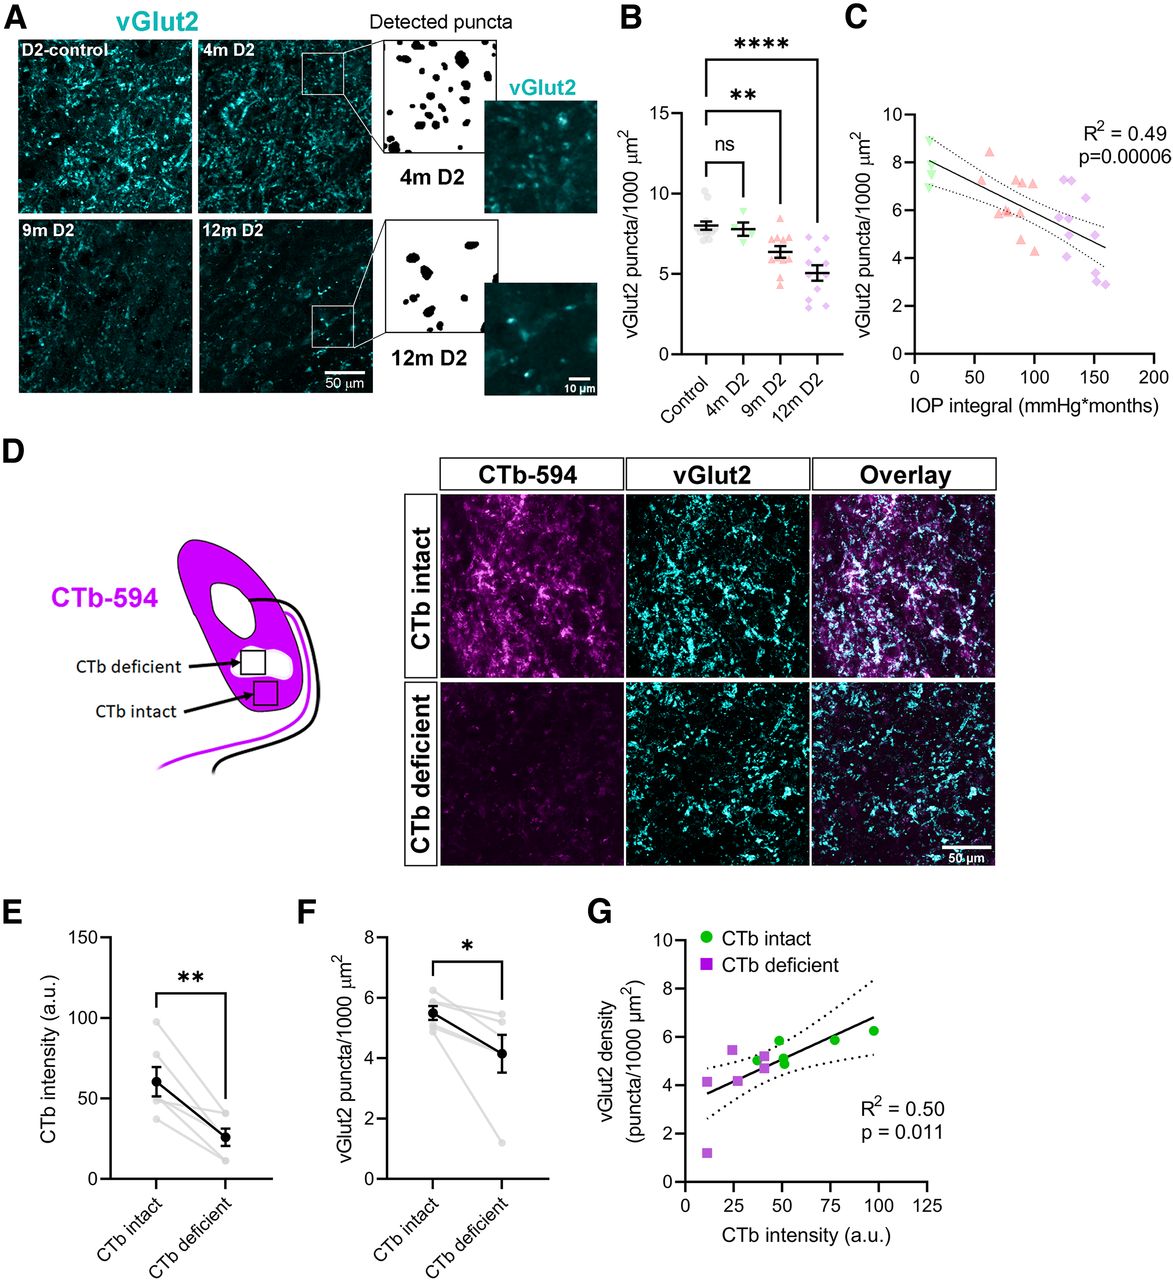
Loss of vGlut2-labeled RGC axon terminals in the dLGN is associated with transport deficits in DBA/2J mice. A, Single optical sections of dLGN labeled with an anti-vGlut2 antibody from a D2-control mouse and D2 mice at 4 months (m), 9m, and 12m of age. Zoomed-in images with detected puncta from the 4m and 12m D2 images are shown to the right. B, Group data (mean ± SEM) showing density of detected vGlut2 puncta. There was a significant difference among groups (one-way ANOVA, F(3,35) = 12.87; p = 8.0 × 10⁻⁶) with 9m and 12m groups differing significantly from the control group (Dunnett’s multiple comparison: 4m p = 0.98; 9m p = 0.0070; 12m p < 1 × 10⁻¹⁵). C, vGlut2 density was significantly correlated with IOP integral (F(1,24) = 23.11; p = 0.000068). D, Analysis of vGlut2 density in regions of the dLGN with intact or deficient anterograde transport of unilaterally-injected CTb. D2-control mice total n = 13 (D2-control by age: 4m n = 6; 9m n = 5; 12m n = 2); 4m D2 n = 4; 9m D2 n = 11; 12m D2 n = 11. E, Quantification (mean ± SEM) of CTb pixel intensity in “intact” or “deficient” dLGN regions (t(5) = 4.489, p = 0.0065, paired t test). F, Quantification of vGlut2 density (mean ± SEM) in dLGN regions with intact or deficient CTb labeling (t(5) = 2.743, p = 0.041, paired t test, n = 6 D2 mice). G, Significant positive correlation (linear regression with 95% confidence interval) of vGlut2 density with intensity of CTb labeling (Pearson correlation, F(1,10) = 9.812, p = 0.011). *p < 0.05; **p < 0.01; ****p < 0.00005.
- Figure 3.
Progressive loss of miniature EPSCs recorded from dLGN thalamocortical relay neurons in DBA/2J mice. A, Recording schematic of optic tract (OT), ventral lateral geniculate nucleus (vLGN), and dLGN with patch clamp electrode in parasagittal slice. B, Left, Example 5-s duration traces of spontaneous quantal EPSCs (sEPSCs) recorded in the without stimulation from D2-control and D2 mice. Right, Average of the detected sEPSC waveforms. C, Group data (median ± IQR) of sEPSC frequency. There was a significant difference among groups (nested one-way ANOVA, F(3,33) = 6.038, p = 0.0021) and 9-month and 12-month groups differed significantly from control (Dunnett’s multiple comparison: 6m p = 0.99; 9m p = 0.026; 12m p = 0.0078). D, There was a weak but significant correlation of Log10(sEPSC frequency) measured in TC neurons from D2 mice with the IOP integral (F(1,79) = 17.2; p = 0.000084). E, Group data (median ± IQR) of sEPSC amplitude. There was no significant difference among groups (nested one-way ANOVA, F(3,34) = 1.696, p = 0.19) and individual groups were not significantly different from the control (Dunnett’s multiple comparison, 6m p = 0.24; 9m p = 0.29; 12m p = 0.21). Group sizes: D2 control total n = 48 cells, 13 mice (D2-control by age: 6m n = 11 cells, 3 mice; 9m n = 27 cells, 8 mice; 12m n = 10 cells, 2 mice). 6m D2 n = 28 cells, 7 mice; 9m D2 n = 20 cells, 8 mice; 12m D2 n = 33 cells, 10 mice. F, Group data (mean ± SEM) of sEPSC amplitude and frequency recorded before and after bath application of 500 nm tetrodotoxin (TTX; n = 4 TC neuron recordings). TTX did not have a significant effect on either amplitude (t(3) = 2.020, p = 0.137, paired t test) or frequency (t(3) = 0.014, p = 0.99, paired t test). *p < 0.05; **p < 0.01; ns p > 0.05.
- Figure 4.
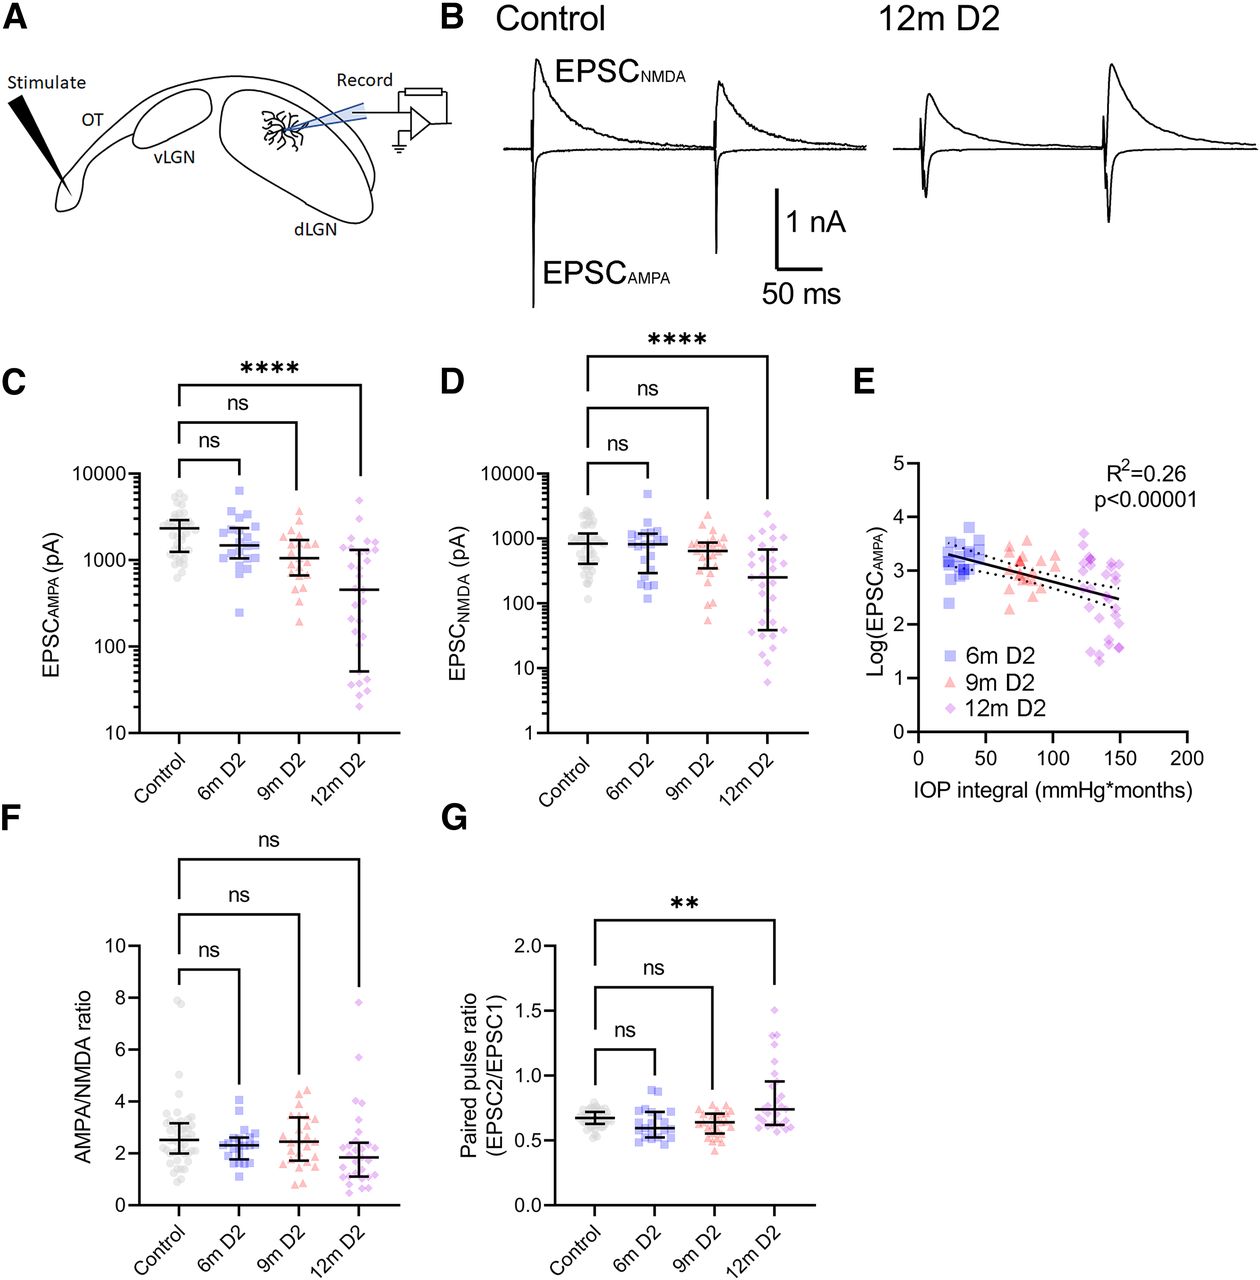
Retinogeniculate inputs to TC neurons in D2 mice. A, Recording schematic of optic tract (OT) with stimulating electrode, ventral lateral geniculate nucleus (vLGN), and dLGN with patch clamp electrode in parasagittal slice. B, Example maximal AMPA-receptor-mediated and NMDA-receptor-mediated EPSCs recorded at −70 and +40 mV, respectively, following maximal stimulation of the optic tract with a pair of pulses (200-ms interstimulus interval). C, Group data of the AMPA-receptor-mediated maximal EPSC (EPSCAMPA) show that the EPSC differed among the groups (nested one-way ANOVA, F(3,36) = 11.23, p = 2.4 × 10⁻⁵). The EPSCAMPA was significantly smaller in amplitude in recordings from 12m D2 mice compared with controls (Dunnett’s multiple comparison test: 6m p = 0.77; 9m p = 0.16; 12m p < 1 × 10⁻¹⁵). D, The NMDA-receptor-mediated EPSC differed among groups (nested one-way ANOVA, F(3,38) = 10.51, p = 3.6 × 10⁻⁵) and the 12m amplitudes were significantly lower than control (Dunnett’s multiple comparison: 6m p = 0.97; 9m p = 0.54; 12m p < 1 × 10⁻¹⁵). E, There was a weak but statistically significant correlation of Log10(EPSCAMPA) with the IOP integral (F(1,70) = 24.5, R2 = 0.26, p = 0.0000049). F, The AMPA/NMDA ratio did not significantly differ across groups (nested one-way ANOVA, F(3,38) = 1.145, p = 0.34). Group sizes: control total n = 46 cells, 16 mice (controls by age 6m n = 18 cells, 5 mice; 9m n = 23 cells, 9 mice; 12m n = 5 cells, 2 mice). G, Paired-pulse ratio differed among groups (nested one-way ANOVA, F(3,38) = 6.608, p = 0.0011) and was significantly higher in 12m D2 mice compared with controls (Dunnett’s multiple comparison: 6m p = 0.75; 9m p = 0.79; 12m p = 0.0040). C, D, F, G, Median ± IQR. Sample sizes: Control, n = 40 cells, 12 mice (controls by age: 6m n = 13 cells, 4 mice; 9m n = 22 cells, 8 mice; 12m n = 5 cells, 2 mice); 6m n = 21 cells, 7 mice; 9m n = 21 cells, 9 mice; 12m n = 29–31 cells, 10 mice. **p < 0.01; ****p < 0.00005; ns p > 0.05.
- Figure 5.
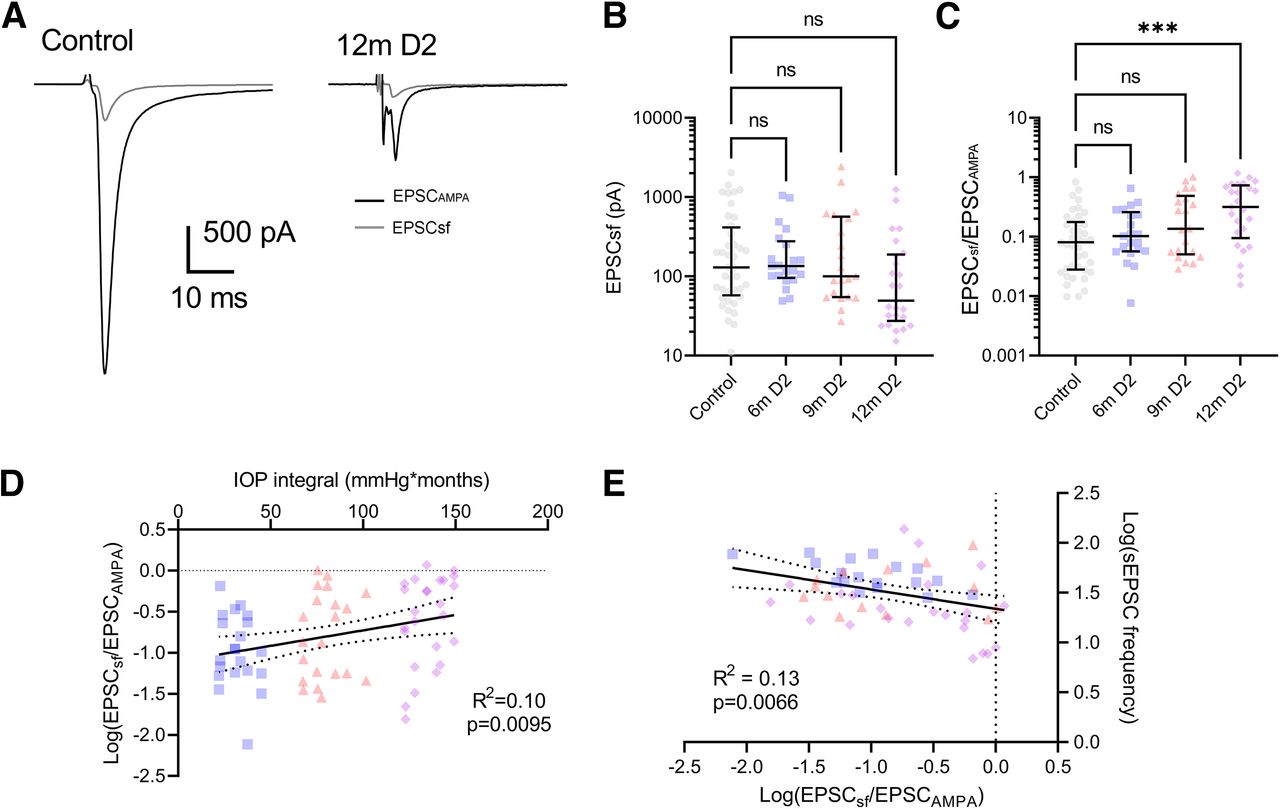
Progressive loss of convergent retinal inputs to dLGN relay neurons in DBA/2J mice. A, Example maximal EPSCs (EPSCAMPA) and single-fiber EPSCs (EPSCsf) from a control and 12m D2 mouse. B, The single-fiber EPSC amplitude (median ± IQR) did not differ among groups (nested one-way ANOVA, F(3,35) = 1.445, p = 0.25). C, The “fiber fraction” (EPSCsf/EPSCAMPA; median ± IQR) significantly differed among groups (nested one-way ANOVA, F(3,35) = 4.604, p = 0.0081) and the 12m value was significantly different from control (Dunnett’s multiple comparison; 6m p = 0.71, 9m p = 0.10; 12m p = 0.0033). D, The Log10(EPSCsf/EPSCAMPA) weakly but significantly correlated with the IOP integral in D2 mice (F(1,65) = 7.15 R2 = 0.099, p = 0.0095). Sample sizes: Control, n = 40 cells, 12 mice (controls by age: 6m n = 13 cells, 4 mice; 9m n = 22 cells, 8 mice; 12m n = 5 cells, 2 mice); 6m n = 21 cells, 7 mice; 9m n = 21 cells, 9 mice; 12m n = 26 cells, 9 mice. E, Log10(sEPSC frequency) weakly but significantly correlated with Log10(EPSCsf/EPSCAMPA; F(1,53) = 7.99, R2 = 0.13, p = 0.0066). 6m n = 18 cells, 7 mice; 9m n = 14 cells, 7 mice; 12m n = 23 cells, 9 mice. ***p < 0.005; ns p > 0.05.
- Figure 6.
Thalamocortical neuron dendritic remodeling in DBA/2J mice. A–C, Top row, Maximum intensity projections of filled TC neurons filled with Neurobiotin during whole-cell recording in coronal slices from control (A), 9m D2 (B), and 12m D2 (C) mice. Bottom row, TC neuron dendrite reconstructions. D–F, Sholl plots of each TC neuron included in the sample. G, Group data (mean ± SEM) of Sholl plots. H, Group data (mean ± SEM) of the peak number of Sholl intersections for each cell. There was a significant difference among groups (nested one-way ANOVA, F(2,16) = 8.346, p = 0.0033) and the 12m peak intersections was significantly lower than control (Dunnett’s multiple comparison, 9m p = 0.46; 12m p = 0.0019). I, Group data (mean ± SEM) of the dendritic field diameter measured as the equivalent diameter of a convex polygon of the dendritic field. There was no statistically significant difference among groups (nested one-way ANOVA, F(2,16) = 0.2320, p = 0.80). J, There was a weak but statistically significant correlation of the peak number of Sholl intersections with the IOP integral for mice with complete IOP records (F(1,18) = 5.65, R2 = 0.24, p = 0.029). Sample size: Control n = 15 cells (8 D2-control mice ages 4m–12m); 9m–10m D2 n = 15 cells (7 mice); 12m D2, n = 8 cells (5 mice). ***p < 0.005; ns p > 0.05.
- Figure 7.
No loss of retinal ganglion cell somata in 11- to 12-month-old DBA/2J mice. A, Two-photon immunofluorescence images of retinal flat mounts from a 12-month-old D2-control mouse and a 12-month-old D2 mouse stained with antibodies for NeuN and choline acetyltransferase (ChAT). Images were acquired from central retina (centered ∼500 μm from the optic nerve head) and peripheral retina (centered ∼1700 μm from the optic nerve head). B, Analysis of ChAT+ cell density (median ± IQR). Each data point is the ChAT+ cell density averaged across three to four quadrants for each retina. There was no significant difference in ChAT+ cell density between D2-control and D2 mice (central t(15) = 0.7860, p = 0.44; peripheral t(15) = 0.8289, p = 0.42, unpaired t test). C, RGC density was measured as the difference between the total number of NeuN+ cells and the number of NeuN+/ChAT+ double-labeled cells. There was no significant difference between D2-control and D2 RGC density (central t(15) = 0.4230, p = 0.68; peripheral t(15) = 0.0920, p = 0.93, unpaired t test). Sample sizes: D2-control, n = 8 retinas, 4 mice; D2, n = 9 retinas, 5 mice. ns p > 0.05.


In this issue


