

Article Figures & Data
Figures
- Figure 1.
Depiction of the apparatus used to assess Pavlovian Conditioned Approach (PCA) behavior (a) and determination of ST, GT, and INT phenotypes [b; N = 106, 55 females; shown are individual data points, means and SD (M ± SD)]. PCA behavior was assessed across five consecutive sessions/days. a, Illumination of a red house light indicated the beginning of a PCA test session. The CS for each trial was the extension of the illuminated lever into the chamber for 8 s (shown on the left of the chamber’s intelligence panel). After lever retraction, a pellet was immediately delivered into the magazine (bottom of the center of the panel). Rats were presented with 25 lever/pellet pairings delivered on a VI-90 (30–150 s) schedule. On average, PCA test sessions lasted 37.5 min. b, Positive PCA scores indicate a bias toward approach and operation of the Pavlovian food cue (STs), while negative PCA scores indicate a bias toward approaching the magazine (GTs). Dashed lines indicate the ±0.4 cutoff score for assigning the three phenotypes. Scores obtained from the first session (left) indicated that the majority of rats did not exhibit a bias toward the lever (CS) or the magazine. By days 4 and 5 (right), nearly a third of the rats had developed a preference for approaching the CS while 46/106 rats emerged as goal-trackers (the final classification was based on the average of individual PCA scores from sessions 4 and 5). In this sample, females were more likely to be classified as STs and males were more likely to emerge as GTs (see Results).
- Figure 2.
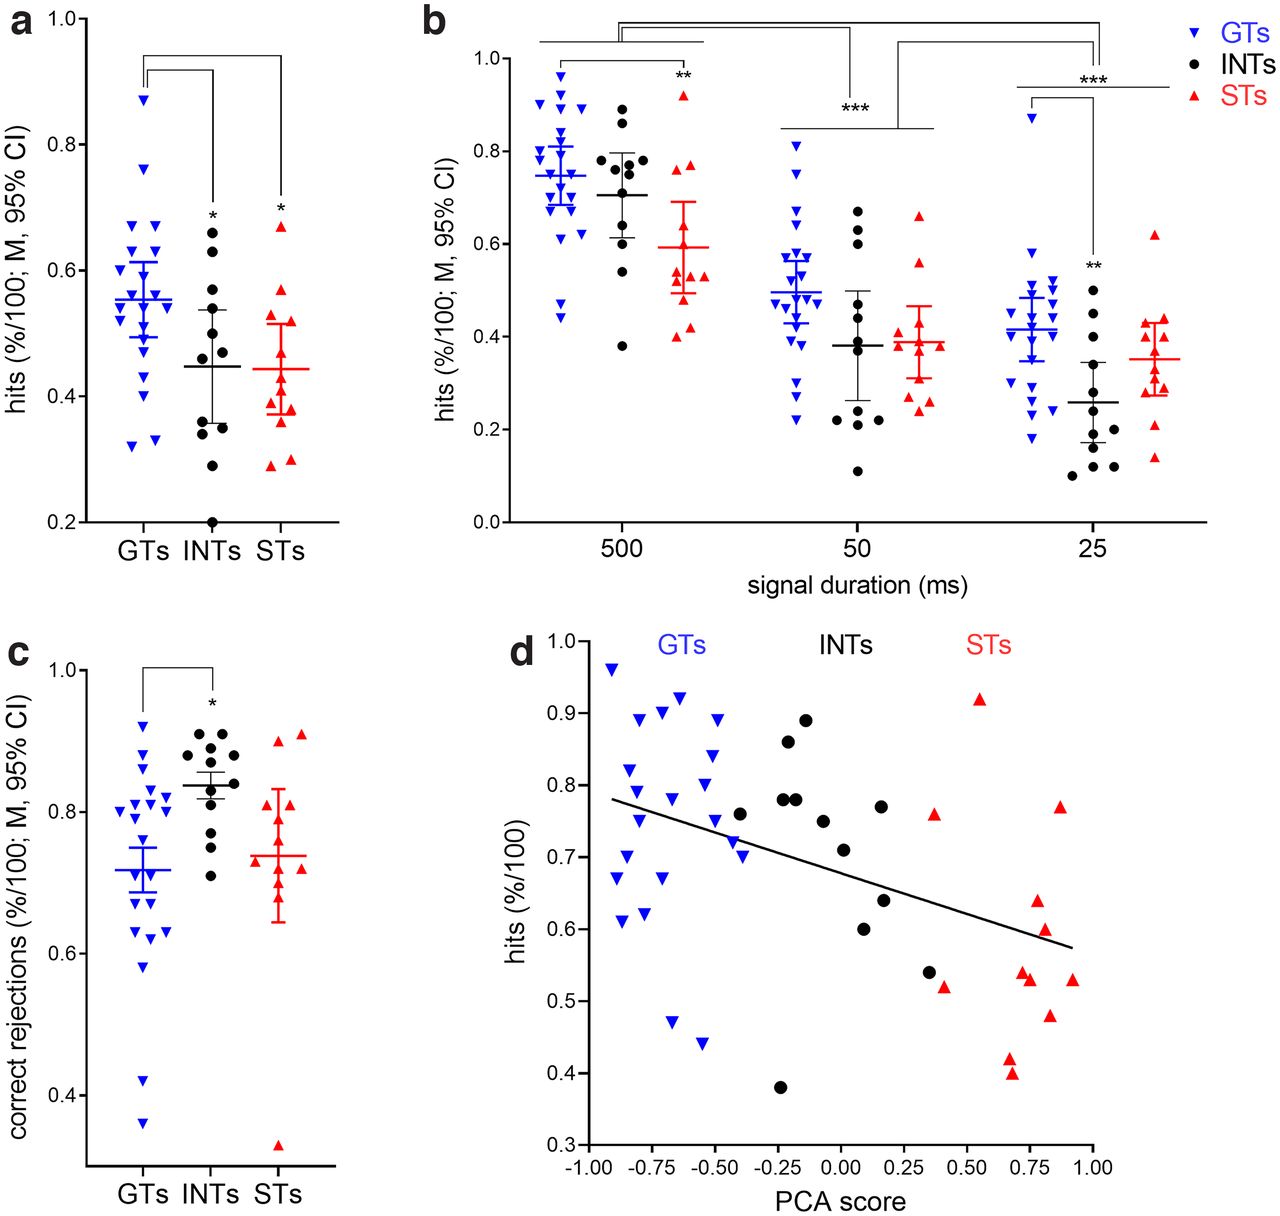
Attentional performance of GTs, INTs, and STs. Unless noted otherwise, these and subsequent data figures show individual values, means and 95% confidence intervals (CIs). Furthermore, figures depict the results of post hoc multiple comparisons (*p < 0.05, **p < 0.01, ***p < 0.001; see Results for ANOVAs, effect sizes, and other major statistical findings). a, A main effect of phenotype on the relative number of hits reflected that GTs scored more hits than INTs and STs. b, Across all phenotypes, fewer hits were scored to 50- and 25-ms signals when compared with longest signals. Moreover, STs had fewer hits to the longest signals when compared with GTs. c, The relative number of correct rejections did not differ between GTs and STs but was unexpectedly higher in INT relative to GTs (see Results for a follow-up of this finding on response bias). d, depicts the significant correlation between the relative number of hits to longest signals and PCA scores. More positive PCA scores (greater expression of sign-tracking behavior) predicted lower detection rates.
- Figure 3.
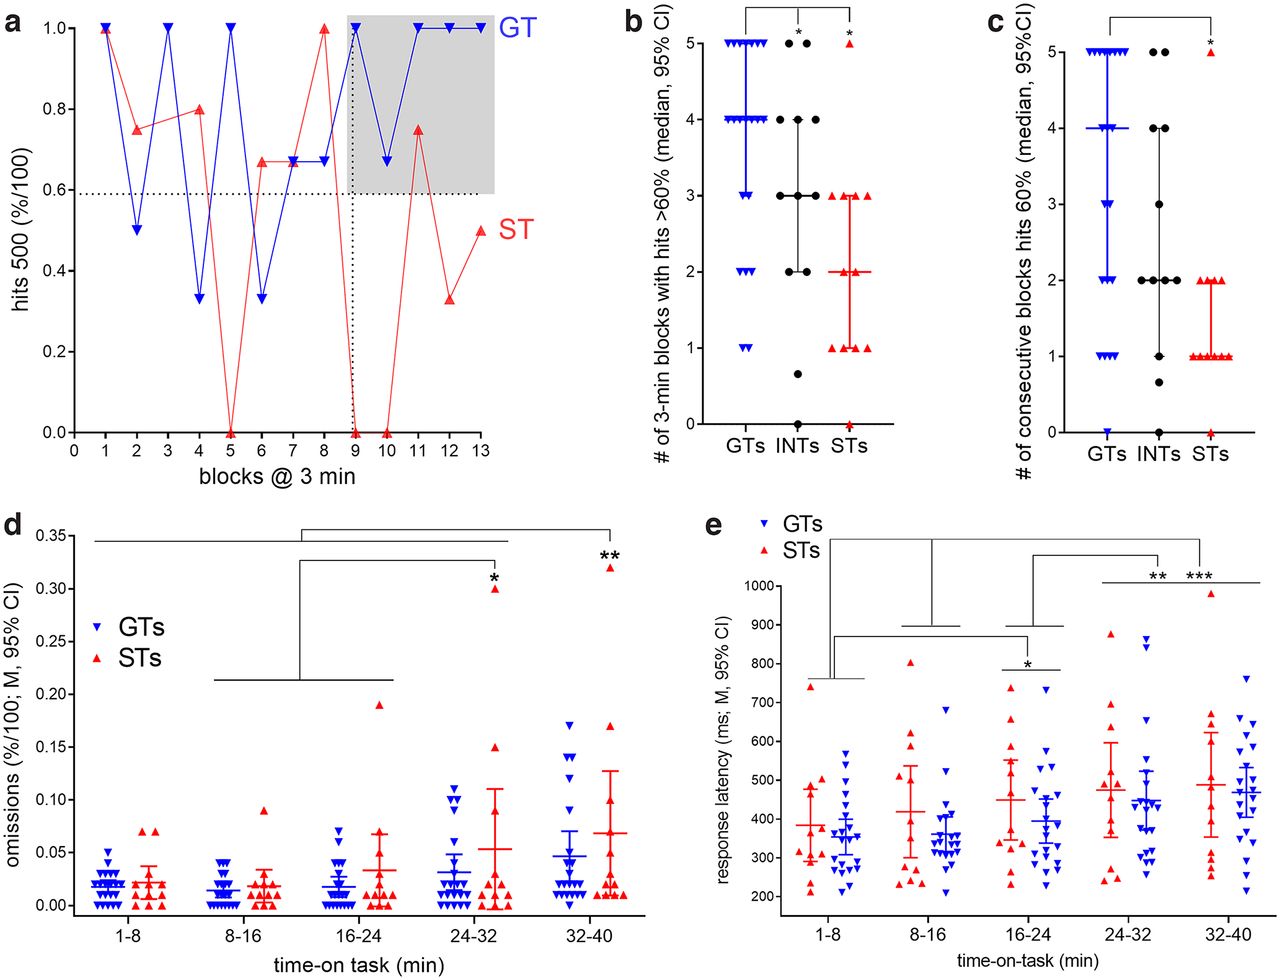
Decline in hits in STs toward the end of the session. Performance data were extracted from individual sessions and collapsed over 5-min blocks, yielding 13 blocks of trials. a, Illustration of the relative number of hits to longest signals by a representative GT and a ST. In contrast to the GT, the ST’s hit rate was less stable, fluctuating between high (>60%) and low levels (<30%) particularly during the last five blocks of trials. To quantify this observation, for the last five blocks we counted the number of blocks with above-chance hit rates (<60%; gray area in a) and the number of consecutive blocks with >60% hits separately for STs and GTs (shown in b and c, respectively). The analysis of both measures indicated main effects of phenotype; multiple comparisons (Mann–Whitney U test; see Results) confirmed that in comparison to GTs, the hit rates of STs relatively rarely reached above-chance level (b), and if, rarely stayed at this level for longer than one block (c). d, To assess a possible contribution of loss of motivation in STs to their decrease in hits, we also analyzed the relative number of trials during which rats did not press a lever (omissions; d). Omissions overall remained relatively rare (less than ∼10% of trials), slightly but significantly increased toward the end of the session (see Results from post hoc comparisons in d), but omissions did not differ between the phenotypes (no main effect and no interaction between the effects of block and phenotype). Likewise, the analysis of response latencies for hits to longest signals (time between extension of the lever and a lever press) indicated that response times increased for all animals toward later blocks (e), but that phenotype did not influence response latencies (no main effect and no interaction between the effects of block and phenotype).
- Figure 4.
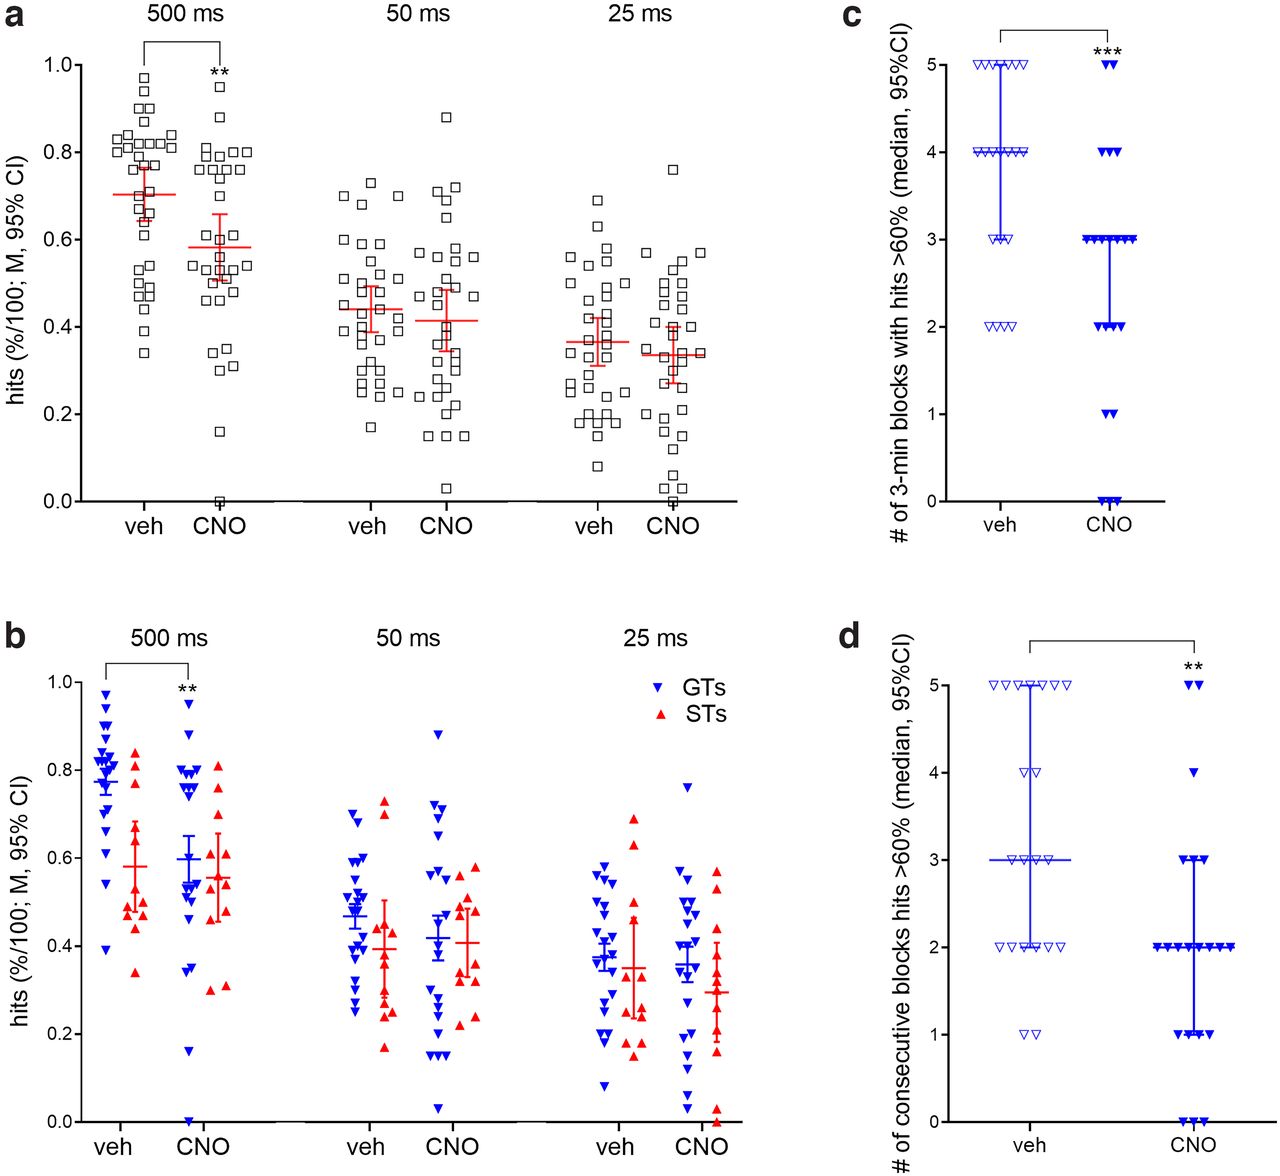
CNO administration reduced hit rates in GTs, but not STs, and specifically during the last 15 min of trials of the test session. a, A significant interaction between the effects of CNO and signal duration reflected that CNO suppressed hit rates to longest, but not 50- and 25-ms signals. Hits to the shorter signals approached chancel level, thereby limiting the demonstration of effects of CNO. A three-way interaction (phenotype × CNO × signal duration) originated from a selective effect of CNO on the hits to longest signals in GTs (b). The CNO-induced loss of hits to longest signals manifested specifically during the last 15 min of performance, as indicated by a significant reduction of the number of 3-min blocks with >60% hits (c) and of consecutive blocks with above-chance hit rates (d; Wilcoxon test, see Results). A similar analysis of the number of blocks with >60% hits, and the number of such consecutive blocks, from the preceding 15 min of trials (blocks 4–8) did not indicate significant effects of CNO (data not shown).
- Figure 5.
Visualization of DREADD expression in HDB cholinergic and noncholinergic neurons (m-cherry, appearing red, indicates the expression of the DREADD construct; Alexa 488, appearing green, indicates the presence of the VAChT). a, c, Low-magnification photomicrographs (500-μm scale inserted) of a coronal section showing the HDB of a GT and a ST, respectively. These photomicrographs exemplify the dense presence of magnocellular cholinergic neurons (green) as well as numerous neurons expressing the DREADD construct (red) or both markers. The areas marked by a whitish overlay in a and c are magnified in b and d, respectively, and show several double-labeled neurons (yellow puncta). In b, a cholinergic neuron (green) not expressing the DREADD-reporter is also present. For the 10 GTs selected for histologic analyses, viral transfection efficacy and the degree of double-labeling was significantly correlated for counts from the HDB (e) but not for the other two subregions. Moreover, the efficacy of DREADD activation, in terms of decreases in hits, was significantly correlated with viral transfection efficacy in the HDB (f) but not for counts obtained from the other two subregions. In none of the three subregions did the proportion of cholinergic neurons also expressing the DREADD correlate with decreases in hits (data not shown). e and f also depict the transfection efficacy and decreases in hits in the three STs selected for histologic analyses based on transfection efficacies that were comparable to those in GTs which showed the greatest effects of DREADD activation on SAT performance.


In this issue


