
Main menu

  • HOME
  • CONTENT
    • Early Release
    • Featured
    • Current Issue
    • Issue Archive
    • Blog
    • Collections
    • Podcast
  • TOPICS
    • Cognition and Behavior
    • Development
    • Disorders of the Nervous System
    • History, Teaching and Public Awareness
    • Integrative Systems
    • Neuronal Excitability
    • Novel Tools and Methods
    • Sensory and Motor Systems
  • ALERTS
  • FOR AUTHORS
  • ABOUT
    • Overview
    • Editorial Board
    • For the Media
    • Privacy Policy
    • Contact Us
    • Feedback
  • SUBMIT

User menu

Search

  • Advanced search
eNeuro
eNeuro

Advanced Search


  • HOME
  • CONTENT
    • Early Release
    • Featured
    • Current Issue
    • Issue Archive
    • Blog
    • Collections
    • Podcast
  • TOPICS
    • Cognition and Behavior
    • Development
    • Disorders of the Nervous System
    • History, Teaching and Public Awareness
    • Integrative Systems
    • Neuronal Excitability
    • Novel Tools and Methods
    • Sensory and Motor Systems
  • ALERTS
  • FOR AUTHORS
  • ABOUT
    • Overview
    • Editorial Board
    • For the Media
    • Privacy Policy
    • Contact Us
    • Feedback
  • SUBMIT
PreviousNext
Research ArticleResearch Article: New Research, Development

Using SuperClomeleon to Measure Changes in Intracellular Chloride during Development and after Early Life Stress

Lotte J. Herstel, Carlijn Peerboom, Sten Uijtewaal, Dunya Selemangel, Henk Karst and Corette J. Wierenga
eNeuro 7 December 2022, 9 (6) ENEURO.0416-22.2022; https://doi.org/10.1523/ENEURO.0416-22.2022
Lotte J. Herstel
1Cell Biology, Neurobiology and Biophysics, Biology Department, Utrecht University, 3584 CH, Utrecht, The Netherlands
  • Find this author on Google Scholar
  • Find this author on PubMed
  • Search for this author on this site
Carlijn Peerboom
1Cell Biology, Neurobiology and Biophysics, Biology Department, Utrecht University, 3584 CH, Utrecht, The Netherlands
  • Find this author on Google Scholar
  • Find this author on PubMed
  • Search for this author on this site
Sten Uijtewaal
1Cell Biology, Neurobiology and Biophysics, Biology Department, Utrecht University, 3584 CH, Utrecht, The Netherlands
  • Find this author on Google Scholar
  • Find this author on PubMed
  • Search for this author on this site
Dunya Selemangel
1Cell Biology, Neurobiology and Biophysics, Biology Department, Utrecht University, 3584 CH, Utrecht, The Netherlands
  • Find this author on Google Scholar
  • Find this author on PubMed
  • Search for this author on this site
Henk Karst
2Utrecht Brain Center, University Medical Center Utrecht, 3584 CX, Utrecht, The Netherlands
  • Find this author on Google Scholar
  • Find this author on PubMed
  • Search for this author on this site
Corette J. Wierenga
1Cell Biology, Neurobiology and Biophysics, Biology Department, Utrecht University, 3584 CH, Utrecht, The Netherlands
  • Find this author on Google Scholar
  • Find this author on PubMed
  • Search for this author on this site
  • ORCID record for Corette J. Wierenga
  • Article
  • Figures & Data
  • Info & Metrics
  • eLetters
  • PDF
Loading

Article Figures & Data

Figures

  • Figure 1.
    • Download figure
    • Open in new tab
    • Download powerpoint
    Figure 1.

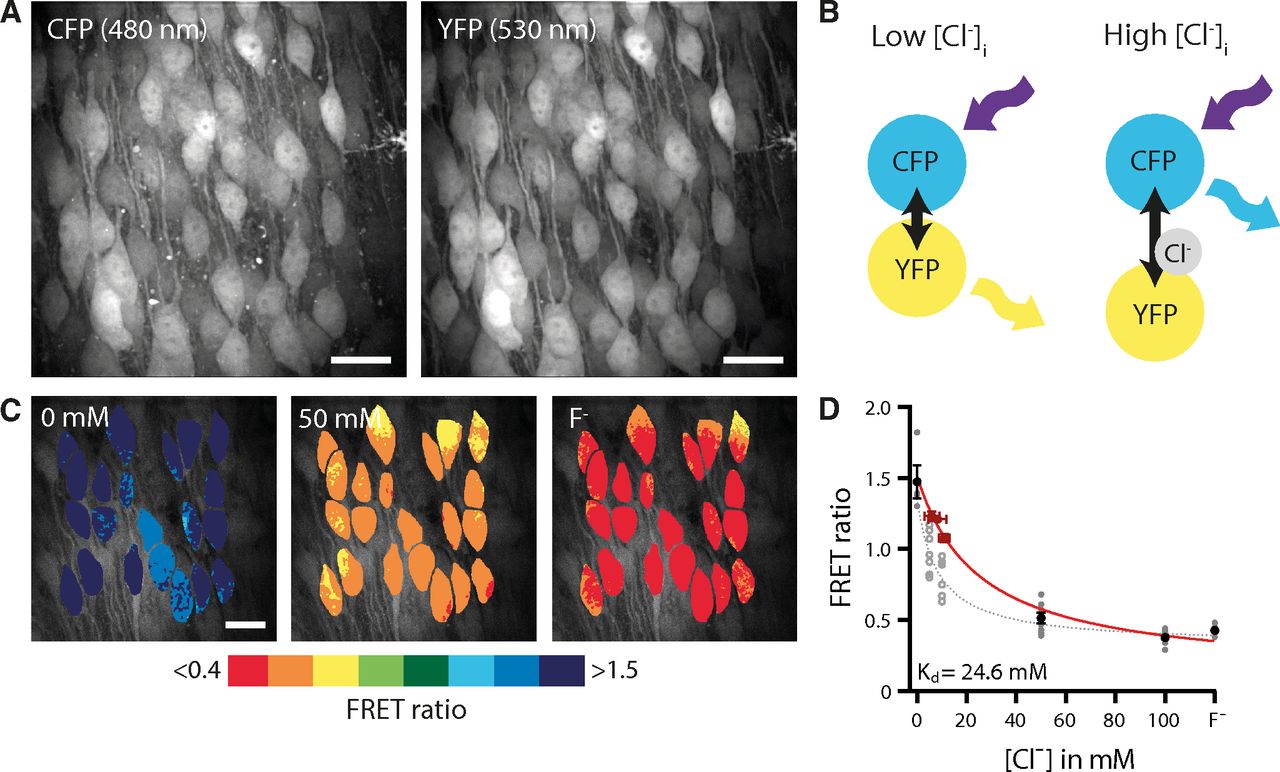
    Two-photon imaging of [Cl−]i in brain slices. A, Example image of CFP (480 nm) and YFP (530 nm) fluorescence in an organotypic hippocampal culture from a SClm mouse. Scale bar: 20 μm. B, Illustration of Fluorescence Resonance Energy Transfer (FRET) from CFP donor to YFP acceptor of the SClm sensor. FRET values (YFP/CFP fluorescence ratio) decrease with higher chloride concentrations. C, Two-photon imaging of chloride-dependent changes in the FRET ratio (530/480-nm emission) in a WT organotypic hippocampal culture with AAV SClm expression. [Cl−]i was clamped to the indicated external chloride concentration via ionophore treatment. Individual cells are color-coded to their FRET ratios. Scale bar: 20 μm. D, Calibration curve constructed from ionophore experiments (black/gray symbols) and perforated patch (red symbols) data. Data are presented as mean ± SEM. These data were fit by Equation 2, yielding the following fit parameters: Kd = 24.6 mM, Rmax = 1.51, Rmin = 0.12 (red curve; for details, see Materials and Methods). This calibration curve was used to convert FRET ratios into estimated chloride levels in the rest of this study. We also show the individual data points representing individual ionophore experiments (average over 12 cells per experiment). At 5 and 10 mM extracellular chloride FRET values were highly variable (open symbols). As described in Materials and Methods, we excluded these data points from our analysis and resorted to perforated patch recordings (red symbols) for this chloride range. The gray dotted line shows the alternative calibration curve when all ionophore data are included (fit parameters Kd = 8.4; Rmax = 1.35; Rmin = 0.32; without perforated patch data). Electrophysiology data from 11 cells (DIV1–3), 9 cells (DIV8–10), and 13 cells (DIV20–22); SClm data from 11 slices.

  • Figure 2.
    • Download figure
    • Open in new tab
    • Download powerpoint
    Figure 2.

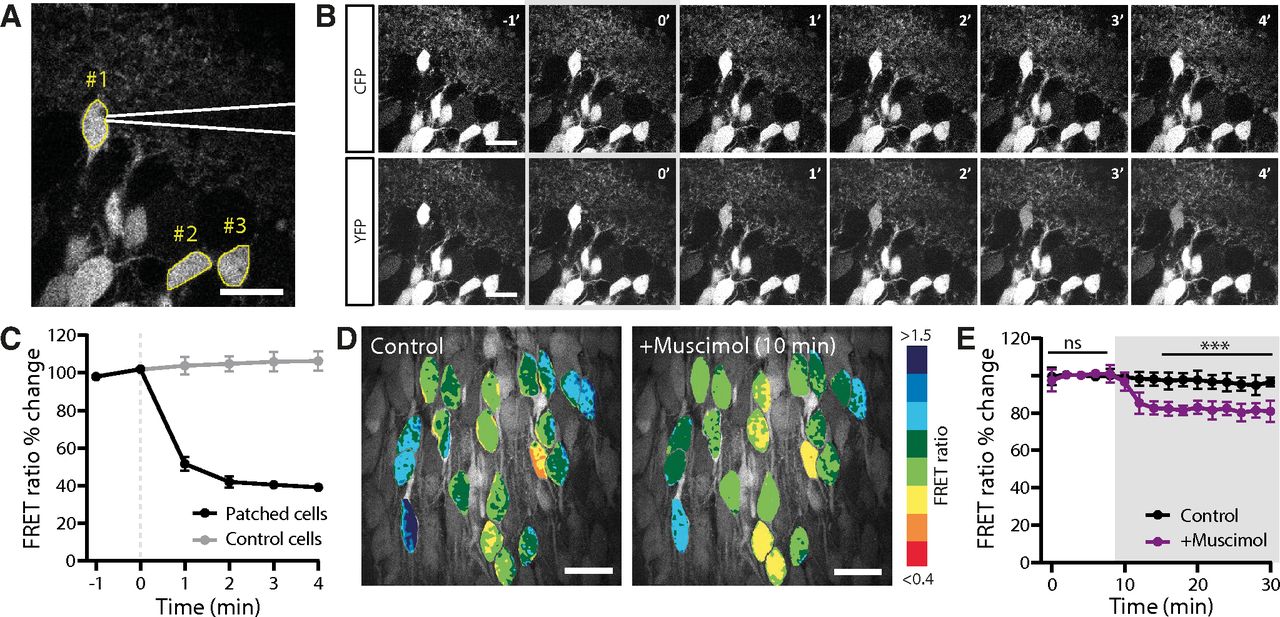
    Monitoring acute changes in [Cl−]i with SClm. A, Two-photon image of CA1 pyramidal neurons in the hippocampus of an acute slice from a SClm mouse. A patch pipette (in white) is attached to cell #1 for a whole-cell recording. Two control cells are indicated with #2 and #3. Scale bar: 20 μm. B, Time course of CFP (upper row) and YFP (lower row) fluorescence right before and during the first minutes after break-in. After break-in (0’; gray) cell #1 rapidly fills with the high chloride internal solution (70 mM KCl) resulting in a decrease in YFP fluorescence. Scale bar: 20 μm. C, Average FRET ratio over time for cells that were infused with 70 mM KCl (n = 2), and neighboring control cells (n = 4). Error bars represents SEM. D, Acute wash-in with muscimol in cultured slices with viral SClm expression caused a decrease in FRET ratio in CA1 pyramidal neurons within 10 min. Scale bar: 20 μm. E, Average FRET ratios over time during wash-in of muscimol (gray area) and control. Data from 84 cells, 7 slices, 4 mice in both groups.

  • Figure 3.
    • Download figure
    • Open in new tab
    • Download powerpoint
    Figure 3.

    Developmental decrease in [Cl−]i continues in organotypic cultures. A, Example of an organotypic hippocampal culture from a SClm mouse at DIV8. Scale bar: 500 μm. In the zoom an example of the FRET ratios determined in the CA1 area. Scale bar: 20 μm. B, Average FRET ratios of CA1 pyramidal cells at DIV2–3 (n = 10 slices of 6 mice), DIV8–10 (n = 14 slices of 8 mice), and DIV21–22 (n = 14 slices of 8 mice). There was a significant increase in FRET ratio over time (p = 0.033 DIV2–3 vs DIV8–10; p = 0.008 DIV2–3 vs DIV21–22; p > 0.99 DIV8–10 vs DIV21–22; KW test). C, Average estimated [Cl−]i as calculated from the FRET ratios in B. There was a significant decrease in [Cl−]i over time (p = 0.006 DIV2–3 vs DIV8–10; p =0.003 DIV2–3 vs DIV21–22; p = 0.93 DIV8–10 vs DIV21–22; one-way ANOVA). D, Cumulative distribution of FRET ratios for individual cells at the three time points. For each slice, 15 cells were randomly selected, making the total of number of plotted cells per condition at least 150 (p < 0.001 DIV2–3 vs DIV8–10 and vs DIV21–22; p = 0.053 DIV8–10 vs DIV21–22; KS test). E, Individual FRET ratios plotted against soma depth in slices at DIV2–3 (n = 186 neurons). Line represents linear regression fit (r = 0.004; p = 0.41). F, Same as E at DIV8–10 (n = 299 neurons). Line represents linear regression fit (r = 0.002; p = 0.48). G, Same as E at DIV21–22 (n = 314 neurons). Line represents linear regression fit (r = 0.001; p = 0.50).

  • Figure 4.
    • Download figure
    • Open in new tab
    • Download powerpoint
    Figure 4.

    Higher [Cl−]i in L2/3 cells in mPFC slices from mice that experienced early life stress. A, Two-photon image of layer 2/3 neurons of the medial PFC of an acute slice of a P9 SClm mouse. Shown is the CFP and YFP fluorescence, and the corresponding FRET ratios. Individual cells are color-coded to their FRET ratios. Scale bar: 20 μm. B, Average FRET ratios from control mice and from mice after ELS. Data from seven mice in both groups (p = 0.55, t test). The average FRET ratios were significantly lower in the ELS condition when analyzed per slice (p < 0.01, t test) or per cell (p < 0.0001, MW test; data not shown). C, Average estimated [Cl−]i as calculated from the FRET ratios in B (p = 0.07, MW test). D, Cumulative distribution of individual FRET ratios in slices from control and ELS mice. For each mouse 50 cells were randomly selected, making a total of 350 plotted cells per condition (p < 0.001; KS test). E, Individual FRET ratios plotted against soma depth in slices from control mice (n = 443 neurons). Line represents linear regression fit (r = 0.035; p < 0.0001). F, Same as E for slices from mice after ELS (n = 470 neurons). Line represents linear regression fit (r = 0.058; p < 0.0001).

Back to top

In this issue

eneuro: 9 (6)
eNeuro
Vol. 9, Issue 6
November/December 2022
  • Table of Contents
  • Index by author
  • Ed Board (PDF)
Email

Thank you for sharing this eNeuro article.

NOTE: We request your email address only to inform the recipient that it was you who recommended this article, and that it is not junk mail. We do not retain these email addresses.

Enter multiple addresses on separate lines or separate them with commas.
Using SuperClomeleon to Measure Changes in Intracellular Chloride during Development and after Early Life Stress
(Your Name) has forwarded a page to you from eNeuro
(Your Name) thought you would be interested in this article in eNeuro.
CAPTCHA
This question is for testing whether or not you are a human visitor and to prevent automated spam submissions.
Print
View Full Page PDF
Citation Tools
Using SuperClomeleon to Measure Changes in Intracellular Chloride during Development and after Early Life Stress
Lotte J. Herstel, Carlijn Peerboom, Sten Uijtewaal, Dunya Selemangel, Henk Karst, Corette J. Wierenga
eNeuro 7 December 2022, 9 (6) ENEURO.0416-22.2022; DOI: 10.1523/ENEURO.0416-22.2022

Citation Manager Formats

  • BibTeX
  • Bookends
  • EasyBib
  • EndNote (tagged)
  • EndNote 8 (xml)
  • Medlars
  • Mendeley
  • Papers
  • RefWorks Tagged
  • Ref Manager
  • RIS
  • Zotero
Respond to this article
Share
Using SuperClomeleon to Measure Changes in Intracellular Chloride during Development and after Early Life Stress
Lotte J. Herstel, Carlijn Peerboom, Sten Uijtewaal, Dunya Selemangel, Henk Karst, Corette J. Wierenga
eNeuro 7 December 2022, 9 (6) ENEURO.0416-22.2022; DOI: 10.1523/ENEURO.0416-22.2022
Twitter logo Facebook logo Mendeley logo
  • Tweet Widget
  • Facebook Like
  • Google Plus One

Jump to section

  • Article
    • Abstract
    • Significance Statement
    • Introduction
    • Materials and Methods
    • Results
    • Discussion
    • Acknowledgments
    • Footnotes
    • References
    • Synthesis
    • Author Response
  • Figures & Data
  • Info & Metrics
  • eLetters
  • PDF

Keywords

  • chloride
  • FRET sensor
  • GABA shift
  • two-photon microscopy

Responses to this article

Respond to this article

Jump to comment:

No eLetters have been published for this article.

Related Articles

Cited By...

More in this TOC Section

Research Article: New Research

  • Optimizing and Benchmarking Machine Learning and Traditional Synaptic Event Detection Pipelines in Neurophysiology Experiments
  • Postnatal development of pyramidal neurons excitability and synaptic inputs in mouse gustatory cortical circuits
  • Refinement of locomotor activity during development is correlated to increased dopaminergic signaling in larval zebrafish.
Show more Research Article: New Research

Development

  • Astrocyte-derived PTPRZ1 regulates excitatory synapse density in the mouse cortex
  • sAPPα Inhibits Neurite Outgrowth in Primary Mouse Neurons via GABA B Receptor Subunit 1a
  • Partial Deletion of Cxcl12 from Hippocampal Cajal–Retzius Cells Does Not Disrupt Dentate Gyrus Development or Neurobehaviors
Show more Development

Subjects

  • Development
  • Home
  • Alerts
  • Follow SFN on BlueSky
  • Visit Society for Neuroscience on Facebook
  • Follow Society for Neuroscience on Twitter
  • Follow Society for Neuroscience on LinkedIn
  • Visit Society for Neuroscience on Youtube
  • Follow our RSS feeds

Content

  • Early Release
  • Current Issue
  • Latest Articles
  • Issue Archive
  • Blog
  • Browse by Topic

Information

  • For Authors
  • For the Media

About

  • About the Journal
  • Editorial Board
  • Privacy Notice
  • Contact
  • Feedback
(eNeuro logo)
(SfN logo)

Copyright © 2026 by the Society for Neuroscience.
eNeuro eISSN: 2373-2822

The ideas and opinions expressed in eNeuro do not necessarily reflect those of SfN or the eNeuro Editorial Board. Publication of an advertisement or other product mention in eNeuro should not be construed as an endorsement of the manufacturer’s claims. SfN does not assume any responsibility for any injury and/or damage to persons or property arising from or related to any use of any material contained in eNeuro.