

Article Figures & Data
Figures
- Figure 1.
a, Dichromatic sketch of a fully connected network with an external stimulus, S(λ). R: red cones, G: green cones, B: blue cones, H: horizontal cells. Solid black arrows represent inhibitory synaptic connections on cones from horizontal cells. Dashed black arrows represent excitatory synaptic connections between cones. b, Sensitivity functions of independent red, green, and blue zebrafish opsins (Cornelius, 2021; Yoshimatsu et al., 2021b). c, Cone response in Equation 1 as a function of the free parameters in Equation 2; the solid (dashed) line corresponds to the variation of the intensity (SD) for a fixed value σ = 1 (α = 0.5). d, Independent responses of photoreceptors to narrow Gaussian stimuli. Dashed curves are red, green, and blue zebrafish sensitivity curves and colored distributions correspond to five Gaussian stimuli with α = 0.5 and SD σ = 1 nm. Markers correspond to the independent responses, described by Equation 1, of the three photoreceptors. Colored markers show the response to the five plotted stimuli.
- Figure 2.
a, b, Phase portraits of Equation 7 for a dichromatic network with red and green photoreceptors, and with the parameters
- Figure 3.
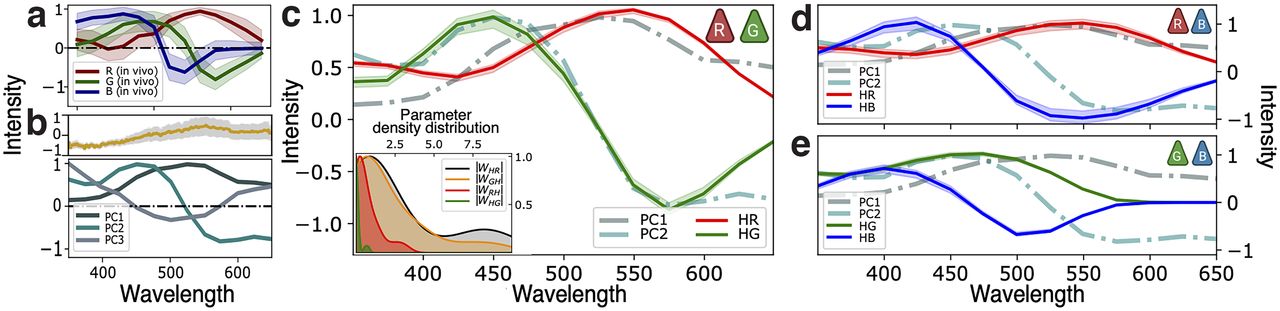
a, In vivo responses of red, green, and blue zebrafish opsins (Cornelius, 2021; Yoshimatsu et al., 2021b). b, Upper panel, Hyperspectral data from 30 images of aquatic natural images typical of the zebrafish larvae environment (Cornelius, 2021; Yoshimatsu et al., 2021b). Lower panel, First three principal components obtained from the hyperspectral data. c–e, Stationary solutions of Equation 7 for the optimal coupling parameters of a dichromatic network with (a) red and green, (b) red and blue, and (c) green and blue photoreceptors. Inset in a shows the distributions of the optimal parameters (absolute value, |wij|) over 20 repetitions of the gradient descent algorithm starting from different initial values; inhibitory parameters wiH are negative by definition; we used a KDE method to infer the curves. Red, green, and blue curves correspond to the stationary solutions of the membrane potentials hr, hg, and hb, respectively. Dashed curves correspond to the principal component curves of b.
- Figure 4.
a, Stationary solutions of Equation 8 for the optimal coupling parameters of the trichromatic network sketched in the inset. b, Sketch of a fully connected trichromatic network with two types of horizontal cells providing two successive inhibitory feedback mechanisms. c, Stationary solutions of Equations 8 and 10 for the optimal coupling parameters of the trichromatic network sketched in the inset. Red, green, and blue curves correspond to the stationary solutions of the membrane potentials hr, hg, and hb, respectively. Dashed curves correspond to the principal component curves of Figure 3b.
- Figure 5.
a, Intensity plot of the cost function (Eq. 11) for different opsin curves combinations, darker colors represent smaller values. Red opsin was first fixed to optimize all possible combinations; the optimal curve is shown in the upper plot; x and y labels in the intensity plot represent the number of shifts (in steps of 5 nm) of blue and green curves respectively, with the sign indicating the shift direction. b, Comparison between experimentally observed sensitivity functions (dashed lines) and the optimal fitting curves (solid lines). Arrows indicate the optimal shift direction. c, Network responses for this optimal set of opins.


In this issue


