

Article Figures & Data
Figures
- Figure 1.
CB1 expression is upregulated during homeostatic downscaling in mature neurons. A, Representative Western blottings of surface and total protein expression in developing (DIV10–DIV12) and mature (DIV21–DIV25) cultured cortical neurons treated for 48 h with control media (Ctrl), 20 μm bicuculline (BCC), or 1 μm tetrodotoxin (TTX). B, C, Quantification of data shown in A in developing neurons (B) and mature neurons (C). BCC induced downregulation of surface GluA1 and dephosphorylation of S845 regardless of age, but upregulation of total and surface CB1 only in mature neurons. Results were normalized for each protein to its expression under control levels and presented as mean ± SEM from at least three independent culture preparations with triplicate wells. D, E, Representative Western blottings and quantification of total protein expression in cultured cortical neurons at DIV8, DIV15, and DIV22. Results are normalized for each protein to its expression levels at DIV15, and presented as mean ± SEM from at least three independent culture preparations with quadruplicate wells. Standard unpaired t test was used for B, C and one-way ANOVA with Dunnett’s multiple comparison test was used for E; *p ≤ 0.05, **p ≤ 0.01. ns = not significant.
- Figure 2.
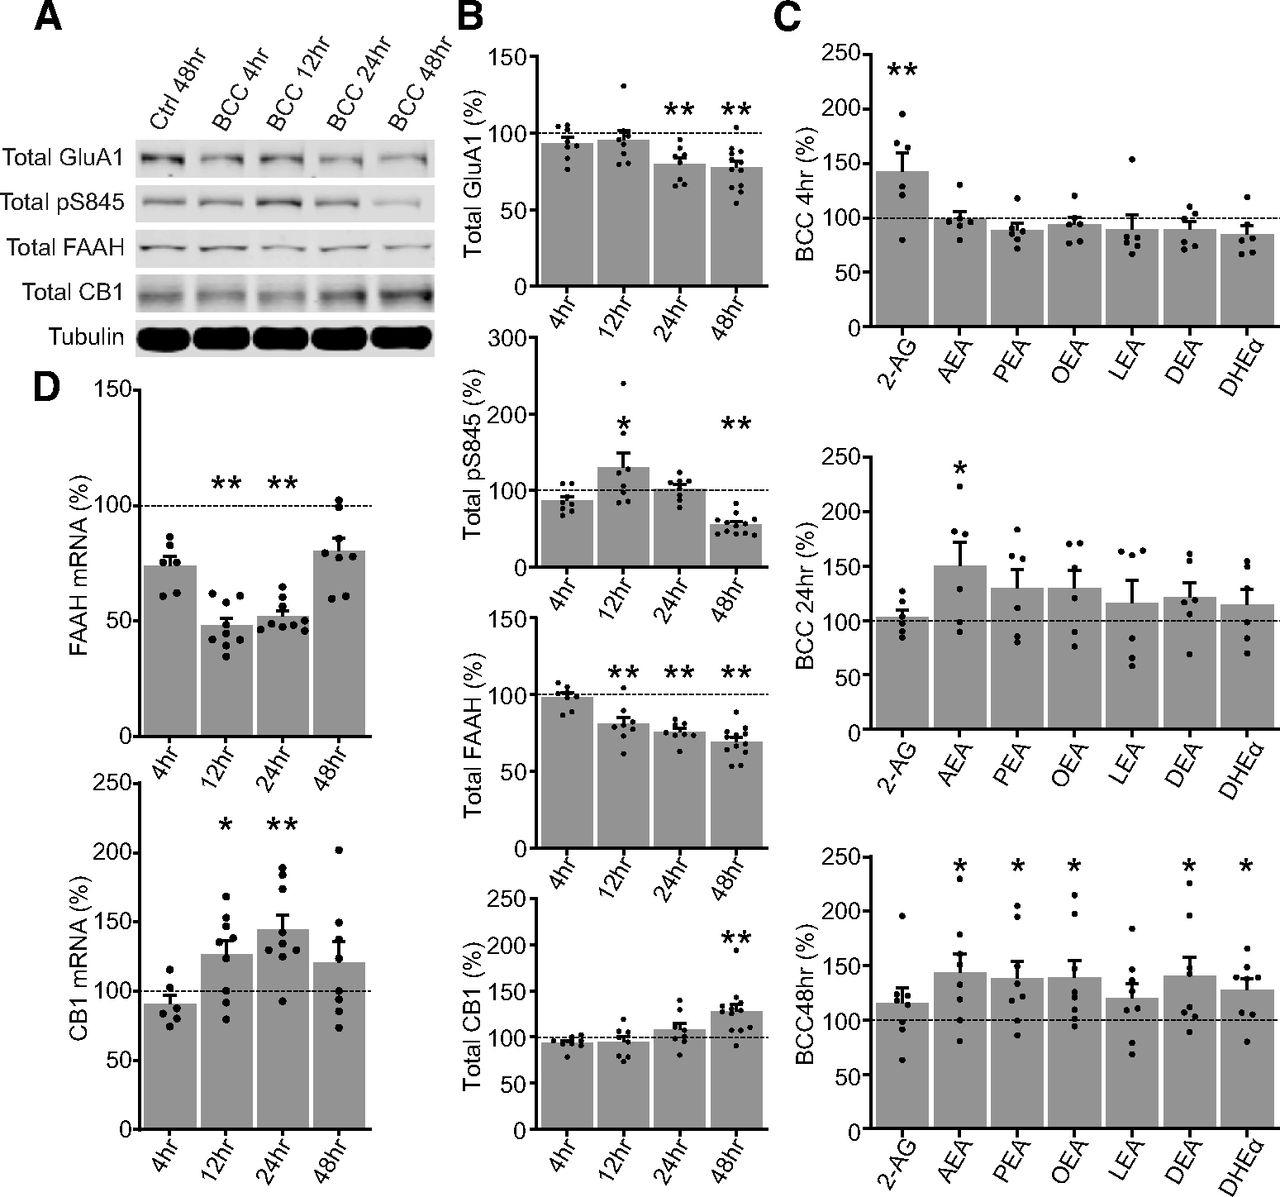
Time course of homeostatic downscaling in rat primary cortical neuron culture. A, B, Representative Western blottings and quantification of total protein expression in DIV17 neurons treated by control media for 48 h (Ctrl 48 h) or by 20 μm bicuculline (BCC) for 4, 12, 24, or 48 h. FAAH is significantly downregulated from 12 h and onward, but CB1 do not become significantly upregulated until the end of the 48-h time course. Results are normalized for each protein to its expression levels in vehicle 48 h (dotted line), and presented as mean ± SEM from four to six independent culture preparations with duplicate wells. C, Quantification of targeted lipidomics analyzing 2-AG, AEA, and various n-acylethanolamines (NAEs) in DIV17 neurons untreated or treated by 20 μm BCC for 4, 24, or 48 h. Note that the neurons transition from a 2-AG dominated response at 4 h to an AEA-dominated and NAEs-dominated response at 24 and 48 h, corresponding with the downregulation of FAAH shown in B. Results from each treatment group are normalized to a matching control and presented as mean ± SEM from three to four independent culture preparations with duplicate plates. D, Quantification of mRNA expression of FAAH and CB1 in DIV18–DIV20 neurons untreated or treated by 20 μm BCC for 4, 24, or 48 h. Results are normalized for each mRNA target to its expression levels in vehicle 48 h (dotted line), and presented as mean ± SEM from three independent culture preparations with triplicate wells. One-way ANOVA with Dunnett’s multiple comparison test; *p ≤ 0.05, **p ≤ 0.01.
- Figure 3.
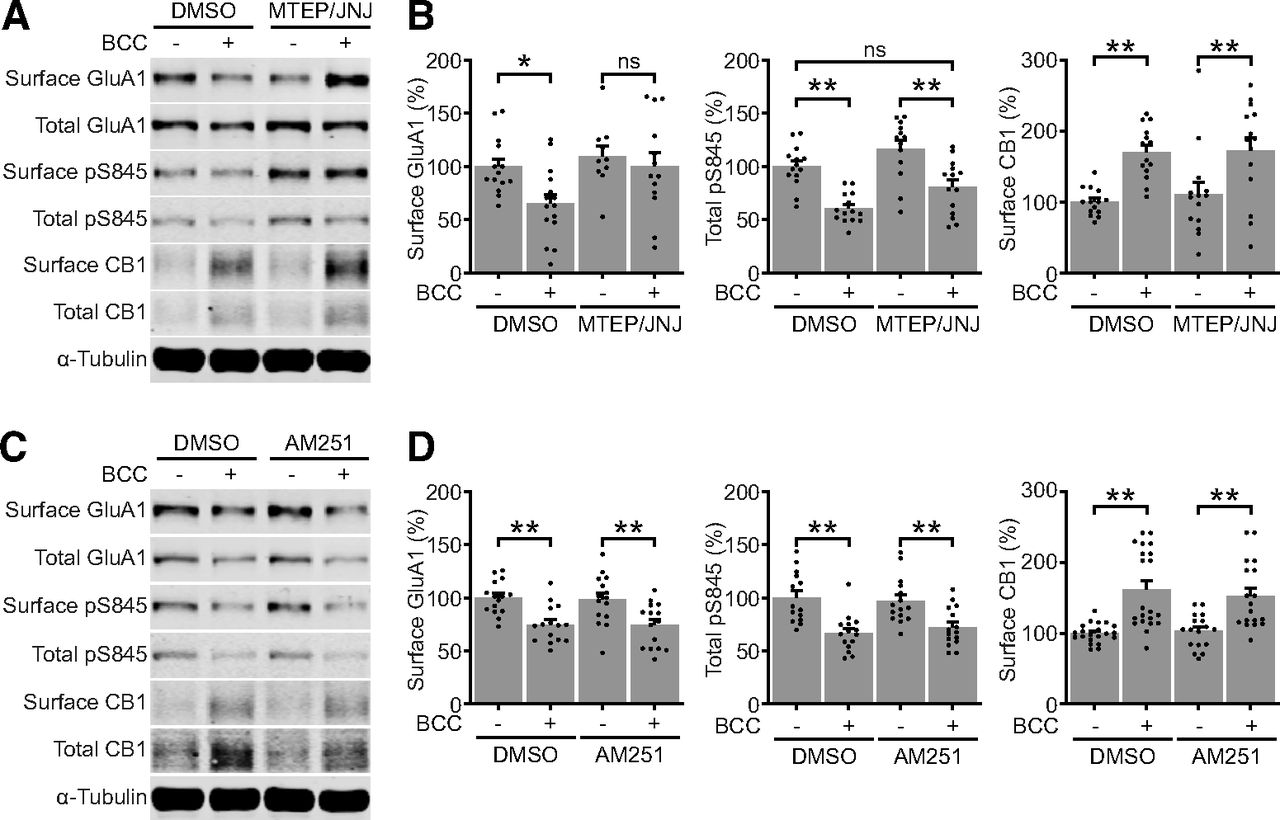
Glutamatergic and cannabinergic adaptations occur through independent mechanisms. A, B, Representative blots and quantifications of surface and total protein expression in DIV21–DIV25 neurons treated by DMSO or 20 μm BCC in the absence or presence of 1 μm MTEP hydrochloride, a selective mGluR5 antagonist, and 100 nm JNJ 16259685, a selective mGluR1 antagonist (MTEP/JNJ). MTEP/JNJ blocked BCC-induced downregulation of surface GluA1 but not the upregulation of surface CB1. C, D, Representative blots and quantifications of surface and total protein expression in DIV21–DIV25 neurons treated by DMSO or 20 μm bicuculline (BCC) in the absence or presence of 500 nm AM251, a selective CB1 antagonist. AM251 did not block BCC-induced downregulation of surface GluA1 or the upregulation of surface CB1. Results are normalized for each protein to its expression levels in control group, and presented as mean ± SEM from four to six independent culture preparations with triplicate wells. One-way ANOVA with Šidák’s multiple comparison test; *p ≤ 0.05, **p ≤ 0.01. ns = not significant.
- Figure 4.
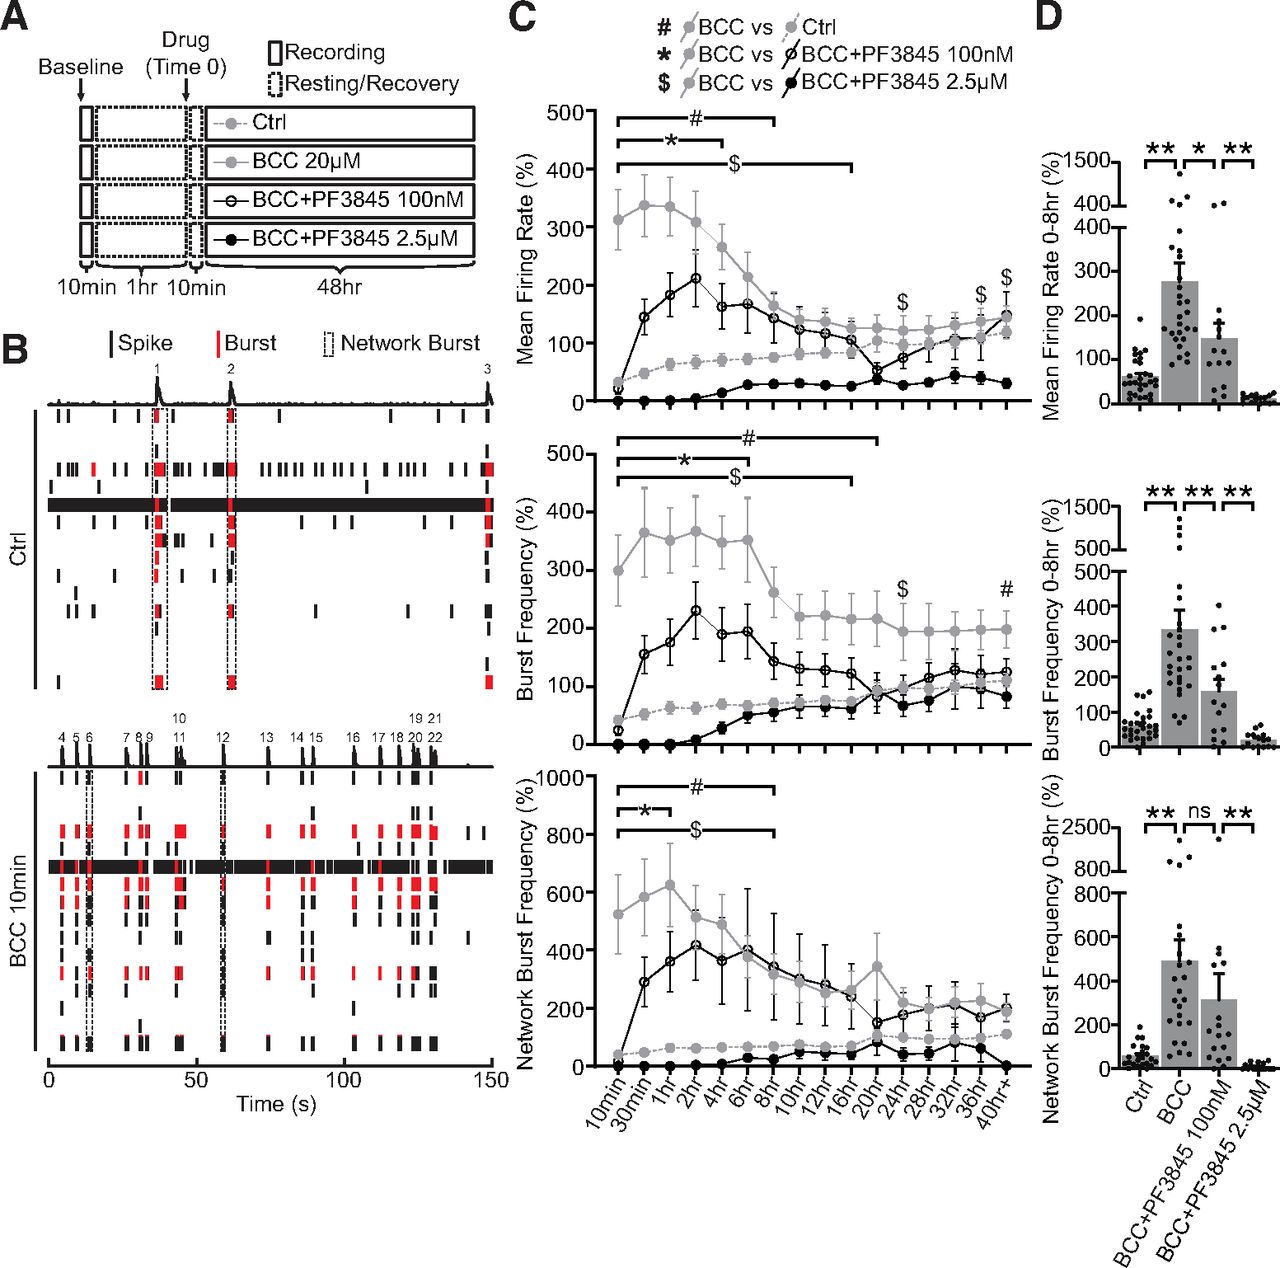
Elevated FAAH-substrates suppress network activities during homeostatic adaptation to BCC-induced hyperexcitation. A, Experimental design. Neurons DIV21–DIV28 were recorded for a 10-min baseline, and then allowed to rest for 1 h. Network activities were then recorded for 10 min once every 30 min over 48 h in neurons treated with ctrl media (Ctrl), 20 μm BCC alone (BCC 20 μm), or 20 μm BCC in combination with PF3845, a potent FAAH inhibitor, at a lower dosage (BCC+PF3845 100 nm) or a higher dosage (BCC+PF3845 2.5 μm). Media were allowed to equilibrate for 10 min after drug treatment (Time 0) before the first point was taken. B, Raster plot of one well (16 electrodes) of MEA activities recorded for 150 s at baseline (Ctrl) or 10 min following 20 μm BCC treatment (BCC 10 min). Single electrode spikes (short black line) and single electrode bursts (short red line) are quantified as mean firing rate and burst frequency, while network bursts (dotted black box or numbered peaks) are quantified as network burst frequency, as shown in C. Note that 20 μm BCC rapidly induces hyperexcitation in network activities within 10 min. This is exemplified here by three network bursts under control, but 19 after 10 min of BCC. C, Quantification of mean firing rate, burst frequency and network burst frequency, as illustrated in B, for neurons DIV21–DIV28 treated for 48 h with ctrl media, 20 μm BCC, BCC+PF3845 100 nm or BCC+PF3845 2.5 μm, as illustrated in A. BCC treatment rapidly (<10 min) converts the network to a burst firing pattern which remains significantly elevated for ∼8 h, and the hyperexcitation can be suppressed by PF3845 in a dose-dependent manner. Results were normalized to a within-well control recorded for 10 min at ∼1 h before treatment (A, baseline), and presented as mean ± SEM from six independent culture preparations with quadruplicate wells. Two-way ANOVA with Dunnett’s multiple comparison test #p ≤ 0.05 Ctrl versus BCC, *p ≤ 0.05 BCC versus BCC+PF3845 100 nm, $p ≤ 0.05 BCC versus BCC+PF3845 2.5 μm throughout the duration indicated by the bracket and/or at time points denoted by the symbols. D, Quantification of average mean firing rate, burst frequency, and network burst frequency for the first 8 h of treatment. Note that the dose-dependent suppression of network activities is particularly prominent in the first 8 h during which the BCC-induced hyperexcitation remains statistically significant. One-way ANOVA with Tukey’s multiple comparison test; *p ≤ 0.05, **p ≤ 0.01. ns = not significant.
- Figure 5.
CB1 antagonism suppresses network activities before and after adaptation to BCC-induced hyperexcitation. A, Experimental design. Neurons DIV21–DIV28 were treated with ctrl media (Ctrl, or naive) or 20 μm BCC (BCC, or downscaled) for 40 h before baseline was recorded for 10 min. After resting for 1 h, naive or downscaled neurons were recorded and quantified with MEA in 10-min bins once every 30 min over 6 h in the absence (Ctrl, BCC) or presence (Ctrl+AM251, BCC+AM251) of 50 nm AM251, a potent CB1 inverse agonist. Media were allowed to equilibrate for 10 min after the drug treatment (Time 0) before the first time point was taken. The same experimental design was used for live-cell imaging, but those cells were only recorded for 1 h in the absence or presence of 500 nm AM251. B, Quantification of mean firing rate, burst frequency and network burst frequency from naive neurons untreated (Ctrl) or treated for 6 h with 50 nm AM251 (Ctrl+AM251), and from downscaled neurons untreated (BCC) or treated for 6 h with 50 nm AM251 (BCC+AM251), as illustrated in A. Note that AM251 strongly suppresses network activities in naive cells which remains significantly depressed for 1.5 h, but the response is greatly attenuated in downscaled cells. Results were normalized to a within-well control recorded for 10 min at ∼1 h before treatment (A, baseline), and presented as mean ± SEM from four to six independent culture preparations with quadruplicate wells. Two-way ANOVA with Tukey’s multiple comparison test; #p ≤ 0.05 Ctrl versus Ctrl+AM251, *p ≤ 0.05 Ctrl+AM251 versus BCC+AM251 throughout the duration indicated by the bracket and/or at time points denoted by the symbols. C, Quantification of average mean firing rate, burst frequency and network burst frequency for the first 1.5 h of treatment, during which AM251-induced suppression of network activities remains statistically significant in naive cells. Note that attenuation of AM251-induced suppression of network activities is particularly prominent during the first 1.5 h. D, Double derivative images showing spontaneous changes in iGluSnFR fluorescence corresponding to a single synchronous glutamate event under control condition. E, Representative traces of iGluSnFR fluorescence corresponding to multiple synchronous glutamate events recorded in DIV21–DIV25 culture cortical neurons naive and untreated (Ctrl, top left), naive and treated with 500 nm AM251 for up to 1 h (Ctrl+AM251, bottom left), downscaled and untreated (BCC, top right) or downscaled and treated with 500 nm AM251 for up to 1 h (BCC+AM251, bottom right), similar to MEA experimental design illustrated in A. Results are presented as change in fluorescence for each recording normalized to its minimum fluorescence (ΔF/F, dotted line represent minimum fluorescence). Scale bar represents 10 s (horizontal) and 10% change from minimum fluorescence (vertical). Ctrl data in panel are from the same set of data as in Extended Data Figure 5-1. F, Quantification of interevent intervals and area under curve for data shown in E. Acute AM251 application causes reduction of glutamatergic event amplitude in naive and downscaled cells but leads to increased frequency in downscaled and reduced frequency in naive cells. Results are presented as mean ± SEM from three to six independent culture preparations with four to eight wells in each culture. One-way ANOVA with Šidák’s multiple comparison test; *p ≤ 0.05, **p ≤ 0.01. ns = not significant.
- Figure 6.
Model of homeostatic adaptation of the endocannabinoid system during downscaling. BCC-induced downscaling drives coordinated remodeling of synapses: (1) downregulation of surface AMPARs, (2) downregulation of FAAH, (3) accumulation of FAAH substrates including AEA, and (4) upregulation of surface CB1 receptors. Elevated FAAH substrates may serve to suppress network during adaptation to hyperexcitation, but CB1 signaling is also required to maintain network activities at baseline.


Extended Data
Extended Data Figure 5-1
Fluorescence responses of iGluSnFR synchronous events to acute (10 min) application of pharmacological treatments: Ctrl (A), 20 μm BCC (B), 50 μm D-AP5 (C), and 1 μm TTX (D). Note the similarity to previously reported MEA network activities: glutamatergic events show hyperexcitation to BCC, a GABA antagonist, is dramatically reduced but not eliminated by D-AP5, an NMDA antagonist, and completely abolished by TTX, a voltage-gated sodium channel blocker. Results are presented as change in fluorescence for each recording normalized to its minimum fluorescence (ΔF/F, dotted line represent minimum fluorescence). Scale bar represents 10 s (horizontal) and 10% change from minimum fluorescence (vertical). Ctrl data in panel are from the same set of data as in Figure 5. Download Figure 5-1, EPS file.
In this issue


