

Article Figures & Data
Figures
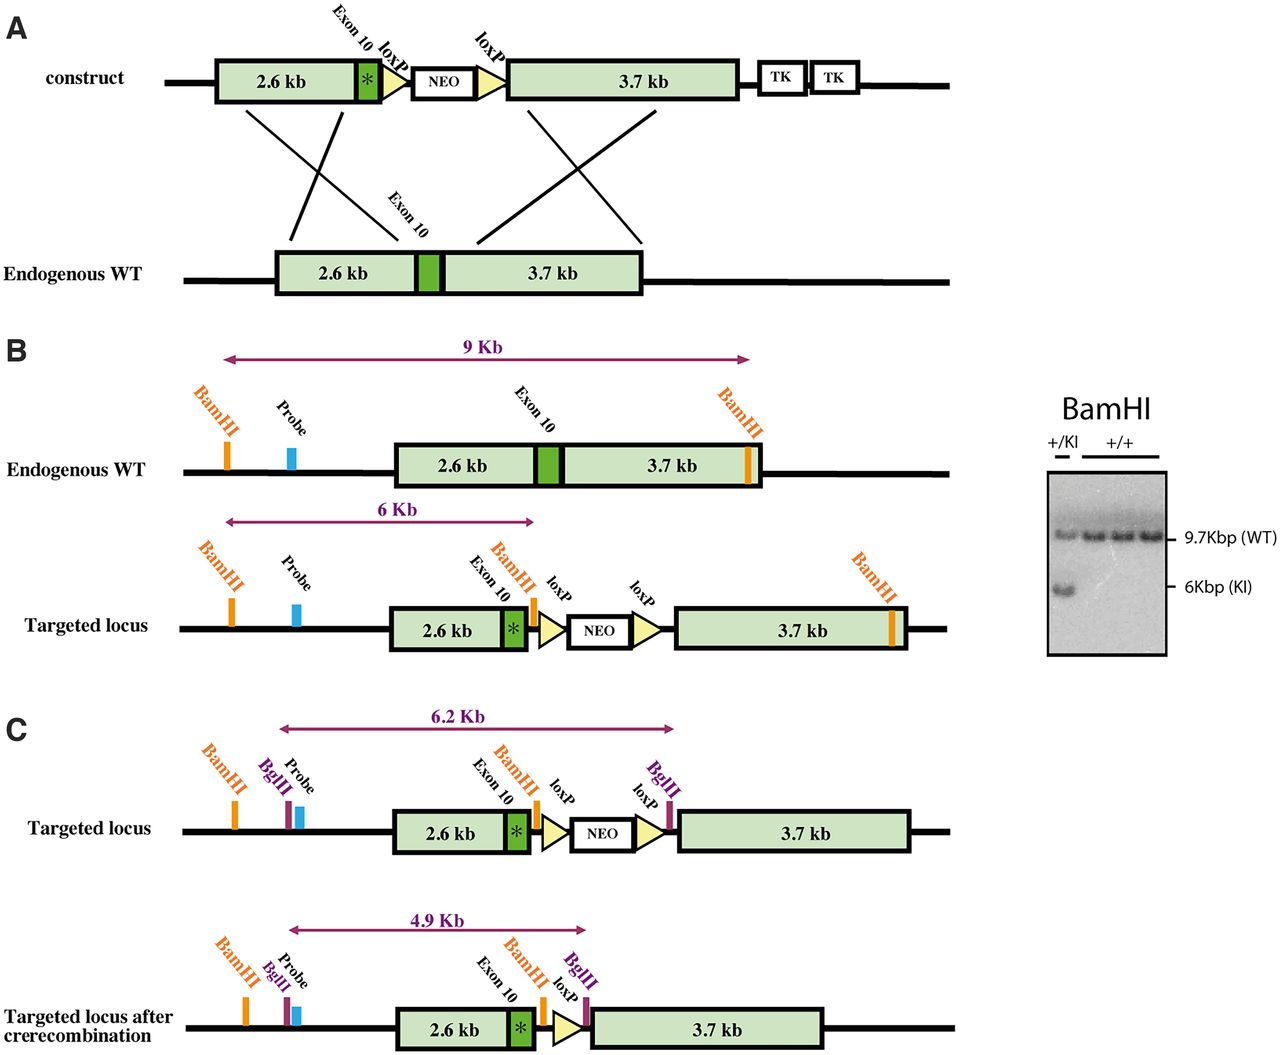
- Figure 1.
Generation of the MaptP290S KI mice. A, Outline of the targeting strategy for introducing the murine equivalent of the P301S mutation (P290S) into exon 10 of the murine Mapt gene. B, Screening strategy for selection of positive ES clones. Southern blot analysis of BamHI-digested genomic DNA. C, Removal of the Neo positive selection marker by crossing the line with Stella-Cre transgenic line. *Indicates the P290S mutation.
- Figure 2.
Immunoblot analysis and immuno-EM of Sarkosyl-insoluble brain extracts. A, Quantitation and representative immunoblots of T49 and 22C11 expression in total homogenates from brains of 3-, 6-, 12-, and 18-month-old AppNL-G-F, MaptP290S, and AppNL-G-FxMaptP290S KI mice. At 3 and 12 months, n = 3 (2 M, 1 F). At 6 and 18 months, n = 3 (1 M, 2 F). B, Representative immunoblots of Sarkosyl-insoluble tau from the brains of 6-, 12-, 18-, and 24-month-old AppNL-G-F, MaptP290S, and AppNL-G-FxMaptP290S KI mice using antibodies T49, AT8, AT100, pS422, BR133, and BR134. At 3 and 12 months, n = 3 (2 M, 1 F). At 6 and 18 months, n = 3 (1 M, 2F). C, Immunoelectron microscopy of Sarkosyl-insoluble filaments of an 18-month-old AppNL-G-FxMaptP290S KI mouse brain.
- Figure 3.
Characterization of brain tau pathology by immunohistochemistry and Gallyas-Braak silver staining. A, AT8 (top) and AT100 (bottom) immunoreactivity in MaptP290S KI and AppNL-G-FxMaptP290S KI mice at 24 months of age. AT8- or AT100-immunoreactive cells were quantified at 3, 6, 12, 18, and 22–24 months in 50 μm whole-brain coronal sections. Results shown are the mean ± SEM. Significance between genotypes and adjacent time-points within a genotype is reported for two-way ANOVA with Tukey’s post hoc analysis (*p < 0.05, **p < 0.01, ****p < 0.0001). Quantitation values of AT8 staining in MaptP290S KI mice were as follows: 3 months, n = 6 (3 M, 3 F); 6 months, n = 6 (3 M, 3 F); 12 months, n = 8 (4 M, 4 F), 18 months, n = 8 (4 M, 4 F); and 22–24 months, n = 6 (3 M, 3 F). Values in AppNL-G-FxMaptP290S KI mice were as follows: 3 months, n = 6 (3 M, 3 F); 6 months, n = 8 (4 M, 4 F); 12 months, n = 8 (4 M, 4 F); 18 months, n = 8 (4 M, 4 F); 22–24 months, n = 4 (2 M, 2F). Brain sections from 4 (2 M, 2 F) 18-month-old AppNL-G-FxMaptP290S KI mice were not available at the time of AT100 staining. B, Representative images of Gallyas-Braak silver staining at 24 months of age in MaptP290S and AppNL-G-FxMaptP290S KI mice. C, Timeline depicting the appearance of cells labeled with Gallyas-Braak silver stain in MaptP290S KI and AppNL-G-FxMaptP290S KI mice. Values were as follows: at 3 and 6 months, n = 3 (2 M, 1 F); at 12 and 18 months, n = 8 (4 M, 4 F); at 22–24 months, n = 4 (2 M, 2 F). D, In situ electron microscopy of Gallyas-Braak silver-stained brain sections from 24-month-old AppNL-G-FxMaptP290S KI mouse showing labeled filamentous content of a tau inclusion (i) within the cell body of a neuron, adjacent to a nucleus (n).
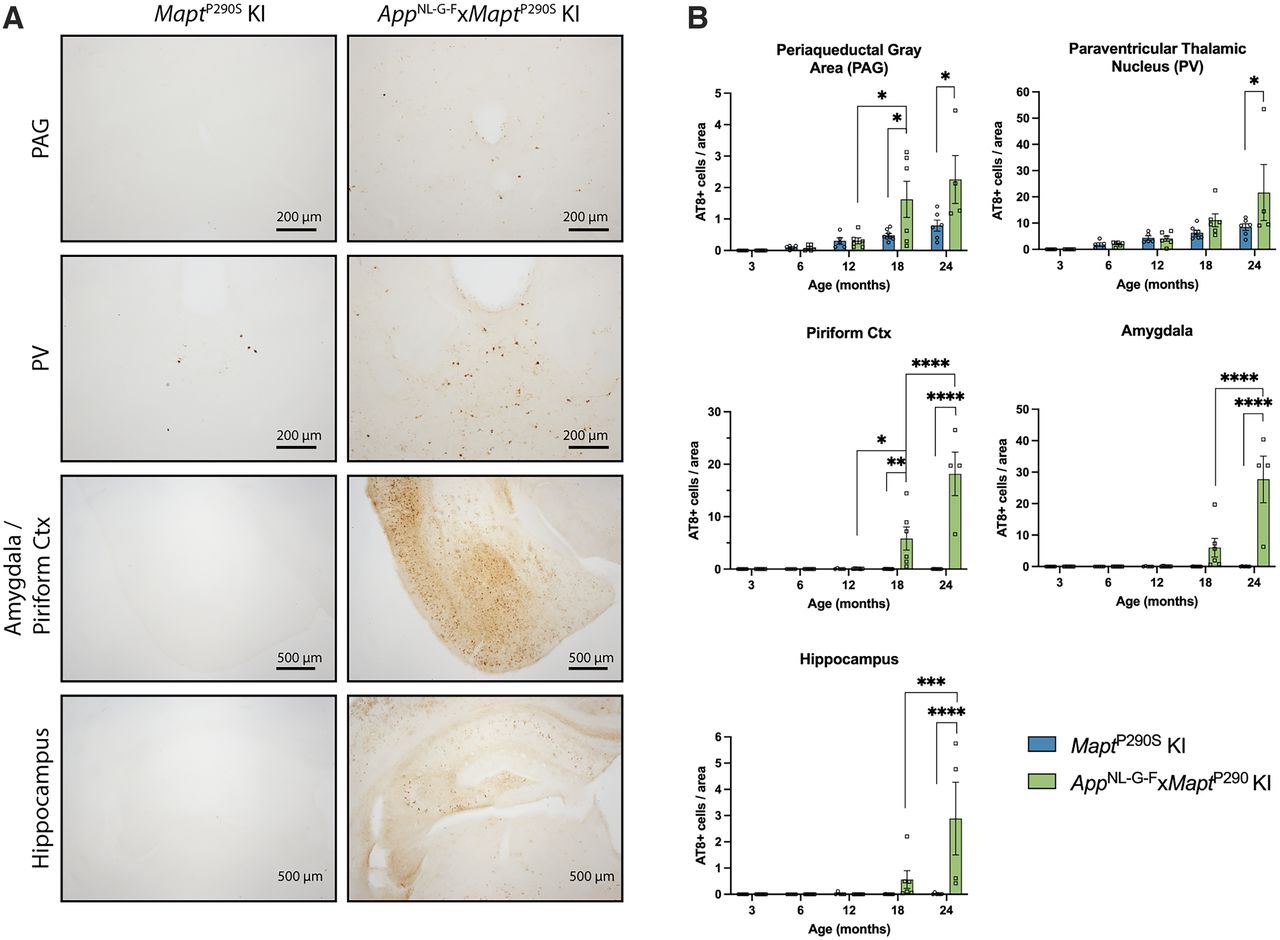
- Figure 4.
Regional quantitation of AT8-immunoreactive tau pathology. A, AT8 immunoreactivity in PAG, PV, amygdala, piriform cortex, and hippocampus of 24-month-old MaptP290S KI (left) and AppNL-G-FxMaptP290S KI (right) mice. B, Regional quantification of AT8-immunoreactive cells at 3, 6, 12, 18, and 22–24 months. Results shown are the mean ± SEM. Significance between genotypes and adjacent time-points within a genotype are reported for two-way ANOVA with Tukey’s post hoc analysis. *p < 0.05, **p < 0.01, ***p < 0.001, ****p < 0.0001. At 3, 6, 12, and 18 months, n = 6 (3 M, 3 F); at 22–24 months, n = 4 (2 M, 2 F).
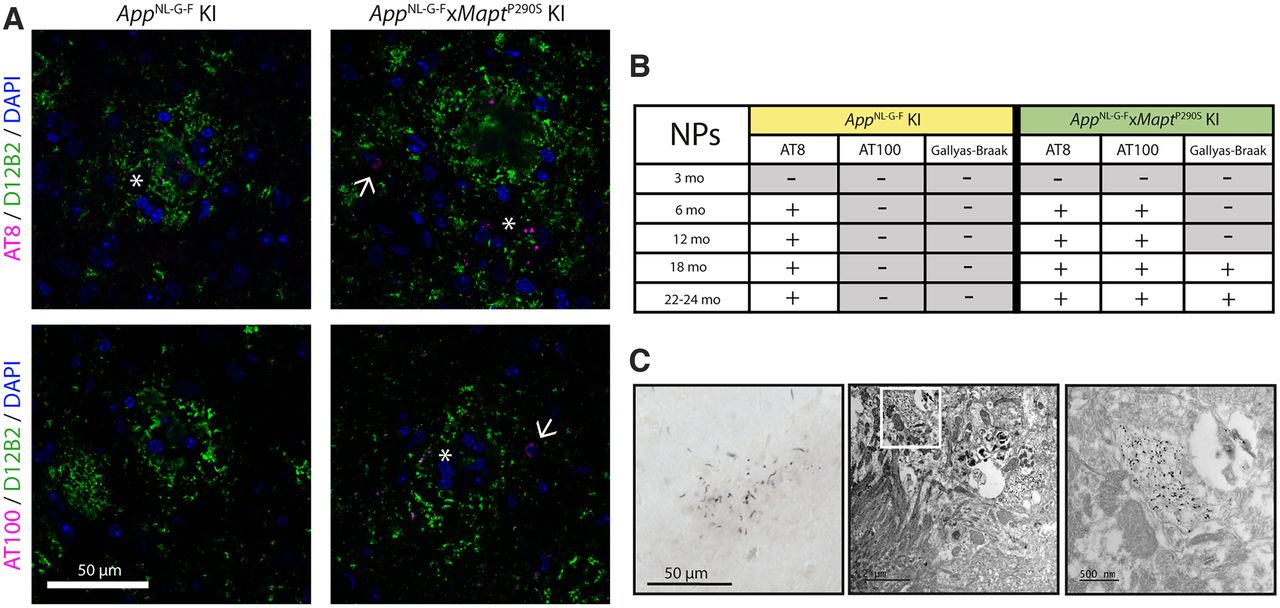
- Figure 5.
Neuritic plaques in MaptP290S and AppNL-G-FxMaptP290S KI mice. A, Immunofluorescence staining of tau (AT8 and AT100) and Aβ (D12B2) in 18-month-old AppNL-G-F and AppNL-G-FxMaptP290S KI mouse brains. AppNL-G-F brains contain neuritic plaques (asterisk) that are positive for AT8, but not for AT100. AppNL-G-FxMaptP290S KI KI brains contain neuritic plaques and tau inclusions (arrow) that are positive for both AT8 and AT100. B, Timeline of the appearance of neuritic plaque labeled with AT8, AT100, and Gallyas-Braak silver staining in AppNL-G-Fand AppNL-G-FxMaptP290S KI lines. Values are as follows: at 3 and 6 months, n = 3 (2 M, 1 F); at 12 and 18 months, n = 8 (4 M, 4 F); at 22–24 months, n = 4 (2 M, 2 F). C, Gallyas-Braak-labeled neuritic plaque in the piriform cortex of an AppNL-G-FxMaptP290S KI mouse at 24 months of age, visualized by light microscopy and in situ electron microscopy.
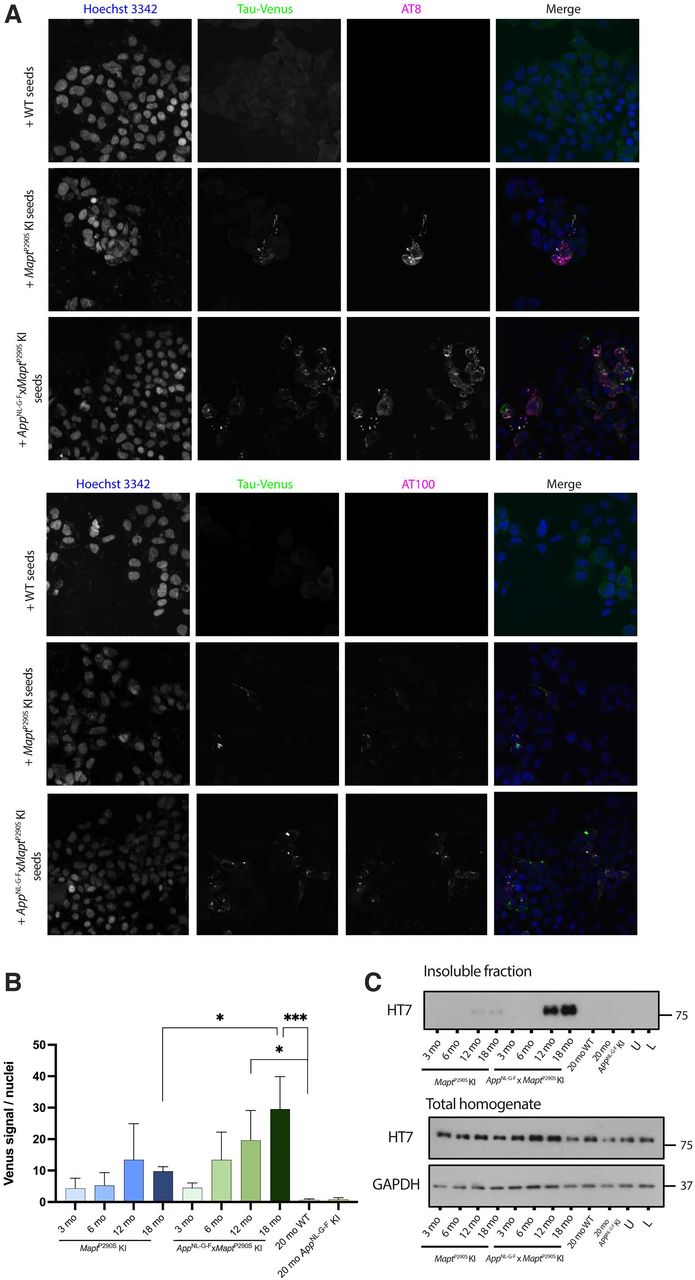
- Figure 6.
Tau assemblies extracted from brains of MaptP290S and AppNL-G-FxMaptP290S KI mice induce aggregation of P301S tau expressed in HEK293 cells. A, Representative images of HEK293 P301S tau-venus cells seeded with 18-month-old MaptP290S and AppNL-G-FxMaptP290S Sarkosyl-insoluble tau assemblies labeled with AT8 and AT100. B, Quantitation of tau-venus signal per nucleus seeded with assemblies from 3-, 6-, 12-, and 18-month-old MaptP290S and AppNL-G-FxMaptP290S and 20-month-old wild-type and AppNL-G-F controls (n = 3). C, Representative immunoblots of total homogenates and Sarkosyl-insoluble extracts from seeded cells using human-tau antibody HT7 (n = 3).
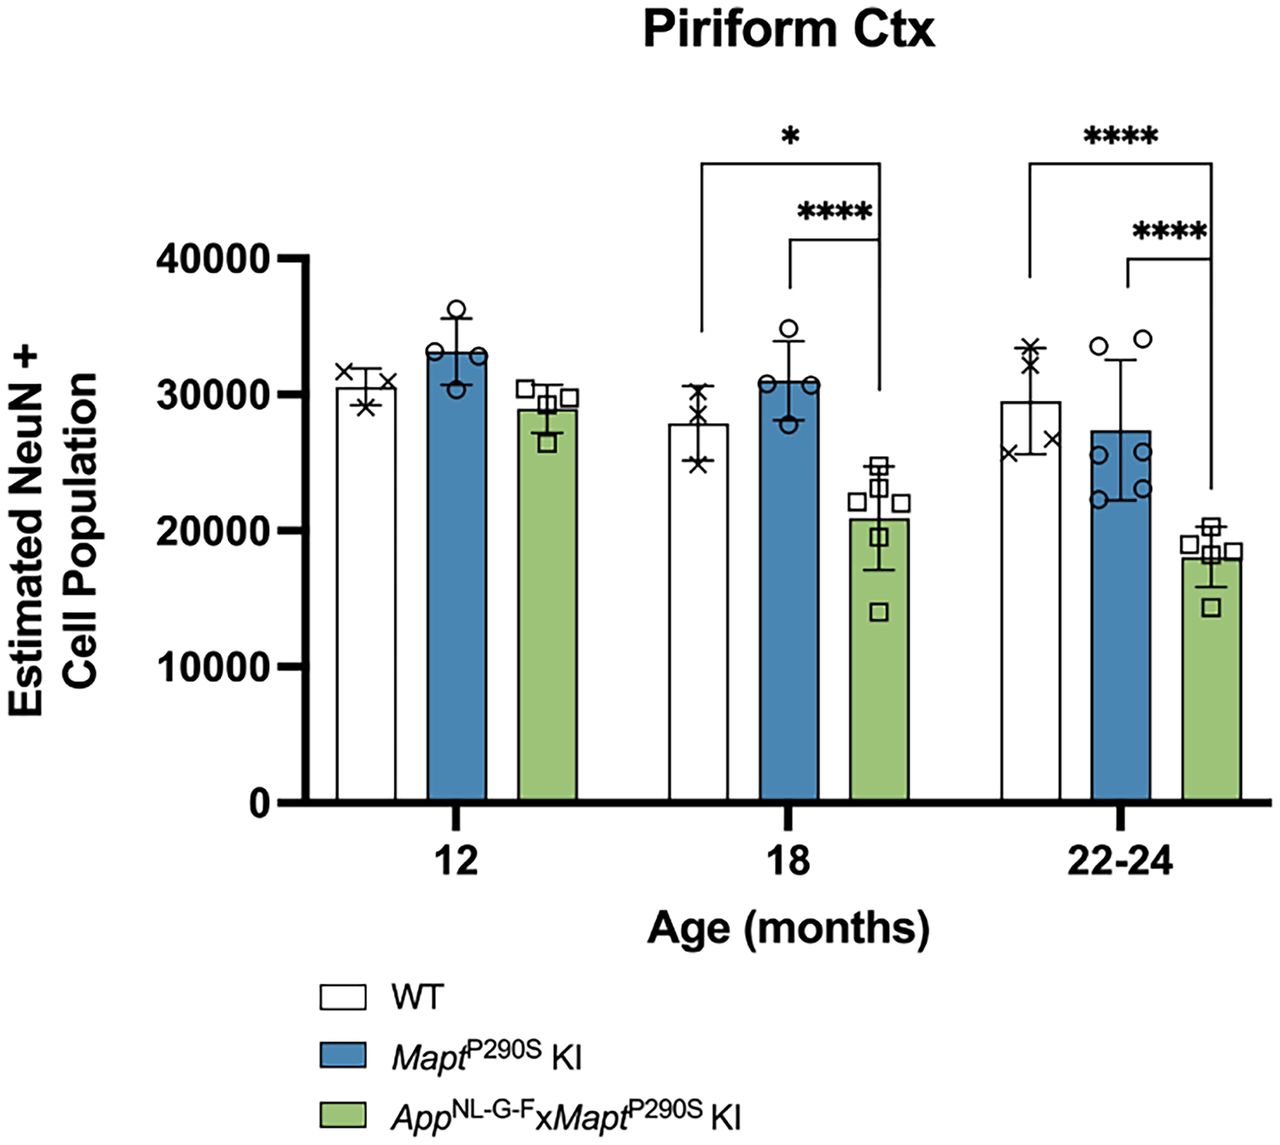
- Figure 7.
Age-dependent neurodegeneration in AppNL-G-FxMaptP290S KI mice. Quantitation of NeuN-positive cells in piriform cortex of wild-type, MaptP290S KI, and AppNL-G-FxMaptP290S KI mice at 12, 18, and 22–24 months of age. Results shown are the mean ± SEM. *p < 0.05, ****p < 0.0001 for two-way ANOVA with Tukey’s post hoc analysis. For wild-type mice at all ages, n = 3 (M); for MaptP290S KI mice at 12 and 18 months, n = 4 (2 M, 2 F); at 22–24 months, n = 6 (3 M, 3 F); for AppNL-G-FxMaptP290S KI at 12 and 18 months, n = 4 (2 M, 2 F); at 22–24 months n = 5 (2 M, 3 F).


In this issue


