

Article Figures & Data
Figures
- Figure 1.
Shank3-KO animals initially consume fewer crickets than wild-type littermates and improve at hunting more slowly. A, Schematic of recording setup for hunting sessions. Camera records behavior of mouse and cricket in a given session. B, Experiment timeline whereby animals are habituated for 2 d in advance of hunting in littermate pairs. Food deprivation happens overnight the second night before beginning hunting. C, Representative traces of mouse and cricket position during hunting trials by naive and experienced animals, in which the black trace corresponds to cricket position and the colored line corresponds to the mouse position. D, Number of live crickets captured per session. Stats for WT versus KO, Number of crickets captured per day, day 1 p = 0.042, day 2 p = 0.052, day 3 p = 0.142 (Wilcoxon). Open dots are individual observations, filled dots represent averages across multiple sessions, and error bars represent SE. E, Fraction of cricket trials concluding in successful capture per session. Stats for WT versus KO, Capture probability, day 1 p = 0.046, day 2 p = 0.137, day 3 p = 0.588 (Wilcoxon). F, Number of dead crickets consumed by naive mice in a single control set, p = 0.079 (Wilcoxon). Without training, Shank3 KO mice consume fewer dead crickets than wild-type mice, suggesting there is a Shank3 KO deficit in recognizing the crickets as food or a willingness or ability to eat them. G, Mass of sugary cereal consumed in a single control session by naive mice, p = 0.062 (t test). H, Median mouse distance traveled per hunting session, across multiple live cricket trials, day 1 p = 0.145, day 2 p = 0.156, day 3 p = 0.168, day 4 p = 0.205, day 5 p = 0.016 (t test). After training, wild-type mice traveled less distance to capture crickets compared with Shank3 KO mice. I, Median time to capture per hunting session, across multiple live cricket trials. Maximum time was plotted as 10,000 s in the case that animals did not capture any crickets during their allotted 3 h. Stats for WT versus KO, Time to capture, by session, day 1 p = 0.023, day 2 p = 0.055, day 3 p = 0.127, day 4 p = 0.216, day 5 p = 0.042. After training, wild-type mice were slightly faster than Shank3 KO mice. J, Time for naive mice to capture a dead cricket in a single control set, median by session p = 0.035 (t test). Shank3 KO mice took substantially longer time to eat dead crickets than wild-type mice, even when the crickets were not moving. D, E, H, I, WT males N: 4; WT females N: 4; KO males N: 7; KO females N: 3; total: 18. F, G, J, WT males N: 7; WT females N: 3; KO males N: 5; KO females N: 3; total: 18.
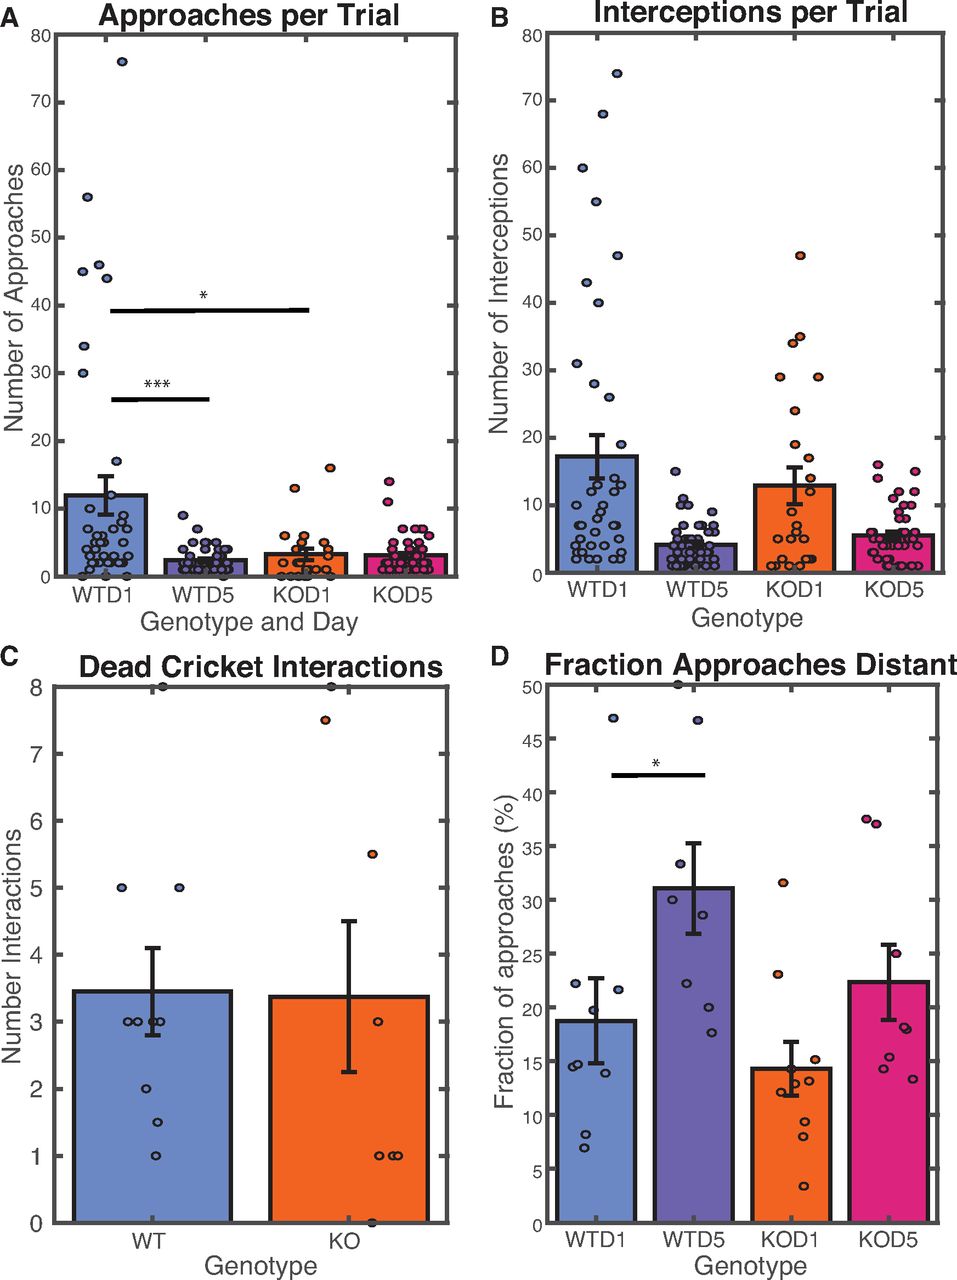
- Figure 2.
Both wild-type and Shank3 KO animals gain some proficiency at cricket hunting and reduce overall number of interceptions per trial. A, Number of approaches before cricket capture, per trial, during hunting. All stats calculated using a repeated measures ANOVA WTD1-KOD1 p = 0.022, WTD5-KOD5 p = 0.131, WTD1-WTD5 p = 6.088e-05, KOD1-KOD5 p = 0.966. B, Number of interceptions before cricket capture, during hunting, per trial. WTD1-KOD1 p = 0.352, WTD5-KOD5 p = 0.365, WTD1, KOD1-KOD5 p = 0.023. C, Number of interceptions per dead cricket by naive mice in a single control set, median by session p = 0.953 (t test). D, Fraction of approaches for which the mouse to cricket distance exceeded 15 cm at start of approach during hunting, median per day. WTD1-KOD1 p = 0.423, WTD5-KOD5 p = 0.134, WTD1-WTD5 p = 0.019, KOD1-KOD5 p = 0.113. A, B, D, WT males N: 4; WT females N: 4; KO males N: 7; KO females N: 3; total: 18. C, WT males N: 7; WT females N: 3; KO males N: 5; KO females N: 3; total: 18.
- Figure 3.
Shank3 KO mice exhibit more frequent periods of immobility than wild-type mice. A, Fraction of time immobile during approach per hunting session, averaged over all approaches. Bars show average value, and error bars indicate SE. Both genotypes spent less time immobile with training, but Shank3 KO animals continued to exhibit substantial time immobile after training whereas wild-type animals exhibited very little time immobile during approaches. Calculated using repeated measure ANOVA, WTD1-KOD1 p = 0.079, WTD5-KOD5 p = 0.034, WTD1-WTD5 p = 0.161, KOD1-KOD5 p = 0.009. B, Mean distance traveled between periods of immobility during hunting. Wild-type animals traveled farther than Shank3 KO animals before pausing. Bars show average value and error bars indicate SE. Calculated using repeated measure ANOVA, WTD1-KOD1 p = 0.959, WTD5-KOD5 p = 0.189, WTD1-WTD5 p = 0.028, KOD1-KOD5 p = 0.443. C, Average fraction of time immobile in the absence of appetitive stimulus, by session. Time immobile calculated using two-sample t test, p = 0.003. Shank3 KO mice spent more time immobile when no cricket was present. A, B, WT males N: 4; WT females N: 4; KO males N: 7; KO females N: 3; total: 18. C, WT males N: 7; WT females N: 3; KO males N: 5; KO females N: 3; total: 18.
- Figure 4.
Shank3 KO animals exhibited similar average speeds as wild-type animals during hunting approaches but were slower to close in on crickets and exhibited less modulation of their speed immediately before interceptions. A, 95th percentile speed in the absence of appetitive stimulus, by session. 95th percentile speed p = 2.78e-4. Baseline speed was slower in Shank3 KO animals. B, Average speed during approach, median over approaches during a trial. Wild-type and Shank3 KO mice did not differ in average speed during approaches. Statistics generated through a repeated measures ANOVA: WTD1-KOD1 p = 0.459, WTD5-KOD5 p = 0.962, WTD1-WTD5 p = 5.023e-04, KOD1-KOD5 p = 6.477e-04. C, D, Representative traces of the distance between mouse nose and cricket (mouse to cricket distance, x) during the course of one approach, for both wild-type (C) and Shank3-KO (D) mice after training. Vertical arrows indicate interceptions. E, Derivative of mouse to cricket distance with respect to time, moving average over 1 s, for traces shown in C and D. F, Mean derivative of MCD with respect to time averaged over each approach period. Error bars indicate SD. Calculated using two-sample t test, WTD1-KOD1 p = 0.048, WTD5-KOD5 p = 0.026, WTD1-WTD5 p = 2.29e-4, KOD1-KOD5 p = 0.023. Experienced wild-type mice exhibited lower values than experienced Shank3 KO mice, indicating that wild-type animals closed the distance gap to the cricket more efficiently. Data from individual animals is shown in Extended Data Figure 4-1. G, H, Mouse body speed 1 s before and after interception, averaged over all interceptions for a given genotype for both naive (G) and experienced (H) mice. Shaded region indicates SE. Asterisks indicate frames for which p < 0.05 as calculated using a two-sample t test. Wild-type mice began to ramp up their speed ∼500 ms before intercepting a cricket, while Shank3 KO mice did not greatly increase their speed until ∼200 ms before intercepting a cricket. WT males N: 4; WT females N: 4; KO males N: 7; KO females N: 3; total: 18.


Movies
- Movie 1.
A representative wild type mouse with 5 days of cricket hunting experience pursues a cricket. Top) Video of mouse, cricket, and apparatus, with DeepLabCut landmarks visible on the mouse. Bottom) Proximity / Mouse-Cricket-Distance (blue) and the azimuth between the mouse’s head and the cricket (red). Time 0 indicates the start of the approach. In this video, the cricket escapes many times, but the mouse rapidly closes the distance for many capture attempts.
- Movie 2.
A representative Shank3 KO mouse with 5 days of cricket hunting experience pursues a cricket. Top) Video of mouse, cricket, and apparatus, with DeepLabCut landmarks visible on the mouse. Bottom) Proximity / Mouse-Cricket-Distance (blue) and the azimuth between the mouse's head and the cricket (red). Time 0 indicates the start of the approach. In this video, the mouse pauses each time the cricket escapes, and does not move as quickly in its final capture attempts as the wild type mouse.
Extended Data Figure 4-1
Mean approach velocity plotted by individual animals. The median dMCD/dt was determined by taking the median value of the dMCD/dt over all approaches for each individual animal. The means were then analyzed by ANOVA. Experienced (day 5) wild-type animals exhibited significantly lower mean dMCD/dt than Shank3 KO animals on day 1 (Tukey’s post hoc test, p < 0.0073), but other comparisons did not show significant differences. Download Figure 4-1, EPS file.
In this issue


