

Article Figures & Data
Figures
- Figure 1.
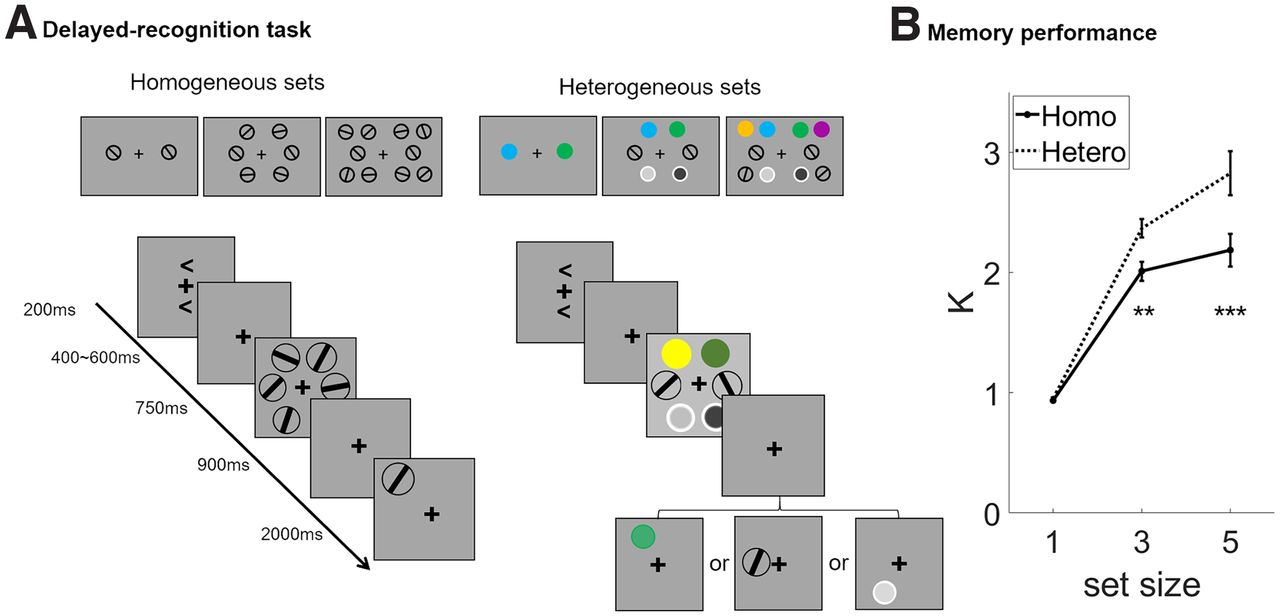
Experiment 1: methods and behavioral results. A, The stimuli and experimental procedure of the delayed-recognition task. Top row illustrates sample displays for load of –1, −3, and −5 trials, for homogeneous (left column) and heterogeneous (right column) conditions. Bottom row illustrates trial timing; each of the four recognition probes illustrated here would require a “nonmatch” response. B, The memory capacity estimates for orientations in the delayed-recognition task. Asterisks indicate a significant difference between homogeneous and heterogeneous memory conditions in the level of **p < 0.01 and ***p < 0.001. Homo, Homogeneous; Hetero, heterogeneous.
- Figure 2.
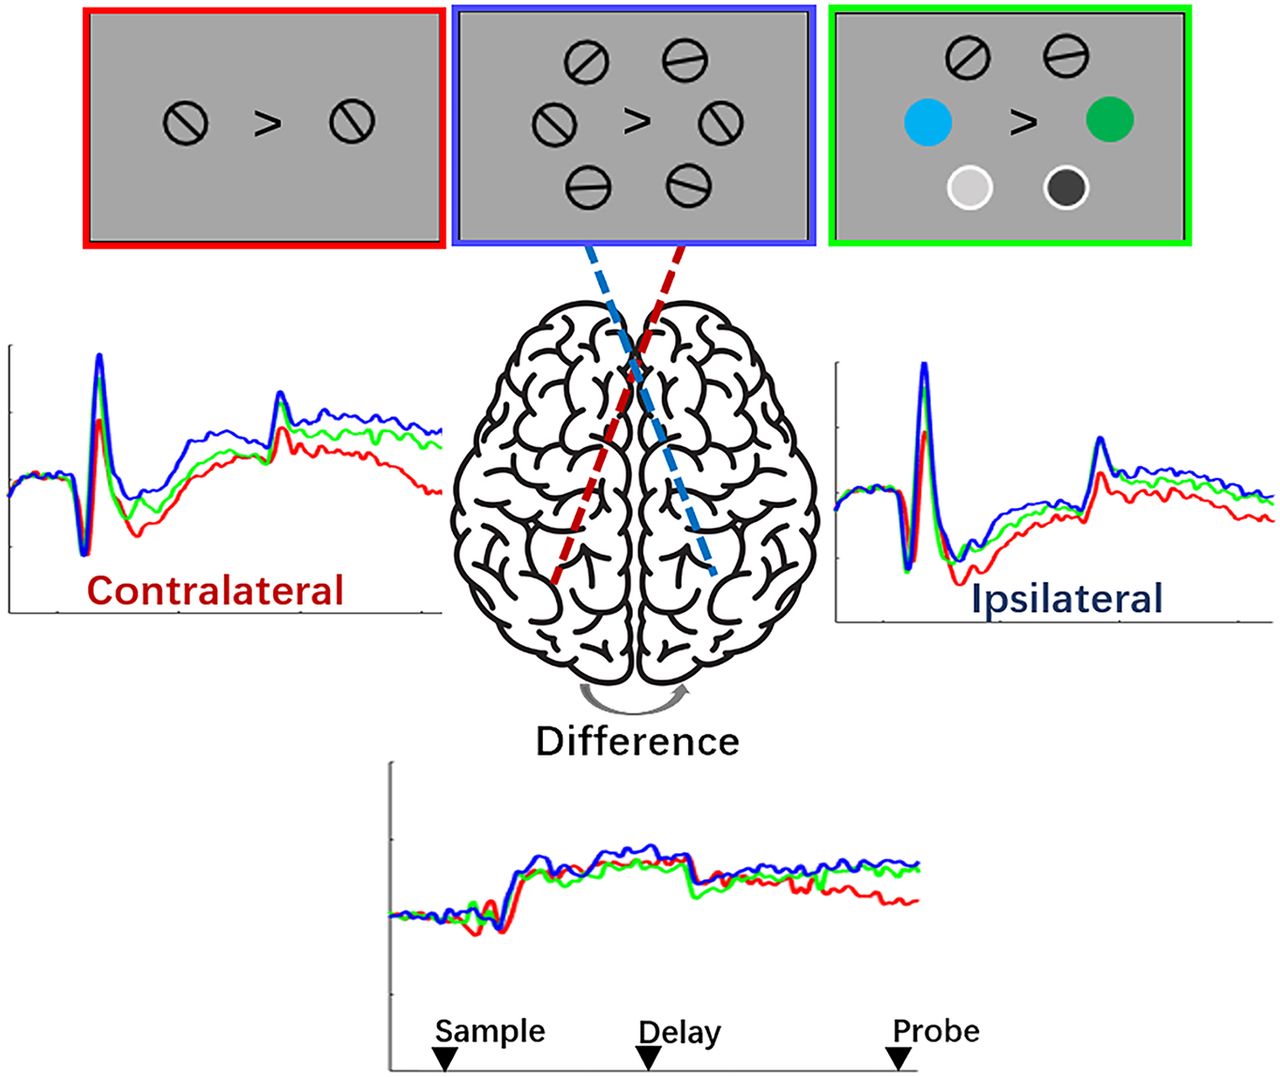
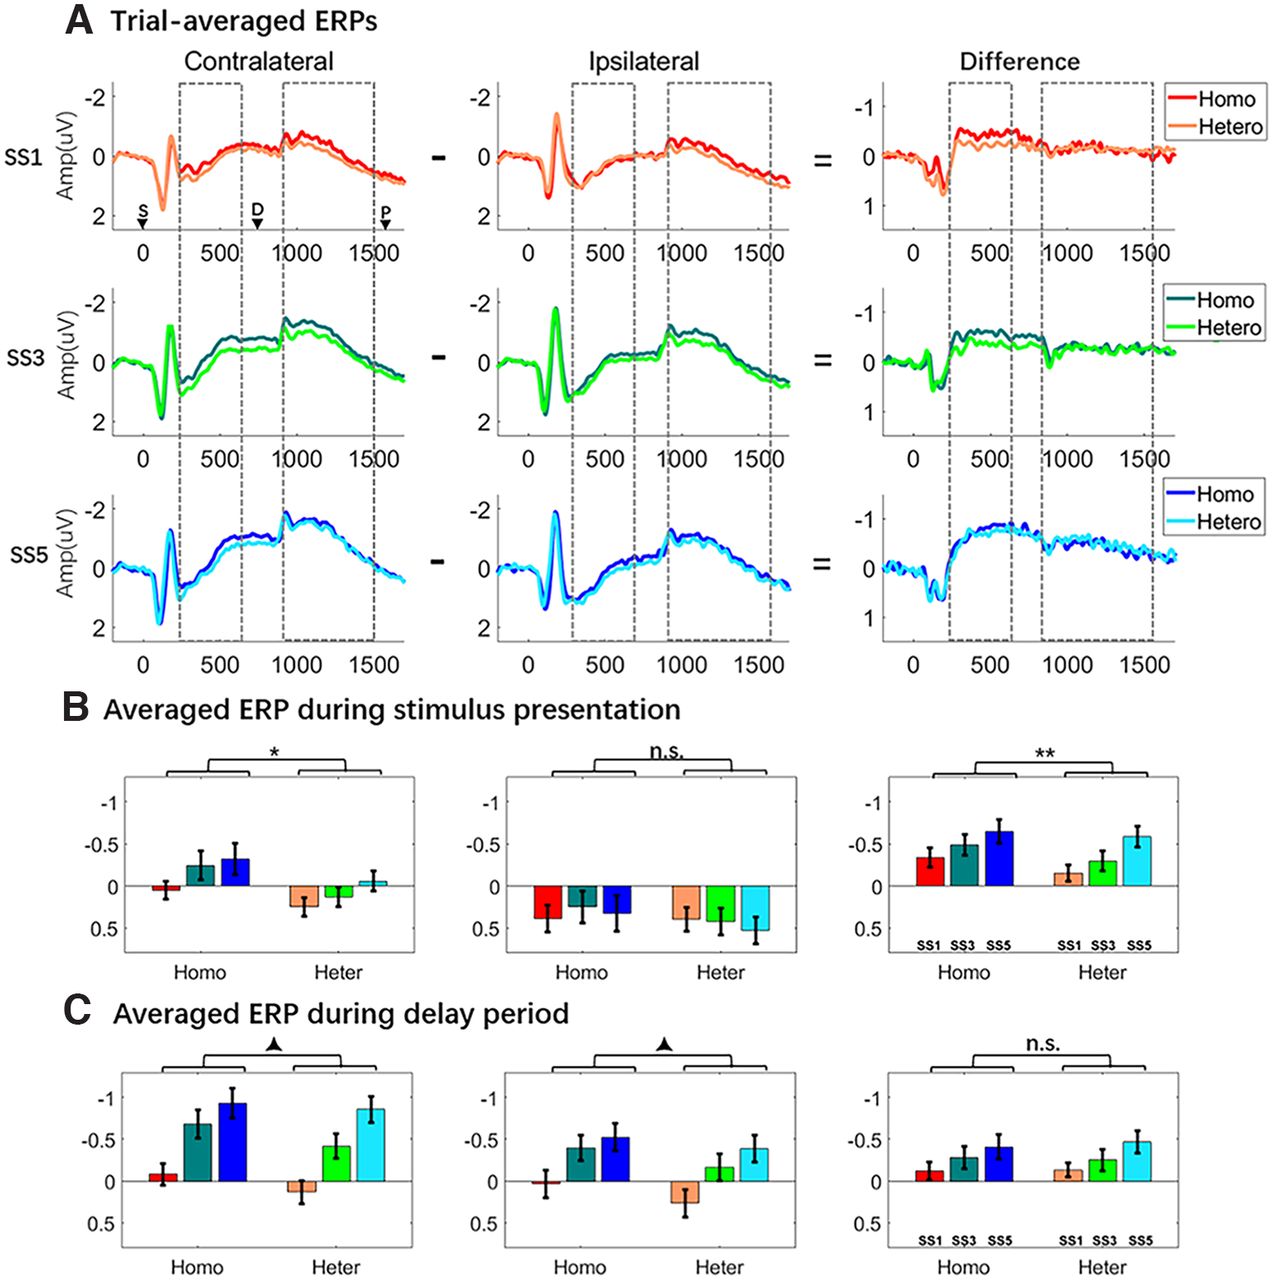
ERP waves and averages from experiment 1: delayed recognition. A, Contralateral and ipsilateral ERPs, and contralateral – ipsilateral difference waves. Dashed-line boxes indicate the time across which stimulus-presentation and delay-period signals were averaged. The inverted triangles labeled by “S,” “D,” and “P” indicate the onset of sample, delay, and probe periods, respectively. B, C, Averaged stimulus-presentation and delay-period ERP amplitudes, and difference waves. Asterisks and triangles indicate the outcomes of statistical comparisons: corresponding to *p < 0.05, **p < 0.01, and ***p < 0.00, respectively; and () corresponding to 0.05 < p < 0.1. Homo, Homogeneous; Hetero/Heter, heterogeneous.
- Figure 3.
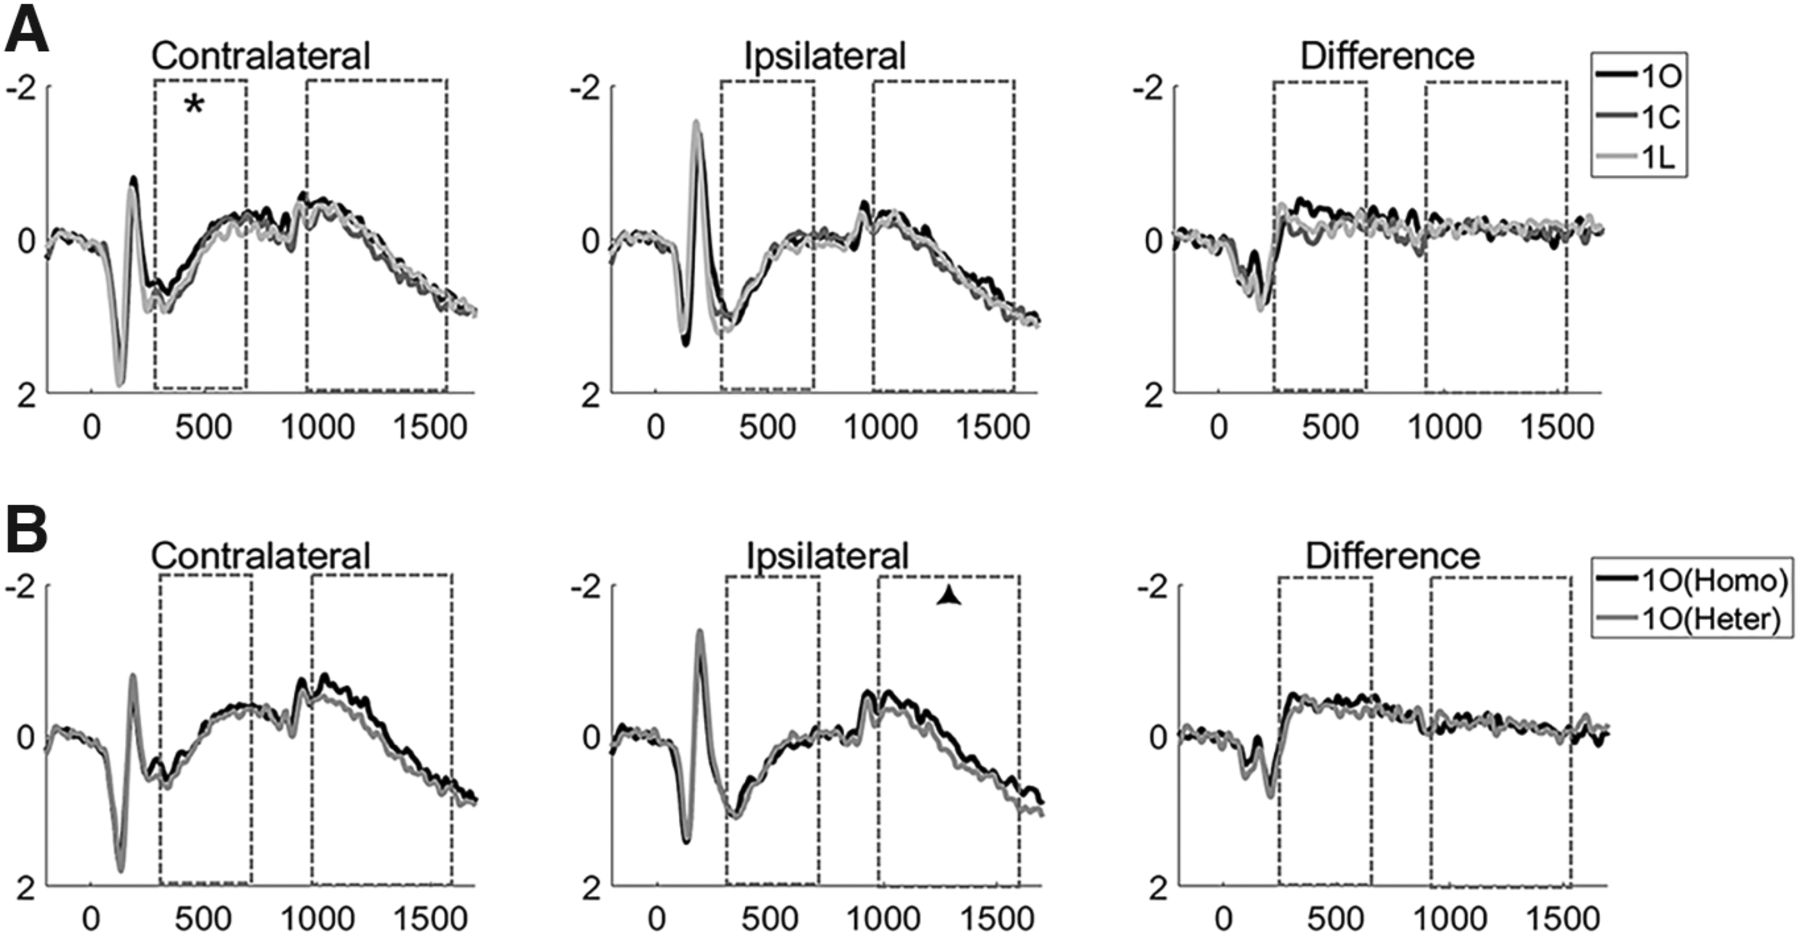
One-item trials from experiment 1. A, Contralateral, ipsilateral, and contra-minus-ipsi difference waves for 1O, 1C, and 1L trials, from experiment 1. B, Contralateral, ipsilateral, and contra-minus-ipsi difference waves for 1O trials in homogeneous (Homo) and heterogeneous (Heter) blocks. Dashed-line boxes indicate the time across which encoding-period and delay-period signals were averaged. Results from statistical comparisons are denoted with asterisks (*p < 0.05) and triangles (0.05 < p < 0.1).
- Figure 4.
Experiment 2: methods and behavioral results. A, The stimuli and experimental procedure for the delayed-recall task. Top row, Sample display for 1O, 3O, and 1O1C1L trials. Bottom row, Trial timing. B, Behavioral results: recall error distance (left) and response time (right). C, Behavioral results fit with mixture model: memory precision (ĸ; left) and pT (right). D, Behavioral results fit with TCC model: d′. Asterisks (*, ** and ***) and triangles () indicate the differences between comparisons in *p < 0.05, **p < 0.01, ***p < 0.001, and 0.05 < p < 0.1, respectively.
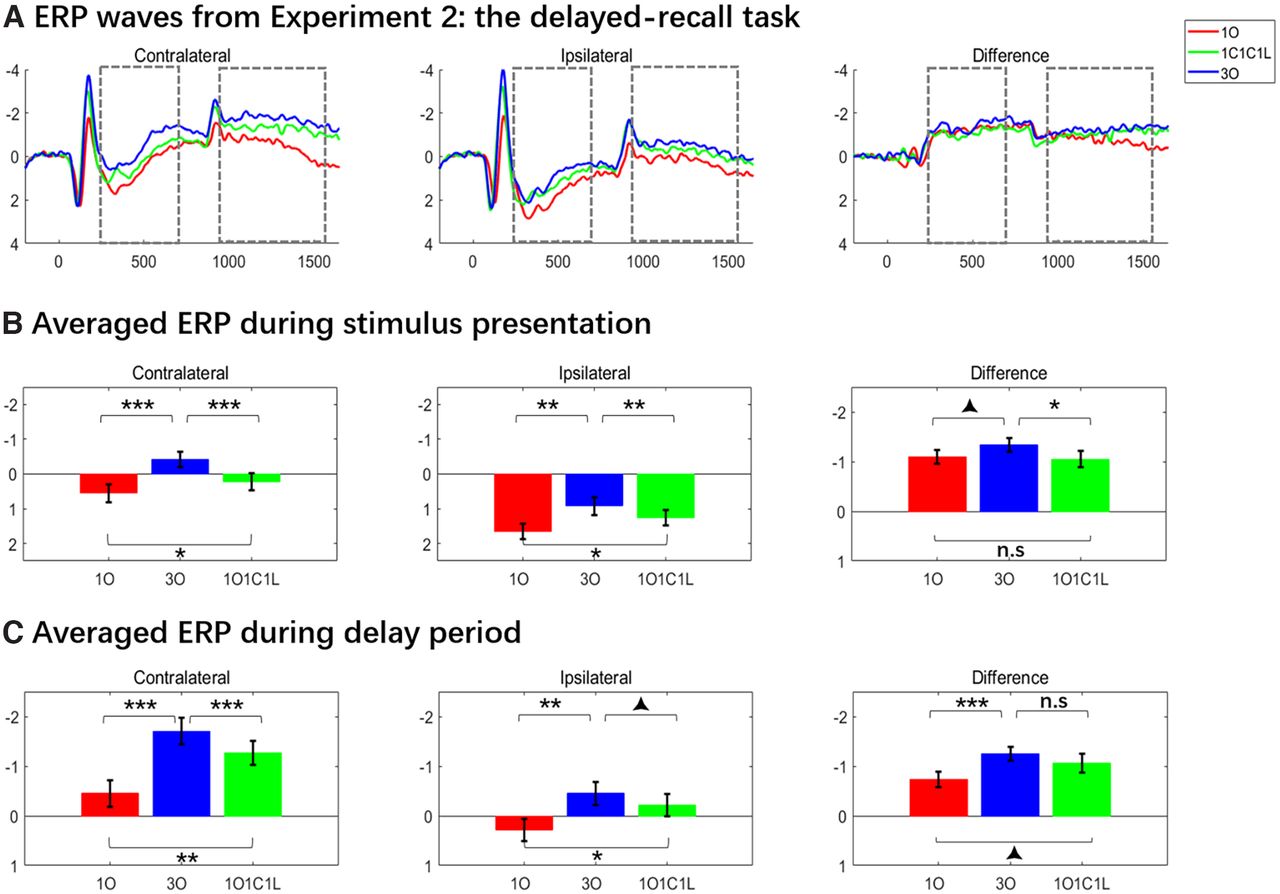
- Figure 5.
ERP waves and averages from experiment 2: delayed-recall. A, Contralateral and ipsilateral ERPs, and their difference waves; for 1O, 1O1C1L and 3O trials. B, C, Averaged stimulus-presentation and delay-period voltages derived from the data in A. Dashed-line boxes indicate the time across which stimulus-presentation and delay-period signals were averaged. Results from statistical comparisons are denoted with asterisks and triangles indicate statistical differences between conditions at *p < 0.05, **p < 0.01, ***p < 0.001, and 0.05 < p < 0.1 level, respectively.
- Figure 6.
One-item trials from experiment 2. A, The ERP for 1O, 1C, and 1L trials. B, C, Averaged stimulus-presentation and delay-period voltages derived from the data in A. Dashed-line boxes indicate the time across which the delay-period signals were averaged, and asterisks and triangles indicate statistical differences between conditions at *p < 0.05, **p < 0.01, ***p < 0.001, and 0.05 < p < 0.1 level, respectively.


In this issue


