
Main menu

  • HOME
  • CONTENT
    • Early Release
    • Featured
    • Current Issue
    • Issue Archive
    • Blog
    • Collections
    • Podcast
  • TOPICS
    • Cognition and Behavior
    • Development
    • Disorders of the Nervous System
    • History, Teaching and Public Awareness
    • Integrative Systems
    • Neuronal Excitability
    • Novel Tools and Methods
    • Sensory and Motor Systems
  • ALERTS
  • FOR AUTHORS
  • ABOUT
    • Overview
    • Editorial Board
    • For the Media
    • Privacy Policy
    • Contact Us
    • Feedback
  • SUBMIT

User menu

Search

  • Advanced search
eNeuro
eNeuro

Advanced Search


  • HOME
  • CONTENT
    • Early Release
    • Featured
    • Current Issue
    • Issue Archive
    • Blog
    • Collections
    • Podcast
  • TOPICS
    • Cognition and Behavior
    • Development
    • Disorders of the Nervous System
    • History, Teaching and Public Awareness
    • Integrative Systems
    • Neuronal Excitability
    • Novel Tools and Methods
    • Sensory and Motor Systems
  • ALERTS
  • FOR AUTHORS
  • ABOUT
    • Overview
    • Editorial Board
    • For the Media
    • Privacy Policy
    • Contact Us
    • Feedback
  • SUBMIT
PreviousNext
Research ArticleResearch Article: New Research, Disorders of the Nervous System

Cyclin-Dependent Kinase 5 Regulates cPLA2 Activity and Neuroinflammation in Parkinson’s Disease

Sangita Paul, Saman Fatihi, Srishti Sharma, Rintu Kutum, Raymond Fields, Harish C. Pant, Lipi Thukral and Binukumar BK
eNeuro 9 November 2022, 9 (6) ENEURO.0180-22.2022; https://doi.org/10.1523/ENEURO.0180-22.2022
Sangita Paul
1Council of Scientific and Industrial Research–Institute of Genomics and Integrative Biology, New Delhi 110007, India
2Academy of Scientific and Innovative Research (AcSIR), Ghaziabad 201002, India
  • Find this author on Google Scholar
  • Find this author on PubMed
  • Search for this author on this site
Saman Fatihi
1Council of Scientific and Industrial Research–Institute of Genomics and Integrative Biology, New Delhi 110007, India
2Academy of Scientific and Innovative Research (AcSIR), Ghaziabad 201002, India
  • Find this author on Google Scholar
  • Find this author on PubMed
  • Search for this author on this site
Srishti Sharma
1Council of Scientific and Industrial Research–Institute of Genomics and Integrative Biology, New Delhi 110007, India
2Academy of Scientific and Innovative Research (AcSIR), Ghaziabad 201002, India
  • Find this author on Google Scholar
  • Find this author on PubMed
  • Search for this author on this site
Rintu Kutum
1Council of Scientific and Industrial Research–Institute of Genomics and Integrative Biology, New Delhi 110007, India
  • Find this author on Google Scholar
  • Find this author on PubMed
  • Search for this author on this site
  • ORCID record for Rintu Kutum
Raymond Fields
3Viral Production Core Facility, National Institute of Neurological Disorders and Stroke, National Institutes of Health, Bethesda, Maryland 20892
  • Find this author on Google Scholar
  • Find this author on PubMed
  • Search for this author on this site
Harish C. Pant
4Neuronal Cytoskeletal Protein Regulation Section, National Institute of Neurological Disorders and Stroke, National Institutes of Health, Bethesda, Maryland 20892
  • Find this author on Google Scholar
  • Find this author on PubMed
  • Search for this author on this site
Lipi Thukral
1Council of Scientific and Industrial Research–Institute of Genomics and Integrative Biology, New Delhi 110007, India
2Academy of Scientific and Innovative Research (AcSIR), Ghaziabad 201002, India
  • Find this author on Google Scholar
  • Find this author on PubMed
  • Search for this author on this site
Binukumar BK
1Council of Scientific and Industrial Research–Institute of Genomics and Integrative Biology, New Delhi 110007, India
2Academy of Scientific and Innovative Research (AcSIR), Ghaziabad 201002, India
  • Find this author on Google Scholar
  • Find this author on PubMed
  • Search for this author on this site
  • Article
  • Figures & Data
  • Info & Metrics
  • eLetters
  • PDF
Loading

Article Figures & Data

Figures

  • Figure 1.
    • Download figure
    • Open in new tab
    • Download powerpoint
    Figure 1.

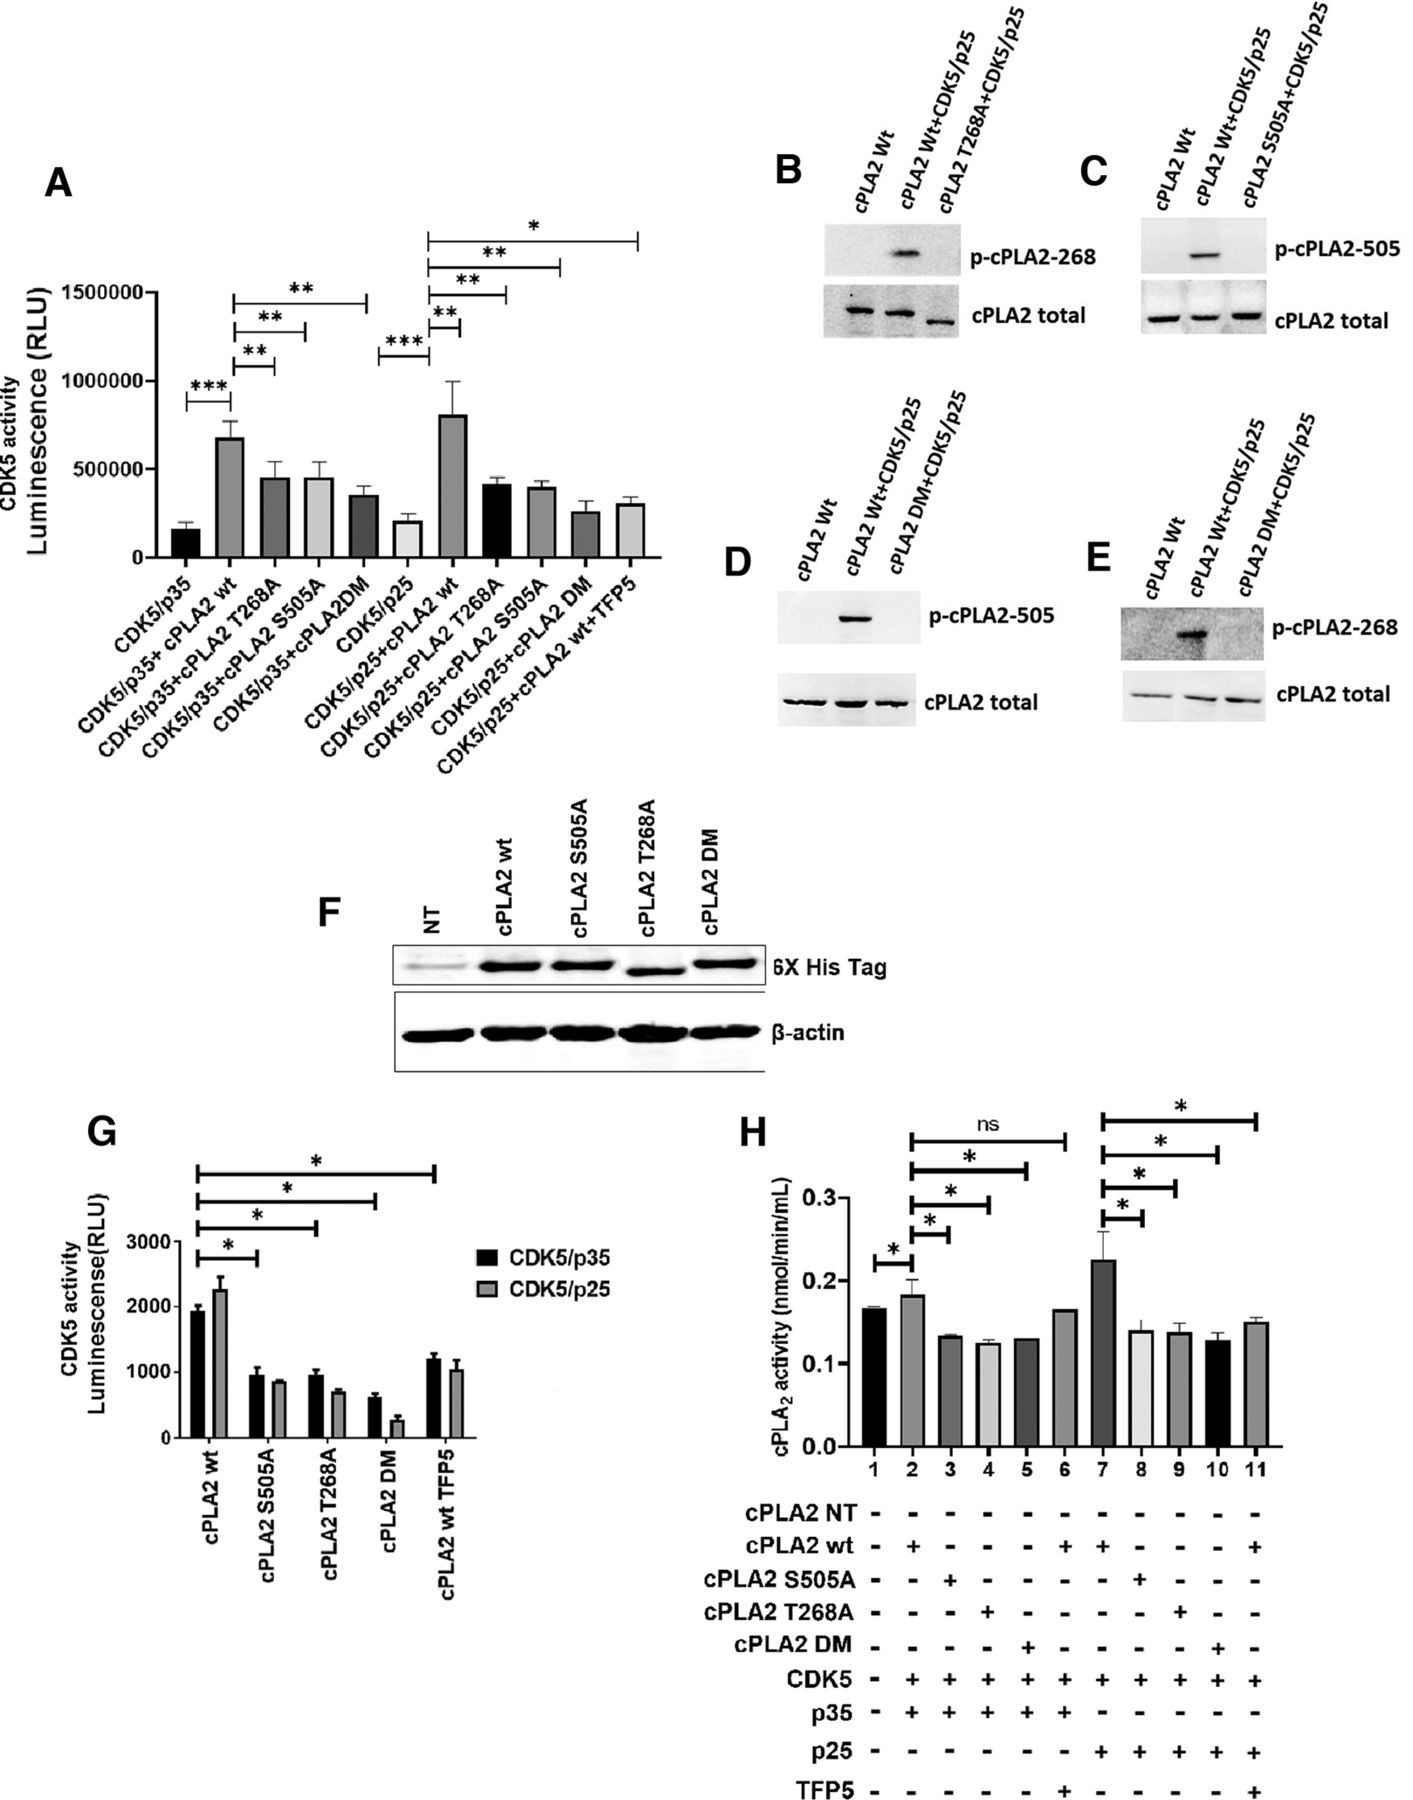
    cPLA2 phosphorylation by Cdk5. A, Cdk5 kinase assay with cPLA2 wt and its mutants along with TFP5 treatment in vitro by its pure proteins. B–E, Western blot images of phosphorylated cPLA2 (i.e., p-cPLA2 268 and p-cPLA2 505 expressions after Cdk5 kinase assay with cPLA2 wt and its mutants as substrate). Total cPLA2 was considered as standard. F, The Western blot image shows the expression of cPLA2 and its mutants post-transfection in HEK293T cells. G, Bar diagram showing Cdk5 kinase activity with cPLA2 wt and mutant protein as substrates of Cdk5 along with Cdk5 inhibitor TFP5. H, cPLA2 kinase activity. The bar graph shows cPLA2 activity of cPLA2 wt along with its three mutants S505A, T268A, and DM, also a comparative analysis of its mutants with the cPLA2 wt activity. Data are presented as the mean ± Standard error of mean (SEM), and analysis was performed using one-way ANOVA and Bonferroni’s test; n = 3. *p < 0.05, **p < 0.01, ***p < 0.001, not significant (ns).

  • Figure 2.
    • Download figure
    • Open in new tab
    • Download powerpoint
    Figure 2.

    Comparison of wild-type and mutant structural forms using MD simulations. A, Representative snapshots of MD simulations derived structure at the initial (0 ns) and last (1 μs) of wild and mutant systems. The protein structures are colored according to cPLA2 domain architecture, where C2 domain is highlighted in blue, linker in magenta, and catalytic domain (KD) in orange. B, Angular distribution between domains in wild and mutant systems during the last 150 ns of the trajectory. C, Secondary structure evolution of the catalytic domain residues (144–49) according to DSSP analysis in wild and mutant trajectories. D, Intramolecular network near the mutant sites for wild and double mutant systems at 1 μs. The size of the nodes represents the degree. The edges are represented as types of interaction, where hydrogen bonds are highlighted in blue, and contacts in gray. E, Snapshots highlighting these sites in ball and stick representation and surface hydrophobicity shown in blue and gold.

  • Figure 3.
    • Download figure
    • Open in new tab
    • Download powerpoint
    Figure 3.

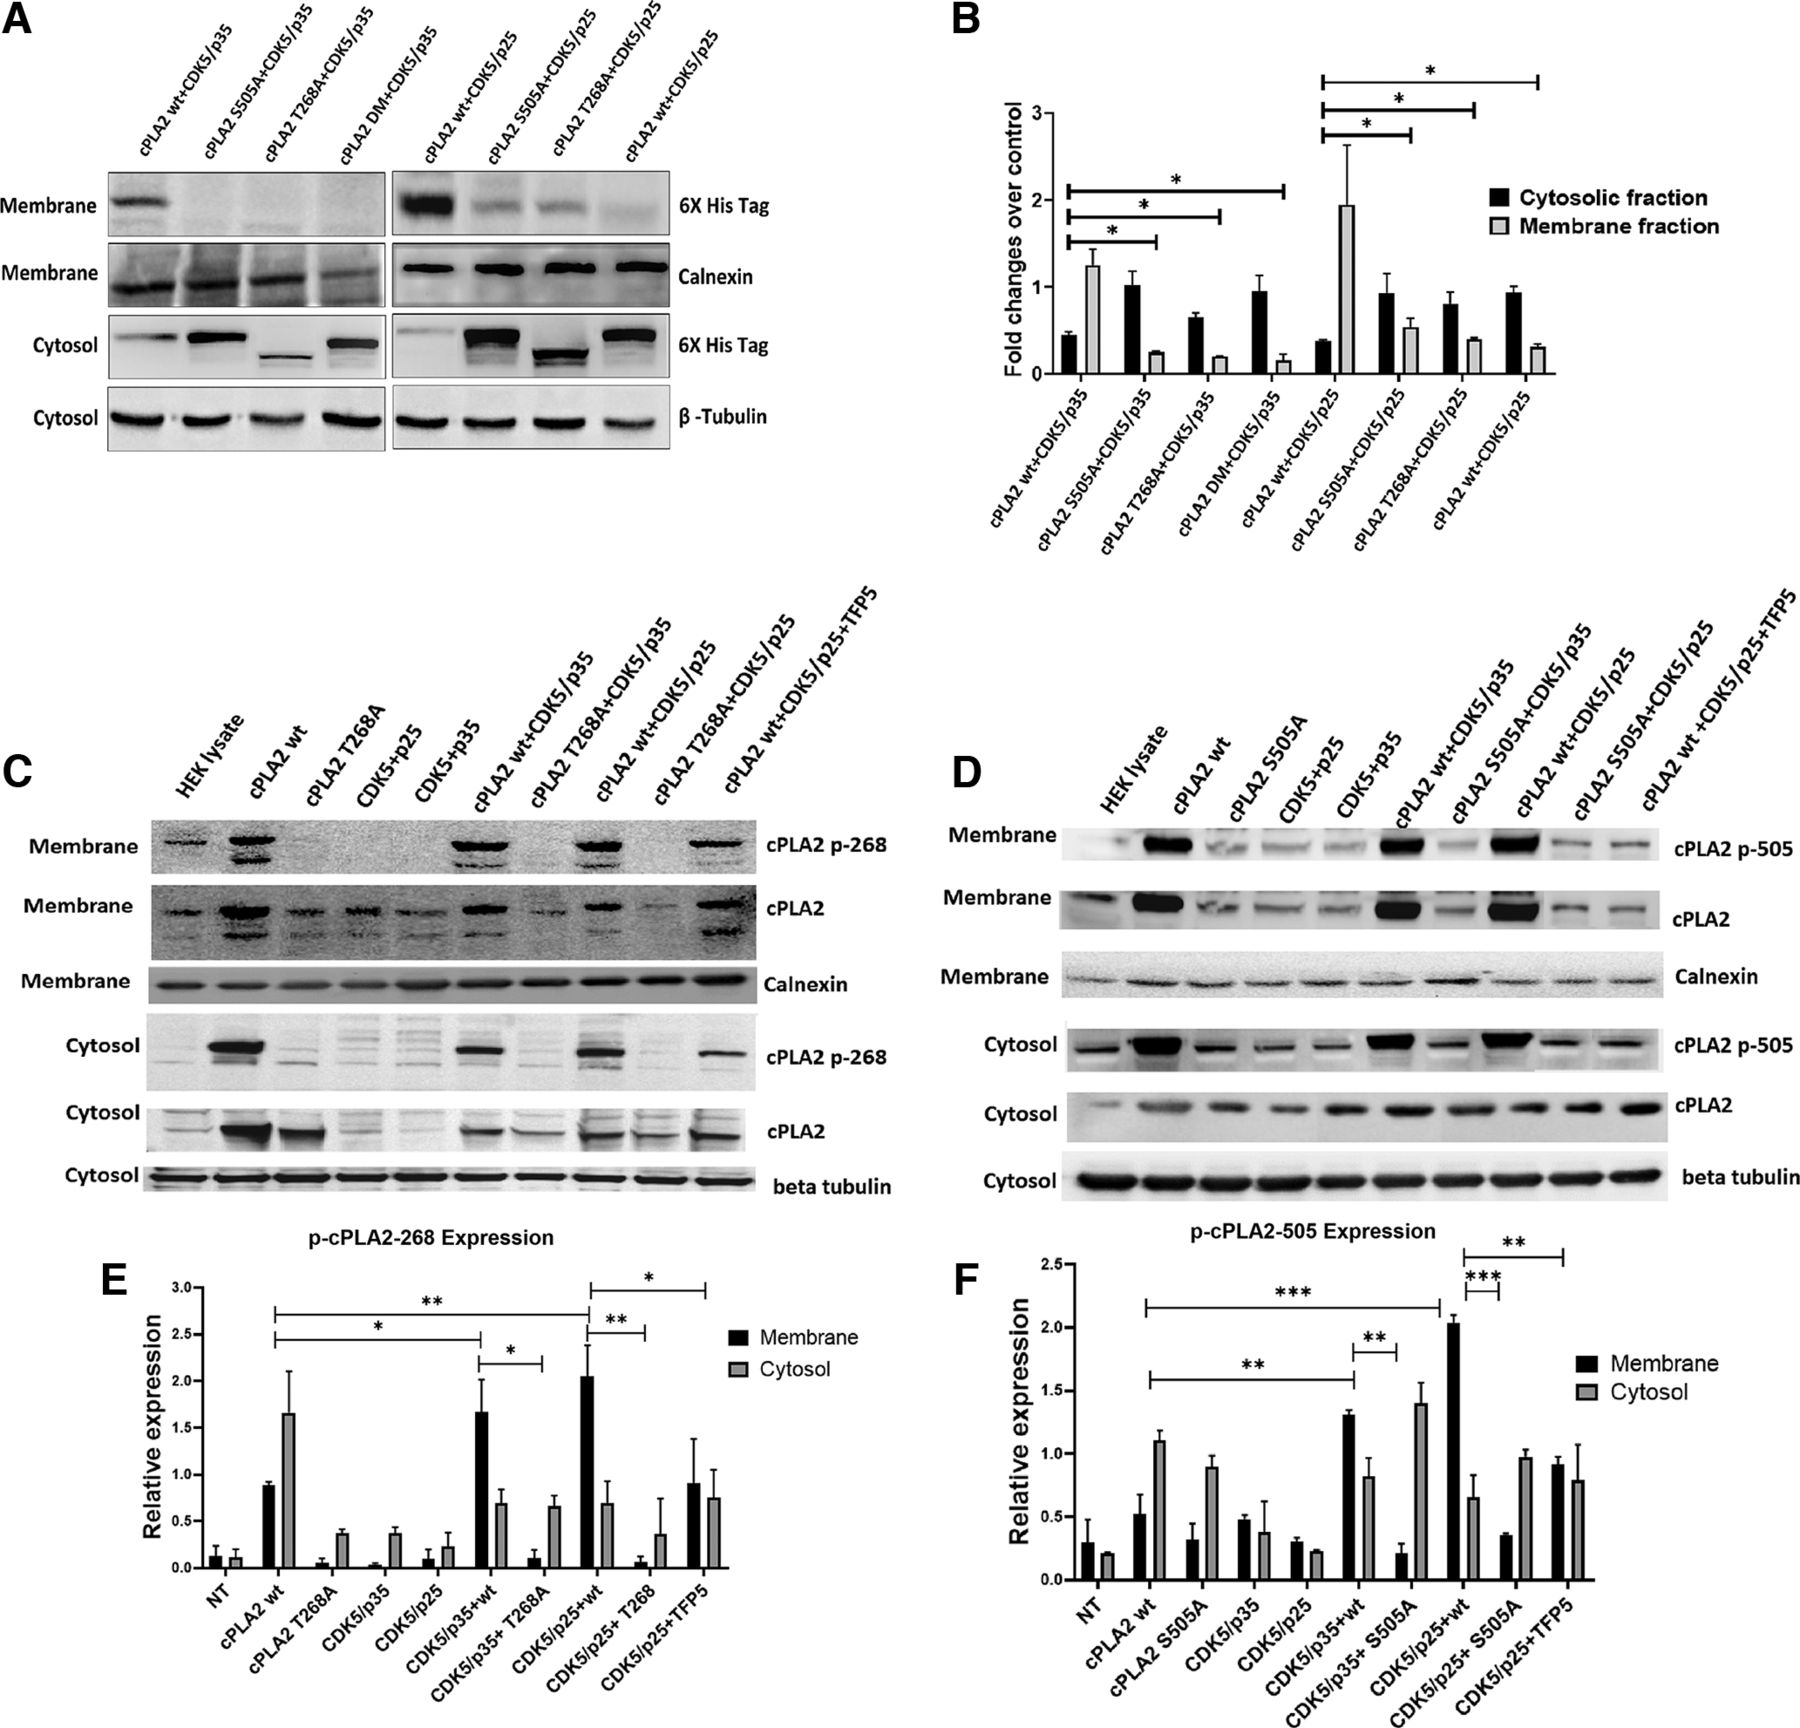
    The expression of cPLA2 wt and its mutants in the membrane and cytosolic protein fraction. A, The expression pattern of cPLA2 and its mutants in a membrane and cytosolic fraction of HEK293T protein lysate cotransfected with cPLA2 and its mutants along with Cdk5/p35 and Cdk5/p25. The reaction standard used for membrane fraction is calnexin, and for cytosolic fraction is β-tubulin. B, Cytosolic and membrane fraction fold changes over control. C, Membrane translocation of phosS268 cPLA2 in the presence of active Cdk5 kinase. D, Membrane translocation of phospho-T505 cPLA2 in the presence of active Cdk5 Kinase. E, Densitometry of relative expressions of p-cPLA2-268 in cytosolic and membrane fractions. F, Densitometry of p-cPLA2-505 in cytosolic and membrane fractions. Calnexin is used as membrane fraction control, and β-tubulin as cytosolic frantic control. Data are presented as the mean ± SEM, and analysis was performed using a one-way ANOVA followed by Bonferroni’s post hoc test; n = 3. *p < 0.05, **p < 0.01, ***p < 0.001.

  • Figure 4.
    • Download figure
    • Open in new tab
    • Download powerpoint
    Figure 4.

    Colocalization of Cdk5 and cPLA2. A, Colocalization of Cdk5 and cPLA2. Immunocytochemistry analysis of Cdk5 and cPLA2 showing their expressions and colocalization. B, Western blot data of Cdk5 and cPLA2 pull-down IPs developed with cPLA2 and Cdk5 antibodies, respectively.
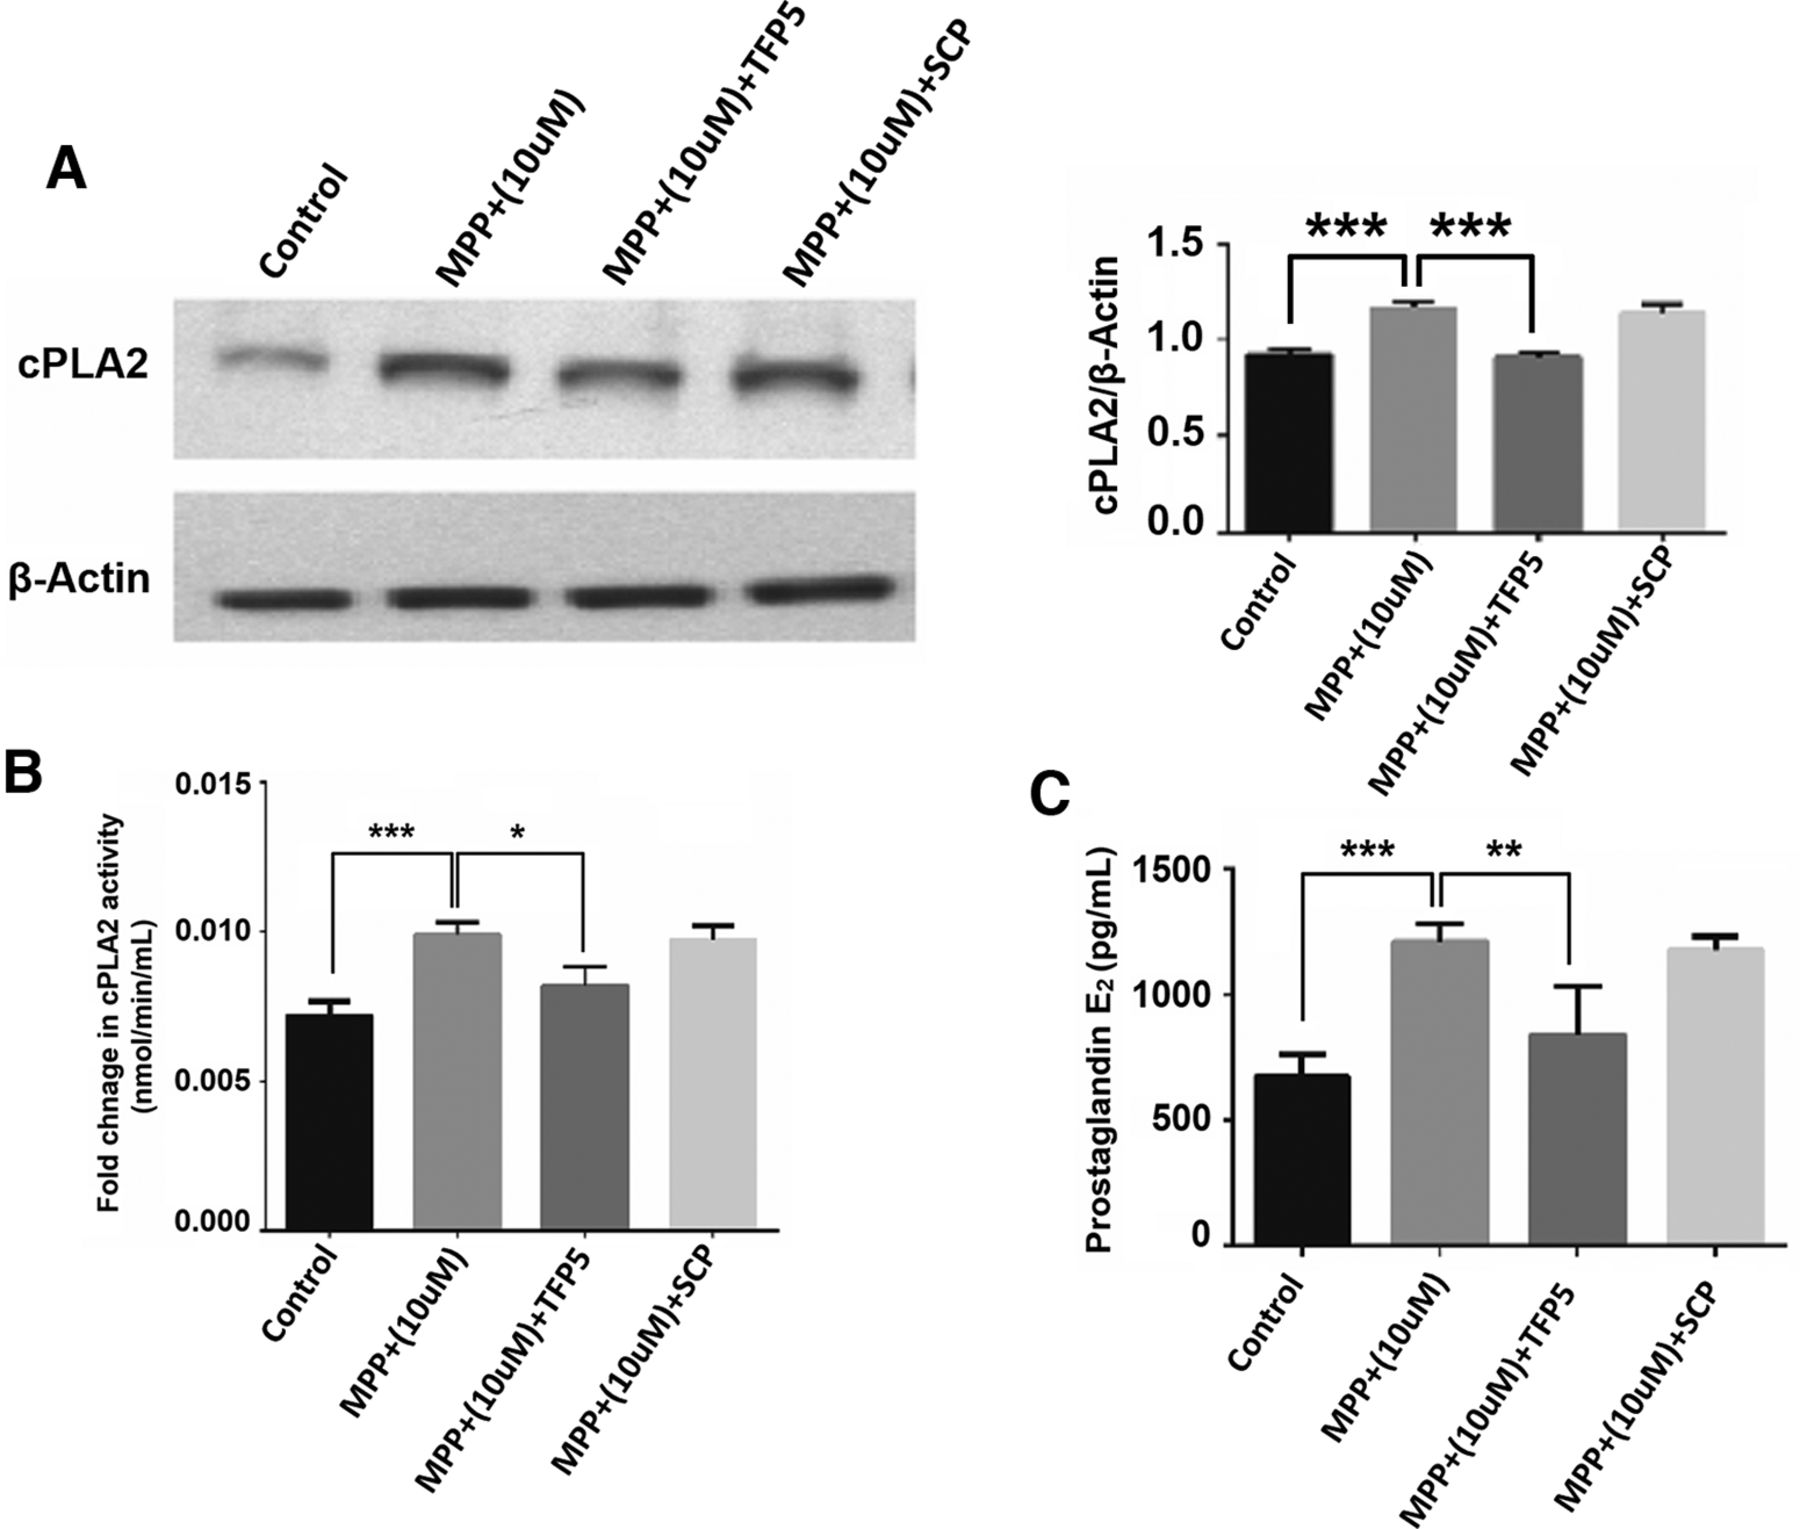
  • Figure 5.
    • Download figure
    • Open in new tab
    • Download powerpoint
    Figure 5.

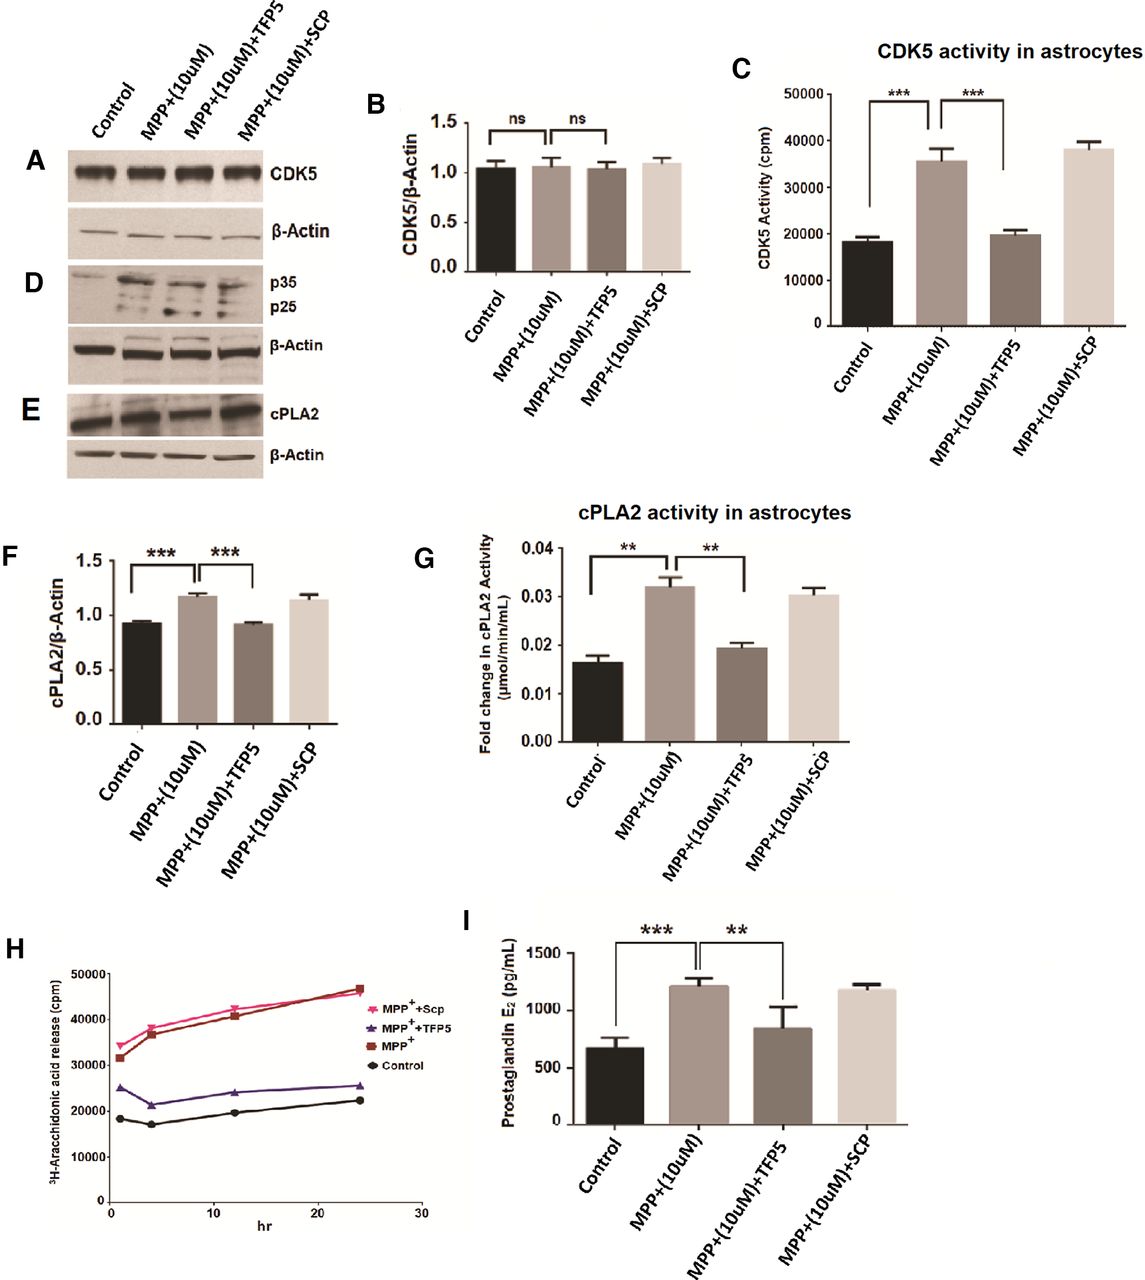
    Cdk5 expression, generation of p25, its kinase activity, and release of arachidonic acid and prostaglandin E2 synthesis by astrocytes exposed to MPP+ and TFP5 treatment. A, The image shows a blot with the expression of Cdk5 in control versus MPP+ (10 μm) along with MPP+ (10 μm) versus MPP+ (10 μm) plus TFP5 and SCP treatment in the protein lysate of astrocytes. B, Bar diagram showing densitometric analysis of Cdk5 expression over β-actin used as a standard for control, MPP+ (10 μm), MPP+ (10 μm) + TFP5 and MPP+ (10 μm) + SCP, respectively. C, The bar diagram represents Cdk5 activity in the astrocyte protein lysate with control versus MPP+ (10 μm) and MPP+ (10 μm) versus MPP+ (10 μm) + TFP5. D, The expression pattern of p35 and p25 in control, MPP+ (10 μm), MPP+ (10 μm) + TFP5, and MPP+ (10 μm) + SCP, respectively. β-Actin was used as a standard. E, The blot representing the expression pattern of cPLA2 in control, MPP+ (10 μm), MPP+ (10 μm) + TFP5, and MPP+ (10 μm) + SCP, respectively. F, The densitometric graph showing cPLA2 expression over β-actin of the above blot. G, The bar graph showing fold changes in cPLA2 activity in astrocyte lysate of control versus MPP+ (10 μm) and MPP+ (10 μm) versus MPP+ (10 μm) + TFP5. H, The scatter plot showing 3H-arachidonic acid release from control astrocytes along with MPP+ (10 μm), MPP+ (10 μm) + TFP5, and MPP+ (10 μm) + SCP. I, The bar graph showing prostaglandin E2 synthesis in control versus MPP+ (10 μm) and MPP+ (10 μm) versus MPP+ (10 μm) + TFP5 along with MPP+ (10 μm) + SCP as the standard for inhibitor treatment. Data are presented as the mean ± SEM, and analysis was performed using one-way ANOVA and Bonferroni’s test; n = 3. *p < 0.05, **p < 0.01, ***p < 0.001, not significant (ns).

  • Figure 6.
    • Download figure
    • Open in new tab
    • Download powerpoint
    Figure 6.

    cPLA2 expression, its activity, and prostaglandin E2 synthesis in neuroglia cells with MPP+ and TFP5 treatment. A, The blot showing cPLA2 expression pattern of control, MPP+ (10 μm), MPP+ (10 μm) + TFP5 and MPP+ (10 μm) + SCP in protein lysate of neuronal–glial culture along with its densitometric analysis. B, The bar graph for the fold of change in cPLA2 activity of control versus MPP+ (10 μm) and MPP+ (10 μm) versus MPP+ (10 μm) + TFP5 in neuronal–glial culture. C, The bar graph shows prostaglandin E2 amount in control versus MPP+ (10 μm) and MPP+ (10 μm) versus MPP+ (10 μm) + TFP5 in neuronal–glial culture. The MPP+ (10 μm) + SCP is used as a standard reaction for inhibitor treatment; n = 3. Data are presented as the mean ± SEM, and analysis was done using one-way ANOVA and Bonferroni’s test. *p < 0.05, **p < 0.01, ***p < 0.001.

  • Figure 7.
    • Download figure
    • Open in new tab
    • Download powerpoint
    Figure 7.

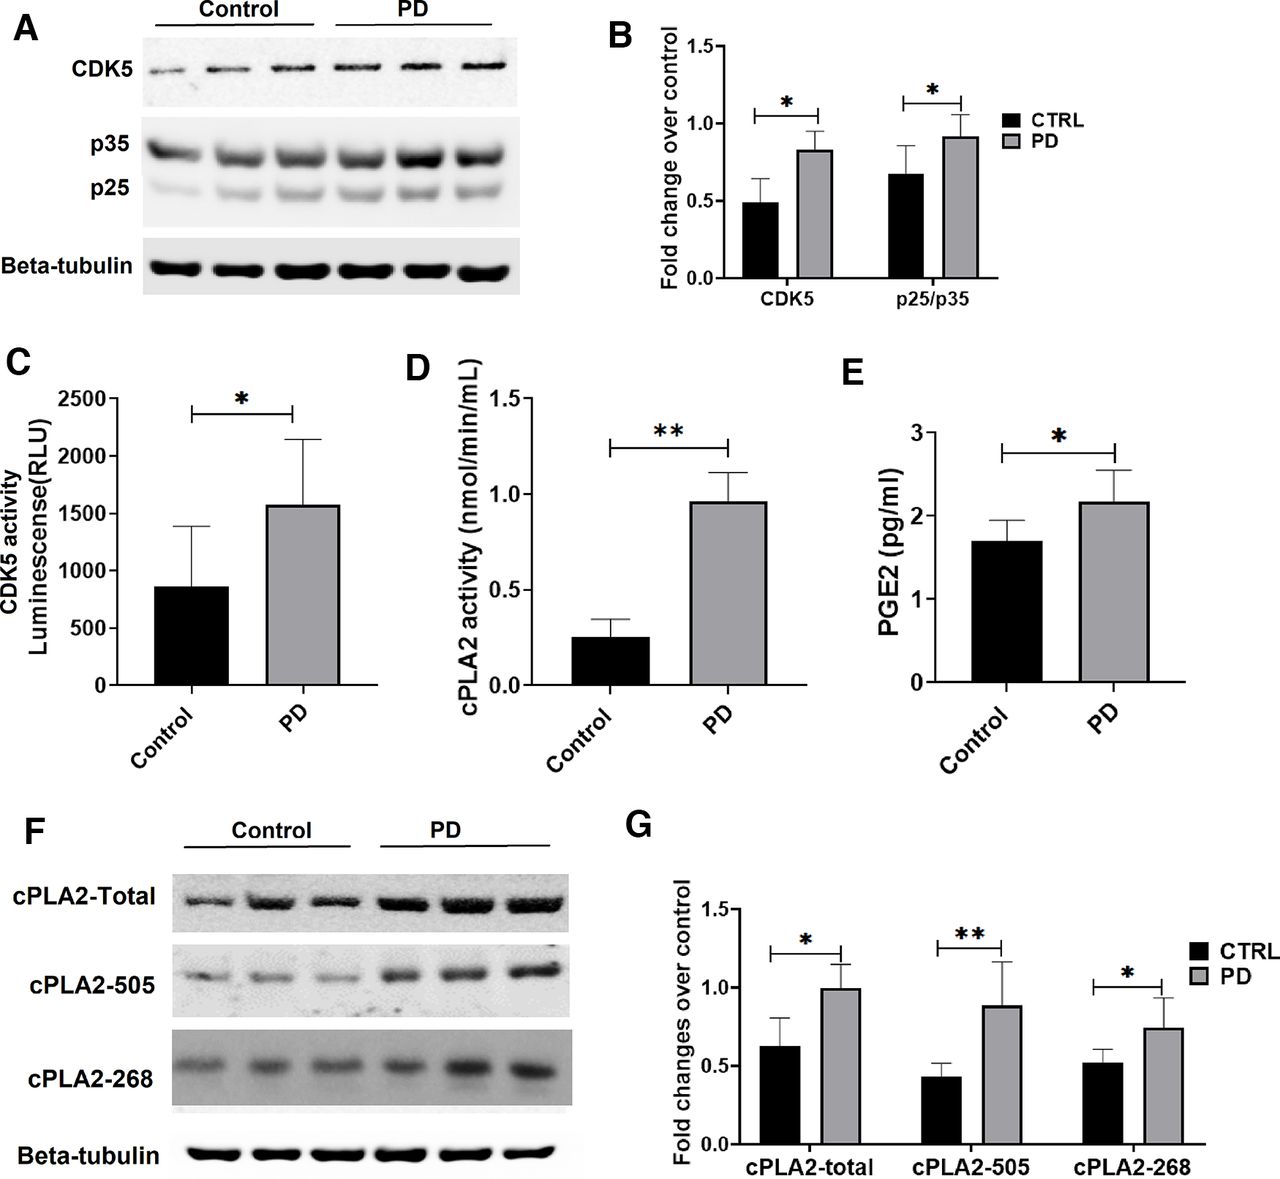
    Generation of p25, Cdk5 activity, cPLA2 activity, and PGE2 levels along with the expression pattern of cPLA2 and phospho-cPLA2 in control versus PD mice model. A, The blot shows the expression pattern of Cdk5, p35, and p25 in control versus PD mouse brain protein lysate (n = 3). B, The densitometric analysis of Cdk5 expression and p25/p35 ratio over its standard, β-tubulin, in control versus PD mice (n = 6). C, The bar graph shows Cdk5 activity that correlates with the luminescence (in relative light units) measure of control versus PD mouse brain protein lysate (n = 6). D, The bar graph shows cPLA2 activity in the brain protein lysate of control versus PD mice model (n = 6). E, The bar graph shows the PGE2 level (in picograms per milliliter) of control versus PD mice model. F, Western blot analysis of cPLA2-total, cPLA2-505, and cPLA2-268 expression in control versus PD mice. G, The bar graph shows fold changes of cPLA2-total, cPLA2-505, and cPLA2-268 expression over β-actin in control versus PD mice. Data are presented as the mean ± SEM, and analysis was performed using unpaired t test with Holm–Sidak method. *p < 0.05, **p < 0.01, ***p < 0.001.

  • Figure 8.
    • Download figure
    • Open in new tab
    • Download powerpoint
    Figure 8.

    Astrocyte activation along with total and phospho-cPLA2 (S505 and T268) enhanced expression in the PD mouse brain. A, Brain sections (10 μm) of control and PD mice were stained with GFAP, cPLA2 total, phospho-cPLA2 at T-268, and phospho-cPLA2 at S-505 in control versus PD mouse brain sections of the substantia nigra region. B, GFAP immunodensity/mm2 in control versus PD (n = 3 mice/group). Scale bar, 100 μm. C, cPLA2 and phospho-cPLA2 immunodensity/mm2 in control versus PD (n = 3 mice/group). All data are presented as the mean ± SEM, and analysis was performed using an unpaired t test and the Holm–Sidak method; n = 3. *p < 0.05, **p < 0.01, ***p < 0.001.

  • Figure 9.
    • Download figure
    • Open in new tab
    • Download powerpoint
    Figure 9.

    A, Workflow of the conjoint differential expression analysis of four PD transcriptomics datasets. B, Heatmap showing upregulated genes in the arachidonic acid and prostaglandin synthesis and inflammatory pathways. C, Heatmap showing downregulated genes in the AA and prostaglandin synthesis and inflammatory pathways. D, The model proposed to explain the mechanism of Cdk5/p25-mediated cPLA2 activation that leads to neuroinflammation.
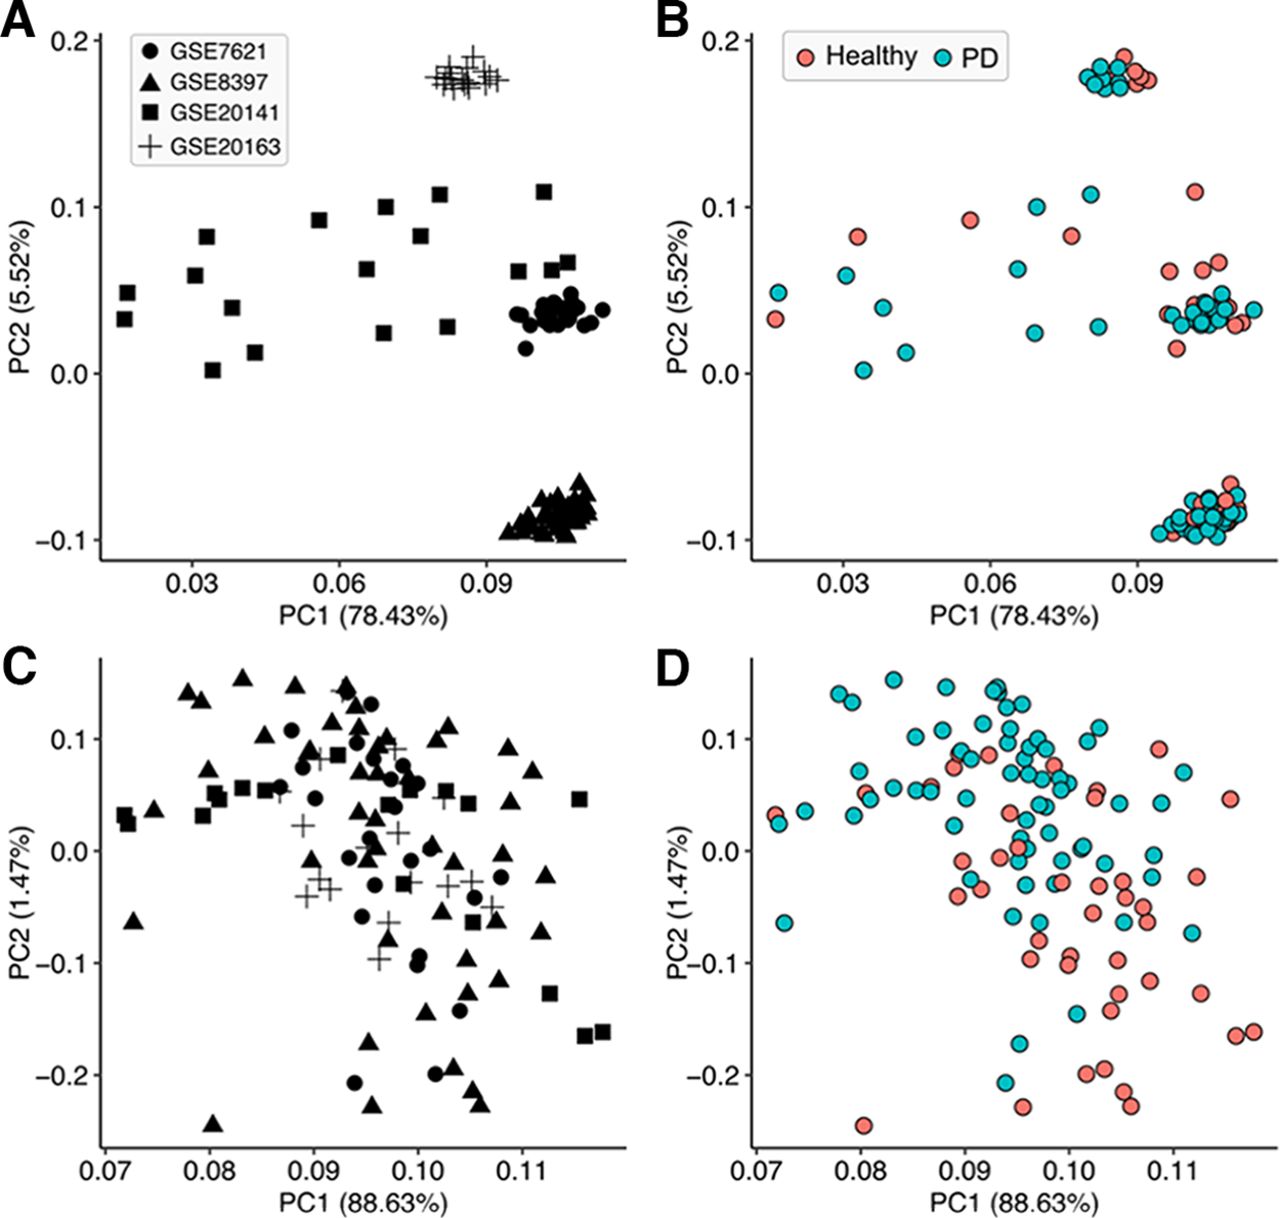
  • Figure 10.
    • Download figure
    • Open in new tab
    • Download powerpoint
    Figure 10.

    A–D, Principal component analysis without (A, B) and with (C, D) normalized expression profiles.

Back to top

In this issue

eneuro: 9 (6)
eNeuro
Vol. 9, Issue 6
November/December 2022
  • Table of Contents
  • Index by author
  • Ed Board (PDF)
Email

Thank you for sharing this eNeuro article.

NOTE: We request your email address only to inform the recipient that it was you who recommended this article, and that it is not junk mail. We do not retain these email addresses.

Enter multiple addresses on separate lines or separate them with commas.
Cyclin-Dependent Kinase 5 Regulates cPLA2 Activity and Neuroinflammation in Parkinson’s Disease
(Your Name) has forwarded a page to you from eNeuro
(Your Name) thought you would be interested in this article in eNeuro.
CAPTCHA
This question is for testing whether or not you are a human visitor and to prevent automated spam submissions.
Print
View Full Page PDF
Citation Tools
Cyclin-Dependent Kinase 5 Regulates cPLA2 Activity and Neuroinflammation in Parkinson’s Disease
Sangita Paul, Saman Fatihi, Srishti Sharma, Rintu Kutum, Raymond Fields, Harish C. Pant, Lipi Thukral, Binukumar BK
eNeuro 9 November 2022, 9 (6) ENEURO.0180-22.2022; DOI: 10.1523/ENEURO.0180-22.2022

Citation Manager Formats

  • BibTeX
  • Bookends
  • EasyBib
  • EndNote (tagged)
  • EndNote 8 (xml)
  • Medlars
  • Mendeley
  • Papers
  • RefWorks Tagged
  • Ref Manager
  • RIS
  • Zotero
Respond to this article
Share
Cyclin-Dependent Kinase 5 Regulates cPLA2 Activity and Neuroinflammation in Parkinson’s Disease
Sangita Paul, Saman Fatihi, Srishti Sharma, Rintu Kutum, Raymond Fields, Harish C. Pant, Lipi Thukral, Binukumar BK
eNeuro 9 November 2022, 9 (6) ENEURO.0180-22.2022; DOI: 10.1523/ENEURO.0180-22.2022
Twitter logo Facebook logo Mendeley logo
  • Tweet Widget
  • Facebook Like
  • Google Plus One

Jump to section

  • Article
    • Abstract
    • Significance Statement
    • Introduction
    • Materials and Methods
    • Results
    • Discussion
    • Acknowledgments
    • Footnotes
    • References
    • Synthesis
    • Author Response
  • Figures & Data
  • Info & Metrics
  • eLetters
  • PDF

Keywords

  • Cdk5
  • cPLA2
  • neuroinflammation
  • Parkinson’s disease

Responses to this article

Respond to this article

Jump to comment:

No eLetters have been published for this article.

Related Articles

Cited By...

More in this TOC Section

Research Article: New Research

  • Deletion of endocannabinoid synthesizing enzyme DAGLα in Pcp2-positive cerebellar Purkinje cells decreases depolarization-induced short-term synaptic plasticity, reduces social preference, and heightens anxiety
  • Release of extracellular matrix components after human traumatic brain injury
  • Action intentions reactivate representations of task-relevant cognitive cues
Show more Research Article: New Research

Disorders of the Nervous System

  • Release of extracellular matrix components after human traumatic brain injury
  • Gene variants related to primary familial brain calcification: perspectives from bibliometrics and meta-analysis
  • Expression of HDAC3-Y298H Point Mutant in Medial Habenula Cholinergic Neurons Has No Effect on Cocaine-Induced Behaviors
Show more Disorders of the Nervous System

Subjects

  • Disorders of the Nervous System
  • Home
  • Alerts
  • Follow SFN on BlueSky
  • Visit Society for Neuroscience on Facebook
  • Follow Society for Neuroscience on Twitter
  • Follow Society for Neuroscience on LinkedIn
  • Visit Society for Neuroscience on Youtube
  • Follow our RSS feeds

Content

  • Early Release
  • Current Issue
  • Latest Articles
  • Issue Archive
  • Blog
  • Browse by Topic

Information

  • For Authors
  • For the Media

About

  • About the Journal
  • Editorial Board
  • Privacy Notice
  • Contact
  • Feedback
(eNeuro logo)
(SfN logo)

Copyright © 2025 by the Society for Neuroscience.
eNeuro eISSN: 2373-2822

The ideas and opinions expressed in eNeuro do not necessarily reflect those of SfN or the eNeuro Editorial Board. Publication of an advertisement or other product mention in eNeuro should not be construed as an endorsement of the manufacturer’s claims. SfN does not assume any responsibility for any injury and/or damage to persons or property arising from or related to any use of any material contained in eNeuro.