

Article Figures & Data
Figures
- Figure 1.
Circadian rhythms regulate object location memory (OLM) performance in a sex-dependent manner. A, Schematic illustrating light-dark (LD) cycle and constant dark (DD) cycle terminology. ZT is used to denote time points in LD where ZT 12 refers to lights off. CT is used to denotate time points in DD where CT 12 is the projected night from the prior LD cycle. Experiments were conducted at ZT 4 or CT 4 (day) and ZT 16 or CT 16 (night). B, Experimental timeline illustrating habitation during LD and DD on days 1–4 and training and testing procedures in DD on day 5. C, Schematic of OLM experimental procedure. Mice were placed in arena and allowed to explore two objects during 5-min training phase at either CT 4 or CT 16. After a 30-min delay in the home cage, one object remained in the same location in the arena (familiar), and one object was moved to a new location (novel), and mice were placed back in the arena and allowed to explore for the 5-min testing phase. D, Scatterplot displaying all individual discrimination index scores with mean ± SEM. Data were plotted for two time points and both sexes: male night, n = 13; male day, n = 13; female day, n = 15; female night, n = 13 (*interaction, p = 0.023, two-way ANOVA; *time-of-day for males, p = 0.047, simple main effects; *time-of-day for females, p = 0.003, simple main effects). In all plots, blue codes for observations at night, and orange codes observations made during the day. ZT, Zeitgeber time; CT, Circadian time. SEM, standard error of the mean. n, number of mice. Total exploration time was not different across groups and did not predict DI scores (Extended Data Fig. 1-1). For a detailed statistical summary, see Extended Data Table 1-1.
- Figure 2.
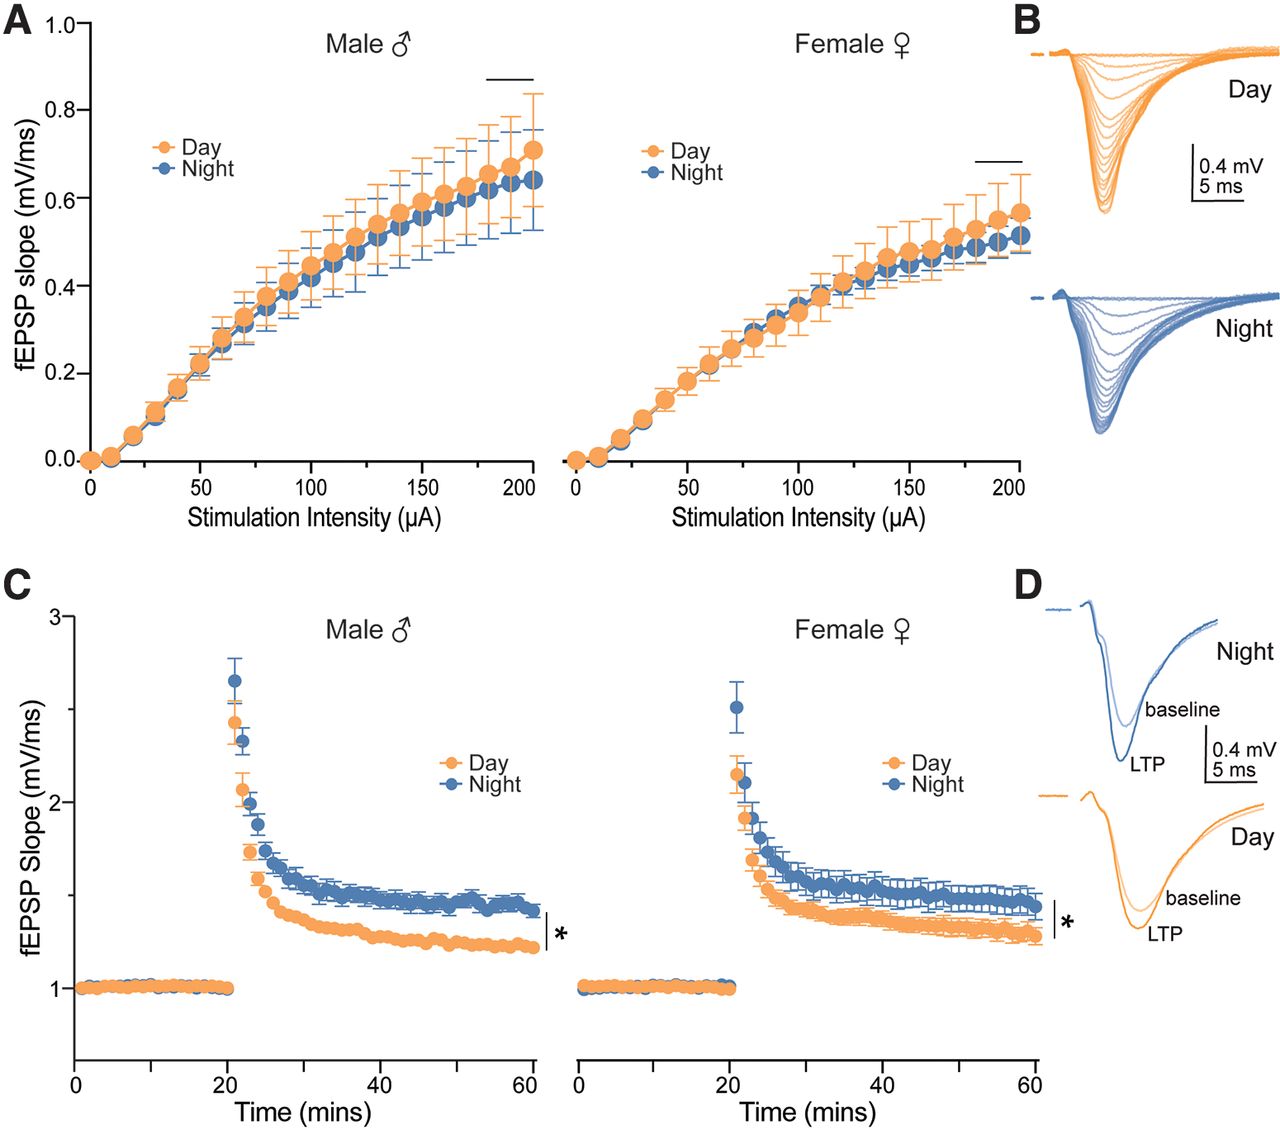
LTP magnitude is greater at night compared with the day, regardless of sex. A, Average slopes of fEPSPs in response to increasing stimulation of the Schaffer collaterals (time-of-day × sex interaction: p < 0.001). Note that significant sex differences in input-output responses were observed only at 180 μA (p = 0.041), 190 μA (p = 0.042), and 200 μA (p = 0.035), regardless of time-of-day, as indicated by horizontal line above stimulation intensities. Data were plotted for two time points and both sexes: male day, n = 13 slices from 3 mice; male night, n =10 slices from 3 mice; female day, n = 14 slices from 3 mice; female night, n = 12 slices from 3 mice. B, Example fEPSPs from two male mice used to generate input-output curves in A. C, Average slopes of fEPSPs before and after a HFS (100 Hz, 0.5 s, 2×; t = 20 min) to Schaffer collaterals (time-of-day: *p = 0.003; means ± SEMs at 60 min, night: 1.451 ± 0.176; day: 1.286 ± 0.141). Data were plotted for two time points and both sexes: male day, n = 7 slices from 3 mice; male night, n = 8 slices from 3 mice; female day, n = 10 slices from 3 mice; female night, n = 9 slices from 3 mice. D, Example fEPSPs from two female mice used to produce LTP in C. In all plots, blue codes recordings at night and orange codes recordings during the day. ♀ = female. ♂ = male. LTP, Long-term potentiation; fEPSPs, field EPSPs; SEM, standard error of the mean; HFS, high-frequency tetanus. All statistical tests were performed with a three-way linear mixed model (input-output curves) or three-way, RM-ANOVA (LTP). Data are shown as means ± SEMs. For a detailed statistical summary, see Extended Data Table 1-1.
- Figure 3.
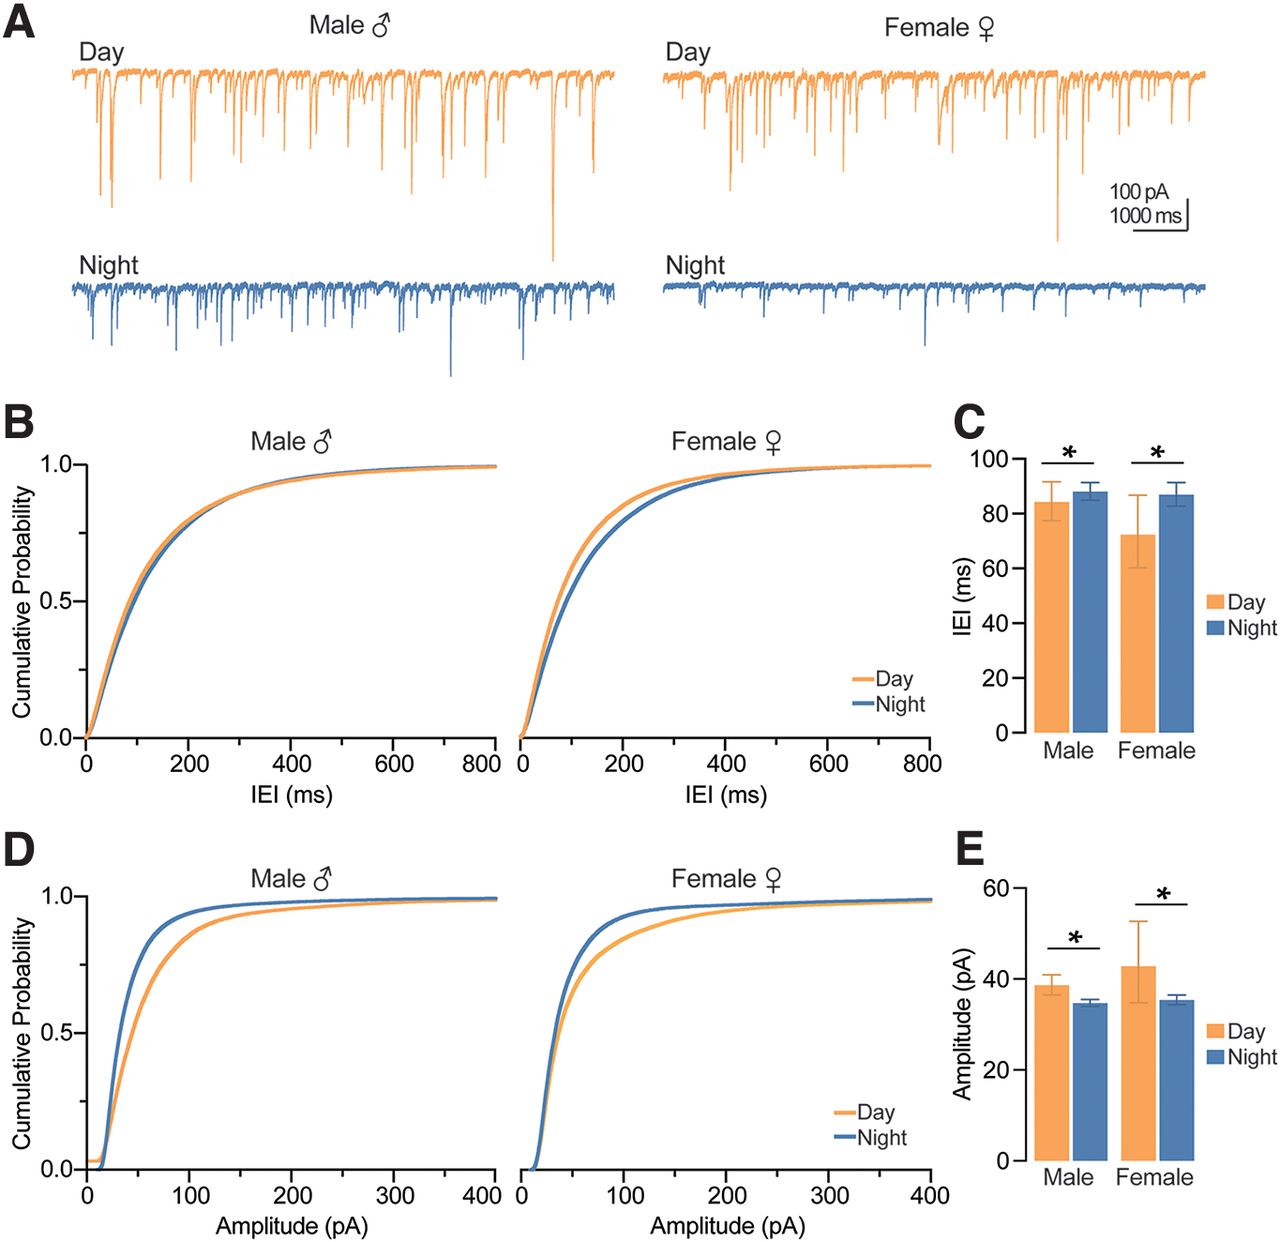
Action potential-mediated inhibition onto CA1 pyramidal neurons is greater during the day compared with night, regardless of sex. A, Example traces of IPSCs onto CA1 pyramidal neurons. Scale bars represent 100 pA and 1000 ms. B, Cumulative probability distribution plots for the IEI of sIPSCs. C, Estimated marginal means and confidence intervals of the IEI of sIPSCs; time-of-day: *p = 0.003; pooled EMM [95% confidence intervals] for night, 87.491 [82.215, 90.180] ms and day, 78.050 [72.164, 87.145] ms. D, Cumulative probability distribution plots for the amplitude of sIPSCs. E, Estimated marginal means and confidence intervals of the amplitude of sIPSCs; time-of-day: *p = 0.008; pooled EMM [95% confidence intervals] for day, 41.697 [37.523, 46.334] pA and night, 36.066 [35.424, 36.720] pA. sIPSCs were measured from five male mice during the day (n = 16 cells), five male mice at night (n = 28 cells), five female mice during the day (n = 18 cells), and five female mice at night (n = 17 cells). In all plots, blue codes recordings at night and orange codes recordings during the day. ♀ = female. ♂ = male. EMM, estimated marginal means; IEI, interevent interval; sIPSCs, spontaneous IPSCs. All statistical tests were performed with a two-way GEE model. Data were shown as EMM ± confidence intervals. For a detailed statistical summary, see Extended Data Table 1-1.
- Figure 4.
Action potential-independent inhibition onto CA1 pyramidal neurons is influenced by sex and time-of-day. A, Example traces of spontaneous, mIPSCs onto CA1 pyramidal neurons. Scale bars represent 100 pA and 500 ms. B, Cumulative probability distribution plots for the IEI of mIPSCs. C, Estimated marginal means and confidence intervals of the IEI of mIPSCs (interaction, p = 0.068). D, Cumulative probability distribution plots for the amplitude of mIPSCs. E, Estimated marginal means and confidence intervals of the amplitude of mIPSCs (interaction: *p = 0.038). Note that significant sex differences were observed during the day (p = 0.006) but not at night (p = 0.594). mIPSCs were measured from male five mice during the day (n = 12 cells), five male mice at night (n = 13 cells), five female mice during the day (n = 12 cells), and five female mice at night (n = 14 cells). In all plots, blue codes recordings at night and orange codes recordings during the day. ♀ = female. ♂ = male. EMM, estimated marginal means; IEI, interevent interval; mIPSCs, miniature IPSCs. All statistical tests were performed with a two-way GEE model followed by Wald χ2 pairwise comparisons. Data were shown as EMM ± confidence intervals. For a detailed statistical summary, see Extended Data Table 1-1.
- Figure 5.
Action potential-mediated excitation onto CA1 pyramidal neurons depends on sex. A, Example traces of spontaneous sEPSCs onto CA1 pyramidal neurons. Scale bars represent 40 pA and 1000 ms. B, Cumulative probability distribution plots for the IEI of sEPSCs. C, Estimated marginal means ± confidence intervals of the IEI of sEPSCs; sex: *p = 0.022; pooled EMM [95% confidence intervals] for males, 469.002 [426.705, 515.530] ms and females, 311.536 [222.006, 436.968] ms. Note that differences in sEPSC IEIs recorded during the day (455.037 [410.344, 506.913] ms) and night (321.107 [230.600, 449.839] ms) failed to reach statistical significance (time-of-day: p = 0.052). D, Cumulative probability distribution plots for the amplitude of sEPSCs. E, EMM and confidence intervals of the amplitude of sEPSCs; sex: *p = 0.020; pooled EMM [95% confidence intervals] for females, 24.952 [23.898, 26.046] pA and males, 23.578 [23.111, 24.058] pA. sEPSCs were recorded from five male mice during the day (n = 17 cells), five male mice at night (n = 16 cells), five female mice during the day (n = 16 cells), and five female mice at night (n = 18 cells). In all plots, blue codes recordings at night and orange codes recordings during the day. ♀ = female. ♂ = male. EMM, estimated marginal means; IEI, interevent interval; sEPSCs, spontaneous EPSCs. All statistical tests were performed with a two-way GEE model. Data were shown as EMM ± confidence intervals. For a detailed statistical summary, see Extended Data Table 1-1.
- Figure 6.
Action potential-independent excitation onto CA1 pyramidal neurons is dependent on sex and time-of-day. A, Example traces of spontaneous mEPSCs onto CA1 pyramidal neurons. Scale bars represent 20 pA and 500 ms. B, Cumulative probability distribution plots for the IEI of mEPSCs. C, Estimated marginal means and confidence intervals of the IEI of mEPSCs (interaction: *p = 0.021). Note that significant time-of-day differences were observed in males (*p = 0.002) but not in females (p = 0.765). D, Probability distribution plots for the amplitude of mEPSCs. E, EMM and confidence intervals of the amplitude of mEPSCs (no significant effects). Spontaneous mEPSCs were recorded from four male mice during the day (n = 11 cells), three male mice at night (n = 13 cells), three female mice during the day (n = 14 cells), and four female mice at night (n = 13 cells). In all plots, blue codes recordings at night and orange codes recordings during the day. ♀ = female. ♂ = male. EMM, estimated marginal means; IEI, interevent interval; mEPSCs, miniature EPSCs. All statistical tests were performed with a two-way GEE model followed by Wald χ2 pairwise comparisons. Data were shown as EMM ± confidence intervals. For a detailed statistical summary, see Extended Data Table 1-1.
- Figure 7.
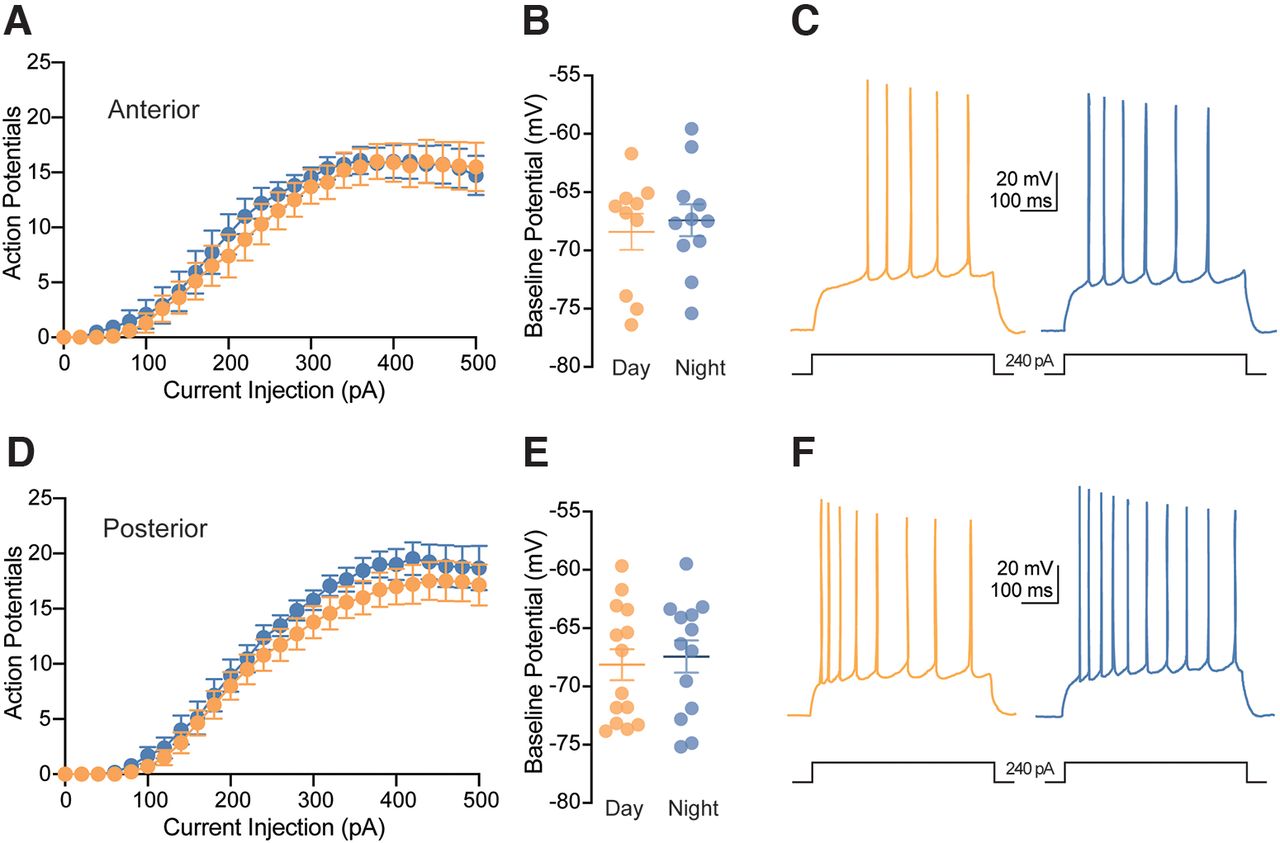
Excitability of CA1 pyramidal neurons depends on time-of-day but not sex. A, Schematic locations of CA1 pyramidal neurons across the anterior-posterior axis in reference to the Allen Brain Atlas. Cells were considered “anterior” if recorded in hippocampal slices that corresponded to plate 48 or lower in the Allen brain atlas, and “posterior” if they corresponded to plate 49 or higher. B, Average number of action potentials fired in response to increasing depolarizing current injections in neurons recorded from anterior slices from 14 mice at night (n = 33 cells) and 11 mice during the day (n = 33 cells; time-of-day: *p = 0.046). C, Scatterplot of individual values with mean ± SEM of baseline membrane potentials of neurons recorded from anterior slices (time-of-day: ns p = 0.535). D, Example traces of a 240-pA current step response in anterior slices from two male mice recorded during the day and night. Scale bars represent 20 mV and 100 ms. E, Average number of action potentials fired in response to increasing depolarizing current injections in neurons recorded from posterior slices from 11 mice at night (n = 27 cells) and 11 mice during the day (n = 27 cells; time-of-day: ns p = 0.484). F, Scatterplot of individual values with mean ± SEM of baseline membrane potentials of neurons recorded from posterior slices (time-of-day: *p = 0.044). G, Example traces of a 240-pA current step response in posterior slices from two male mice recorded during the day and night. Scale bars represent 20 mV and 100 ms. In all plots, blue codes recordings at night and orange codes recordings during the day. SEM, standard error of the mean. All statistical tests were performed with a two-way RM-ANOVA. Data were shown as means ± SEMs. For a detailed statistical summary, see Extended Data Table 1-1.
- Figure 8.
Diurnal differences in CA1 pyramidal neuron excitability are dependent on synaptic inputs. A, Average number of action potentials fired in response to increasing depolarizing current injections in neurons recorded from anterior slices from six mice at night (n = 11 cells) and six mice during the day (n = 10 cells) in the presence of synaptic antagonists (time-of-day: ns p = 0.933). B, Scatterplot of individual values with mean ± SEM of baseline membrane potentials of neurons recorded from anterior slices (time-of-day: ns p = 0.896). C, Example traces of 240-pA current step response in anterior slices from two male mice recorded during the day and night in the presence of synaptic antagonists. Scale bars represent 20 mV and 100 ms. D, Average number of action potentials fired in response to increasing depolarizing current injections in neurons recorded from posterior from six mice at night (n = 13 cells) and six mice during the day (n = 14 cells; time-of-day: ns p = 0.569). E, Scatterplot of individual values with mean ± SEM of baseline membrane potentials of neurons recorded from posterior slices (time-of-day: ns p = 0.999). F, Example traces of a 240-pA current step response in posterior slices from two male mice recorded during the day and night in the presence of synaptic antagonists. Scale bars represent 20 mV and 100 ms. In all plots, blue codes recordings at night and orange codes recordings during the day. SEM, standard error of the mean; ns, not significant. All statistical tests were performed with a two-way RM-ANOVA. Data were shown as means ± SEMs. For a detailed statistical summary, see Extended Data Table 1-1.


Tables
Day Night Mean ± SEM (n, N) Mean ± SEM (n, N) Baseline (mV) Anterior −70.57 ± 0.84 (33,11) −69.79 ± 0.78 (33,14) Posteriora −69.99 ± 0.94 (27,11) −67.53 ± 0.82 (31,11) Input resistance (MΩ) Anterior 63.73 ± 2.84 (33,11) 64.81 ± 2.71 (33,14) Posterior 73.3 ± 3.43 (27,11) 78.16 ± 3.53 (31,11) Sag amplitude (mV) Anterior 4.84 ± 0.36 (33,11) 4.94 ± 0.33 (33,14) Posterior 5.63 ± 0.47 (27,11) 6.43 ± 0.41 (31,11) AP response slope Anterior 0.053 ± 0.004 (33,11) 0.051 ± 0.005 (33,14) Posterior 0.052 ± 0.005 (27,11) 0.046 ± 0.01 (31,11) Max (Hz) Anterior 16.58 ± 0.96 (33,11) 18.27 ± 0.84 (33,14) Posterior 18.37 ± 1.06 (27,11) 19.42 ± 0.818 (31,11) Imax (pA) Anterior 418.18 ± 13.96 (33,11) 416.36 ± 12.45 (33,14) Posterior 394.07 ± 15.54 (27,11) 380.65 ± 15.120 (31,11) Single action potential properties Anterior Rheobase (pA) 153.28 ± 10.67 (29,11) 139.35 ± 10.51 (26,11) Amplitude (mV) 91.82 ± 0.80 (29,11) 93.52 ± 0.76 (26,11) Threshold (mV) −43.37 ± 0.66 (29,11) −43.45 ± 0.59 (26,11) Rise time (ms)b 0.29 ± 0.01 (29,11) 0.28 ± 0.01 (26,11) Male: 0.30 ± 0.01 (28,11) Female: 0.28 ± 0.01 (27,11) Decay time (ms) 0.93 ± 0.02 (29,11) 0.92 ± 0.02 (26,11) Half-width (ms) 0.93 ± 0.02 (29,11) 0.94 ± 0.01 (26,11) fAHP (mV) −6.42 ± 0.49 (29,11) −6.24 ± 0.48 (26,11) mAHP (mV) −9.68 ± 0.51 (29,11) −8.98 ± 0.49 (26,11) Peak rise (ΔmV/Δms) 400.25 ± 11.60 (29,11) 414.86 ± 10.03 (26,11) Peak fall (ΔmV/Δms) −98.34 ± 1.98 (29,11) −99.48 ± 1.62 (26,11) Posterior Rheobase (pA) 120.56 ± 8.75 (27,11) 120.56 ± 8.75 (27,11) Amplitude (mV) 91.45 ± 0.81 (27,11) 91.45 ± 0.81 (27,11) Threshold (mV) −42.58 ± 0.59 (27,11) −42.58 ± 0.59 (27,11) Rise time (ms) 0.32 ± 0.01 (27,11) 0.32 ± 0.01 (27,11) Decay time (ms) 1.14 ± 0.03 (27,11) 1.14 ± 0.03 (27,11) Half-width (ms) 1.11 ± 0.03 (27,11) 1.11 ± 0.03 (27,11) fAHP (mV) −5.01 ± 0.43 (27,11) −5.01 ± 0.43 (27,11) mAHP (mV) −8.25 ± 0.41 (27,11) −8.25 ± 0.41 (27,11) Peak rise (ΔmV/Δms) 352.36 ± 10.63 (27,11) 352.36 ± 10.63 (27,11) Peak fall (ΔmV/Δms) −80.31 ± 2.70 (27,11) −80.31 ± 2.70 (27,11) - Table 2
Membrane properties of CA1 pyramidal neurons across day and night in synaptic antagonists
Day Night Mean ± SEM (n, N) Mean ± SEM (n, N) Baseline (mV) Anterior −68.41 ± 1.55 (10,6) −67.42 ± 1.37 (11,6) Posterior −68.14 ± 1.33 (14,6) −67.44 ± 1.38 (13,6) Input resistance (MΩ) Anterior 74.38 ± 5.14 (10,6) 74.49 ± 8.76 (11,6) Posterior 74.26 ± 4.76 (14,6) 74.28 ± 5.88 (13,6) Sag amplitude (mV) Anterior 6.37 ± 0.58 (10,6) 6.37 ± 0.65 (11,6) Posterior 6.43 ± 0.54 (14,6) 6.36 ± 0.48 (13,6) AP response slope Anterior 0.048 ± 0.01 (10,6) 0.04 ± 0.015 (11,6) Posterior 0.051 ± 0.009 (14,6) 0.059 ± 0.011 (13,6) Max (Hz) Anterior 18.30 ± 1.46 (10,6) 19.55 ± 0.71 (11,6) Posterior 20.07 ± 1.05 (14,6) 21.62 ± 1.06 (13,6) Imax (pA) Anterior 346.0 ± 29.22 (10,6) 370.91 ± 14.11 (11,6) Posterior 381.43 ± 20.91 (14,6) 407.69 ± 19.68 (13,6) Single action potential properties Anterior Rheobase (pA) 132.7 ± 14.76 (10,6) 121.82 ± 12.82 (11,6) Amplitude (mV) 93.17 ± 1.15 (10,6) 92.885 ± 1.44 (11,6) Threshold (mV) −40.28 ± 0.90 (10,6) −42.15 ± 0.65 (11,6) Rise time (ms) 0.29 ± 0.01 (10,6) 0.32 ± 0.02 (11,6) Decay time (ms) 1.02 ± 0.04 (10,6) 1.01 ± 0.03 (11,6) Half-width (ms) 0.99 ± 0.02 (10,6) 0.98 ± 0.01 (11,6) fAHP (mV) a,b −5.77 ± 0.74 (10,6) −4.08 ± 0.51 (11,6) Male: −5.83 ± 0.56 (11,6) Female: −3.98 ± 0.58 (10,6) mAHP (mV)c −9.29 ± 0.65 (10,6) −7.06 ± 0.59 (11,6) Peak rise (ΔmV/Δms) 406.80 ± 20.07 (10,6) 397.56 ± 18.27 (11,6) Peak fall (ΔmV/Δms) −92.16 ± 3.01 (10,6) −91.97 ± 1.78 (11,6) Posterior Rheobase (pA) 126.07 ± 11.17 (14,6) 115.23 ± 14.59 (13,6) Amplitude (mV) 92.90 ± 1.03 (14,6) 92.07 ± 1.46 (13,6) Threshold (mV) −40.82 ± 0.49 (14,6) −41.01 ± 0.55 (13,6) Rise time (ms) 0.29 ± 0.01 (14,6) 0.28 ± 0.01 (13,6) Decay time (ms) 1.08 ± 0.03 (14,6) 1.04 ± 0.02 (13,6) Half-width (ms) 1.03 ± 0.02 (14,6) 1.00 ± 0.02 (13,6) fAHP (mV) −5.13 ± 0.58 (14,6) −5.72 ± 0.45 (13,6) mAHP (mV) −8.67 ± 0.66 (14,6) −9.65 ± 0.54 (13,6) Peak rise (ΔmV/Δms) 390.30 ± 12.53 (14,6) 406.47 ± 16.78 (13,6) Peak fall (ΔmV/Δms) −86.65 ± 2.31 (14,6) −88.15 ± 1.96 (13,6)
Extended Data Figure 1-1
Total exploration is not different across groups and does not predict OLM performance. A, Total exploration time for individual mice during the testing phase with mean ± SEM across day and night in both sexes (time-of-day: ns p = 0.926, sex: ns p = 0.936, interaction: ns p = 0.692, two-way ANOVA). There was no difference in distribution of high explorers (total exploration time > 35 s) and low explorers (total exploration time < 35 s) across four groups (p = 0.619, Pearson’s χ2). B, Correlation between total exploration times and DI scores during test phase (ns p = 0.704, r = –0.053, Pearson’s correlation). Male night (dark blue) n = 13 mice; male day (light blue), n = 13 mice; female day (light green), n = 15 mice; female night (dark green), n = 13 mice. For a detailed statistical summary, see Extended Data Table 1-1. Download Figure 1-1, TIF file
Supplementary Material
Supplementary Table 1-1 Statistical summary Table 1-1, XLSX file
In this issue


