

Article Figures & Data
Figures
- Figure 1.
Characterization of neuronal avalanches in the habenula. A, The habenula of Tg(elavl3:H2B-GCaMP6s) fish, imaged at 15 Hz. Scale bar, 25 μm. B, Population statistics (mean and standard deviation, SD) of the neuron average firing rate aggregated over all recordings. The individual firing rate distributions for each recording are given in Extended Data Figure 1-1. C, Activity in a subset of neurons in the habenula imaged at 15 Hz. The black lines indicate frames where there is at least one spike inferred by MLspike. D, Plot showing number of spikes across the population as inferred by MLspike. E, F, Inferred spikes, obtained from imaging a single plane at 113 Hz. E is the entire recording, whereas F is a zoomed in version to a portion. G, H, Distribution of avalanche size (G) and duration (H) in fish imaged at 113 Hz at a single plane. The blue curve is based on data from one fish, while the orange curve is derived from a second fish. The log-log plots are not linear, indicating the absence of a power law. Further avalanche analyses are given in Extended Data Figure 1-2.
- Figure 2.
The regression slopes rk at different time lags k. The blue curve represents actual data, whereas the red curve is the fit using the estimated
- Figure 3.
Inferred
- Figure 4.
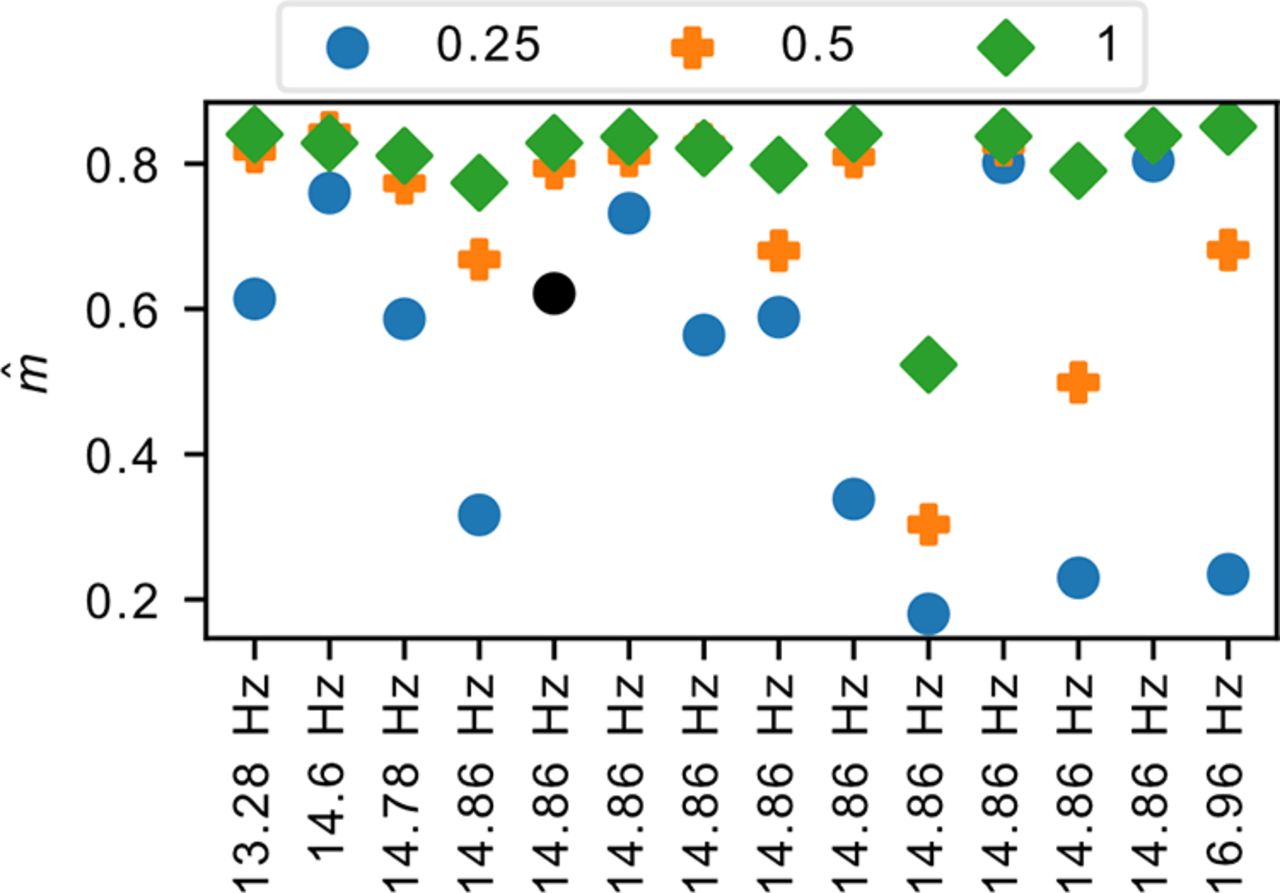
Effect of spatial subsampling on
- Figure 5.
Autocorrelation time in the habenula. The autocorrelation time τ (in seconds) for each of the accepted datasets, labeled and sorted by the recording sampling rate. The box plot on the right shows the aggregated statistics of these values.
- Figure 6.
Spike count correlation distribution. Each panel indicates the distribution of a different dataset. For all the accepted datasets, the mean μ is significantly smaller than the width σ of the distribution. This finding is also consistent with further spatial subsampling of the system (Extended Data Fig. 6-1).
- Figure 7.
PCA explained variance ratio for the accepted datasets. All cases display a gradual decline instead of just a single dominant contribution, with the effective dimensions being significantly >1. In addition, activity along the different principal components have heterogeneous loadings (Extended Data Fig. 7-1). These deviate from what is expected from a neural system with critical avalanches.
- Figure 8.
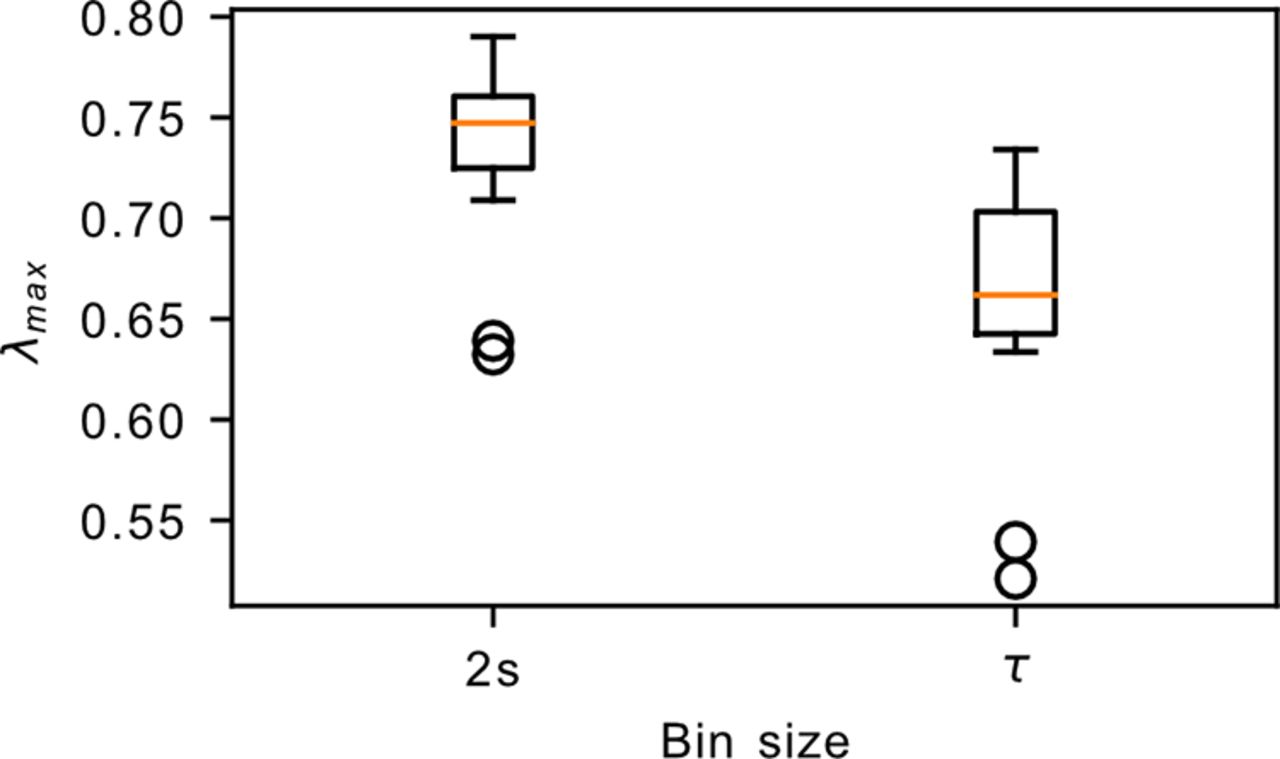
The largest eigenvalue λmax of the connectivity matrix. The computation of λmax requires the binning of the spikes into time bins. This plot shows the results obtained after binning the spikes into 2 s bins, as well as binning into different sizes for each dataset according to its own autocorrelation time τ. In both cases, the λmax values lie well below the critical point at λmax = 1.


Extended Data
Figure 1-1
Average firing rate distributions for each recording computed from the discrete spikes inferred using MLspike. Download Figure 1-1, TIF file.
Figure 1-2
Further avalanche analysis. Top row, Mean avalanche size given duration. Bottom row, Avalanche shape collapse. We see that β and γ are far from satisfying Equation 10, further indicating that the habenula is not critical. Download Figure 1-2, file.
Figure 2-1
Simulations of stationary branching process that nevertheless test positive for Hpoisson and
Figure 3-1
A representative sample of the regression slopes rk at different time lags k for shuffled data. Each row is a specific dataset temporally subsampled to yield multiple effective sampling rates, which progressively becomes noisier as temporal subsampling reduces sample size. In each case, shuffling leads to a noisy horizontal line in the plot clustered at ∼0, indicating Poisson activity (m = 0). Indeed, the majority test positive for Hpoisson, while the remaining few are positive for other nonstationarity tests. Download Figure 3-1, TIF file.
Figure 4-1
Simulation results showing the impact of different types of spatial subsampling. In all cases, we simulated a system of 15,000 neurons before temporally subsampling by a factor of 15 and spatially subsampling to 250 neurons. Each subplot then shows the impact of further subsampling from this initial population of 250 neurons. A–H, Left column (A, C, E, G), Temporal subsampling by skipping bins; right column (B, D, F, H), temporal summation by summing over skipped bins. A–D, Spatial subsampling by binomial subsampling (i.e., skipping individual spikes). E–H, Systematic subsampling by skipping neurons. A, B, E, F, mtrue = 0.9999, m = 0.9985; C, D, G, H, mtrue = 0.985, m = 0.7972. Download Figure 4-1, TIF file.
Figure 6-1
Spike count covariance distribution of spatially subsampled data. Each row represents a specific dataset spatially subsampled by a factor given by the column. In all cases, we observe consistency in the relationship between the mean μ and the width σ of the distribution. Download Figure 6-1, TIF file.
Figure 7-1
Loadings for the top three principal components. Each row represents a principal component, and each column is for a particular sample dataset, truncated to 50 neurons for clearer visualization. In all cases, the loadings are nonuniform with a mix of positive and negative contributions. Download Figure 7-1, TIF file.
In this issue


