
Main menu

  • HOME
  • CONTENT
    • Early Release
    • Featured
    • Current Issue
    • Issue Archive
    • Blog
    • Collections
    • Podcast
  • TOPICS
    • Cognition and Behavior
    • Development
    • Disorders of the Nervous System
    • History, Teaching and Public Awareness
    • Integrative Systems
    • Neuronal Excitability
    • Novel Tools and Methods
    • Sensory and Motor Systems
  • ALERTS
  • FOR AUTHORS
  • ABOUT
    • Overview
    • Editorial Board
    • For the Media
    • Privacy Policy
    • Contact Us
    • Feedback
  • SUBMIT

User menu

Search

  • Advanced search
eNeuro
eNeuro

Advanced Search


  • HOME
  • CONTENT
    • Early Release
    • Featured
    • Current Issue
    • Issue Archive
    • Blog
    • Collections
    • Podcast
  • TOPICS
    • Cognition and Behavior
    • Development
    • Disorders of the Nervous System
    • History, Teaching and Public Awareness
    • Integrative Systems
    • Neuronal Excitability
    • Novel Tools and Methods
    • Sensory and Motor Systems
  • ALERTS
  • FOR AUTHORS
  • ABOUT
    • Overview
    • Editorial Board
    • For the Media
    • Privacy Policy
    • Contact Us
    • Feedback
  • SUBMIT
PreviousNext
Research ArticleResearch Article: New Research, Sensory and Motor Systems

Humans Can Track But Fail to Predict Accelerating Objects

Philipp Kreyenmeier, Luca Kämmer, Jolande Fooken and Miriam Spering
eNeuro 5 September 2022, 9 (5) ENEURO.0185-22.2022; https://doi.org/10.1523/ENEURO.0185-22.2022
Philipp Kreyenmeier
1Graduate Program in Neuroscience, University of British Columbia, British Columbia, Canada, V6T 1Z3
2Department of Ophthalmology and Visual Sciences, University of British Columbia, British Columbia, Canada, V6T 1Z3
  • Find this author on Google Scholar
  • Find this author on PubMed
  • Search for this author on this site
Luca Kämmer
2Department of Ophthalmology and Visual Sciences, University of British Columbia, British Columbia, Canada, V6T 1Z3
  • Find this author on Google Scholar
  • Find this author on PubMed
  • Search for this author on this site
Jolande Fooken
2Department of Ophthalmology and Visual Sciences, University of British Columbia, British Columbia, Canada, V6T 1Z3
4Centre for Neuroscience Studies, Queen’s University, Ontario, Canada, K7L 3N6
  • Find this author on Google Scholar
  • Find this author on PubMed
  • Search for this author on this site
Miriam Spering
1Graduate Program in Neuroscience, University of British Columbia, British Columbia, Canada, V6T 1Z3
2Department of Ophthalmology and Visual Sciences, University of British Columbia, British Columbia, Canada, V6T 1Z3
3Djavad Mowafaghian Centre for Brain Health, University of British Columbia, British Columbia, Canada, V6T 1Z3
5Institute for Computing, Information, and Cognitive Systems, University of British Columbia, British Columbia, Canada, V6T 1Z4
  • Find this author on Google Scholar
  • Find this author on PubMed
  • Search for this author on this site
  • Article
  • Figures & Data
  • Info & Metrics
  • eLetters
  • PDF
Loading

Article Figures & Data

Figures

  • Figure 1.
    • Download figure
    • Open in new tab
    • Download powerpoint
    Figure 1.

    A, Task procedure. A black disk moved across a gray monitor background from left to right at a constant rate of acceleration. After an initial period during which the target was visible, it moved behind an occluder of a fixed width (13.4°) and then reappeared. Observers had to estimate the time of reappearance (equivalent to TTC) and intercept the target with a rapid pointing movement of their right index finger (red dot). B, Target parameters in experiment 1. Targets moved with a variable initial velocity (vinit) and accelerated or decelerated at a constant rate. The initial and average velocities (vavg) of the targets were related in such a way with acceleration rate that all targets reached the occluder with the same velocity (vfinal) of 20°/s. C, Target parameters in experiment 2. Initial and final target velocities were related in such a way with acceleration rate that all targets had the same vavg of 20°/s.

  • Figure 2.
    • Download figure
    • Open in new tab
    • Download powerpoint
    Figure 2.

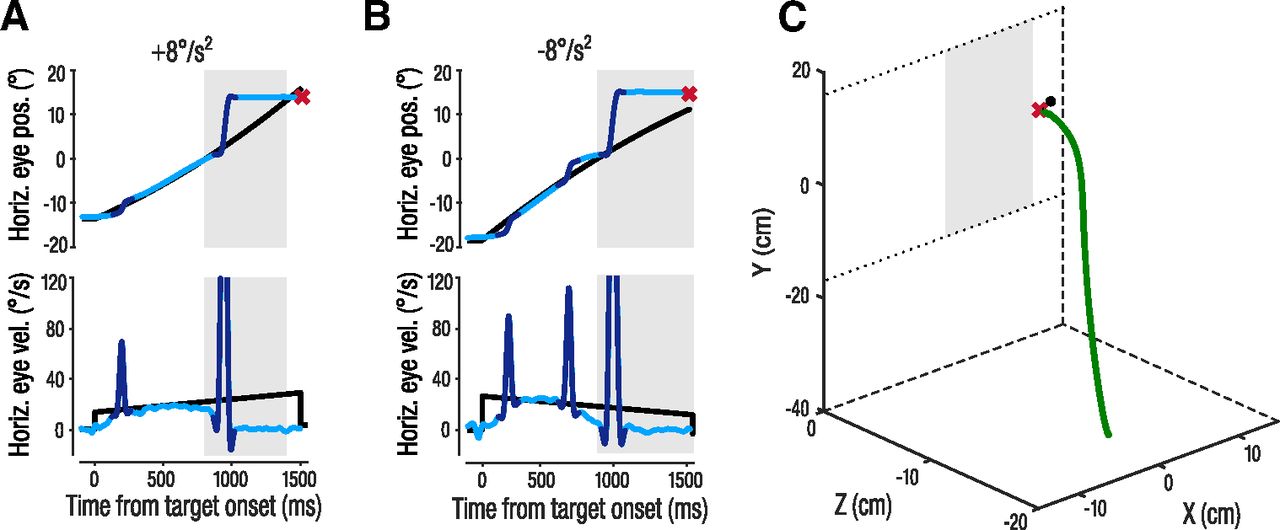
    Single trial eye and hand movements from one representative observer. A, B, Two trials with a +8°/s2 accelerating target (A) or −8°/s2 decelerating target (B). Light blue traces indicate smooth pursuit components, dark blue traces represent saccades. Upper panels show the horizontal position of the eye (blue) and target (black) locked to target motion onset. The red x represents the interception position and time. Lower panels show horizontal velocity of the eyes and target over time. Gray area represents the time of target occlusion. C, 3D-hand position trace (green) from the same trial as in A. The 2D interception position on the screen is indicated by the red x and the target position at the time of interception in represented by the black disk. The gray area illustrates the position of the occluder on the screen. Dotted lines in the x-y plane illustrate the upper and bottom edges of the screen.

  • Figure 3.
    • Download figure
    • Open in new tab
    • Download powerpoint
    Figure 3.

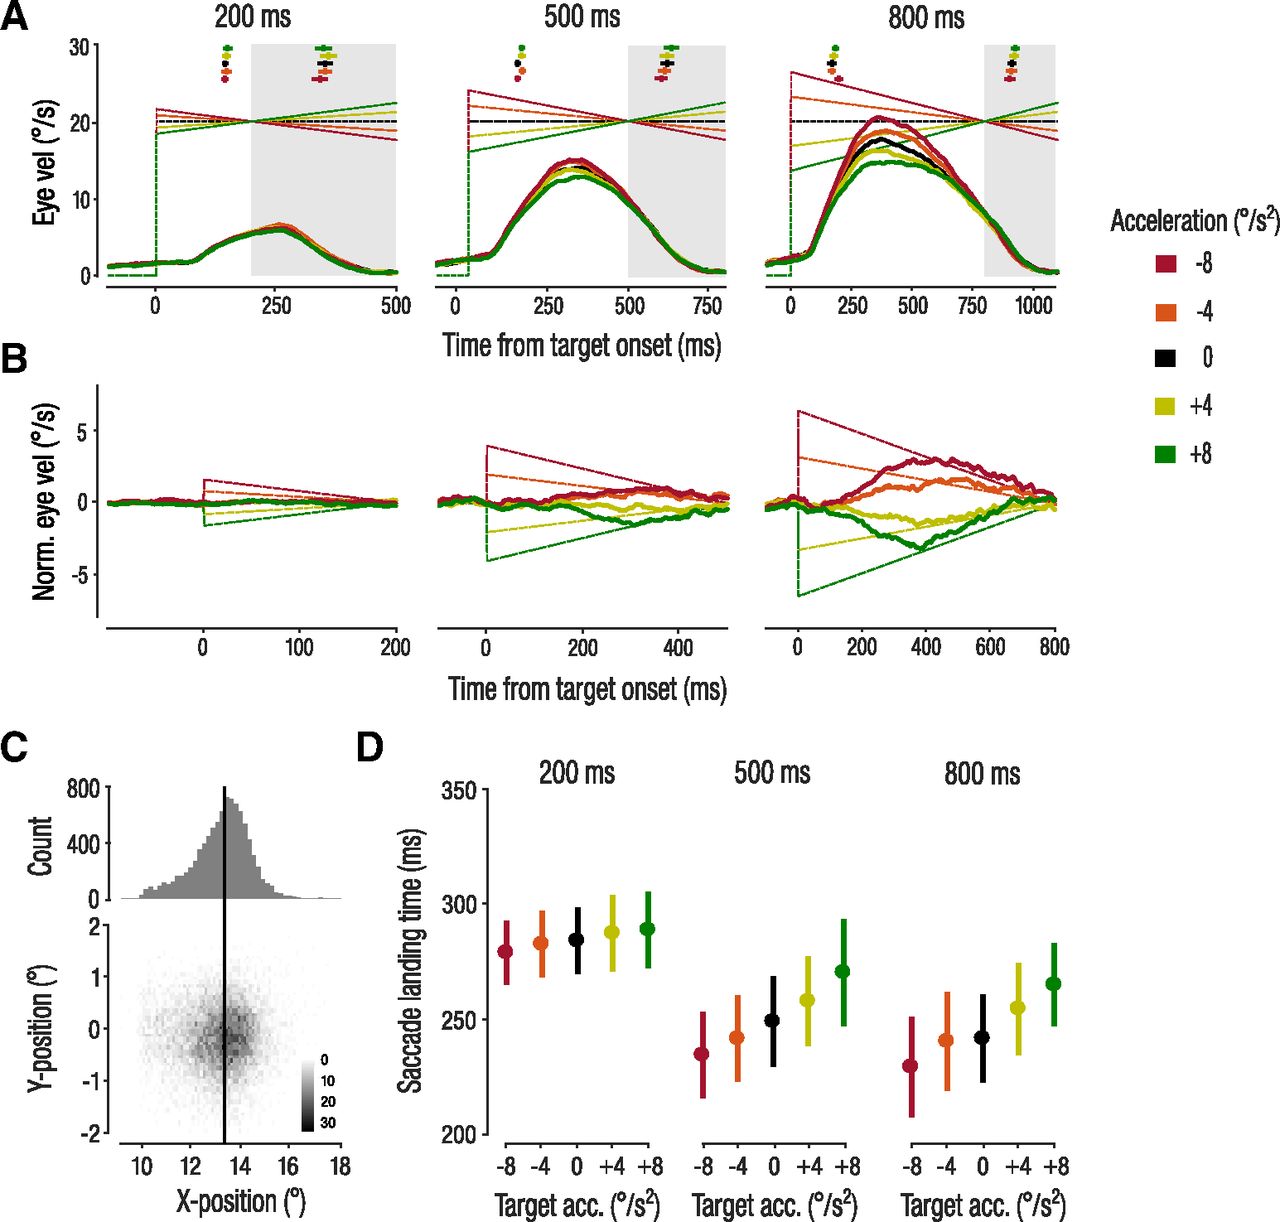
    Effect of presentation duration on smooth pursuit and predictive saccades. A, Average de-saccaded smooth pursuit velocities. Squares and error bars at the top show the mean ± 1 SEM of the first catch-up saccade (left) and predictive saccade (right) onsets. Shaded areas indicate occlusion period and dashed lines represent target velocities. B, Normalized pursuit velocity during target presentation. C, Distribution of 2D saccade landing positions. The black line represents the location of target reappearance (i.e., right border of the occluder). D, SLTs. Dots and error bars represent the mean across observers ± 1 SEM.

  • Figure 4.
    • Download figure
    • Open in new tab
    • Download powerpoint
    Figure 4.

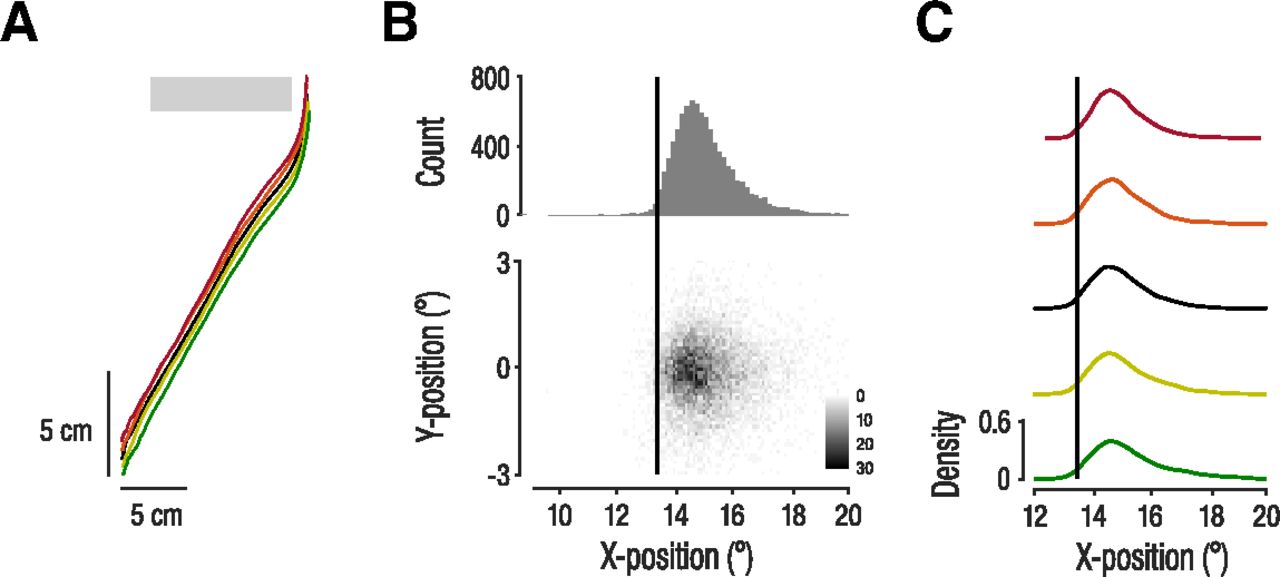
    Hand movement paths and interception position. A, Top view of the hand movement paths in the x-z plane. The gray bar illustrates the x-position of the occluder on the screen. Hand movement paths were shifted along the z-axis for better visibility. B, Distribution of 2D interception positions. Histogram shows the distribution of horizontal interception positions. C, Kernel density plots of horizontal interception positions for the different target acceleration condition.
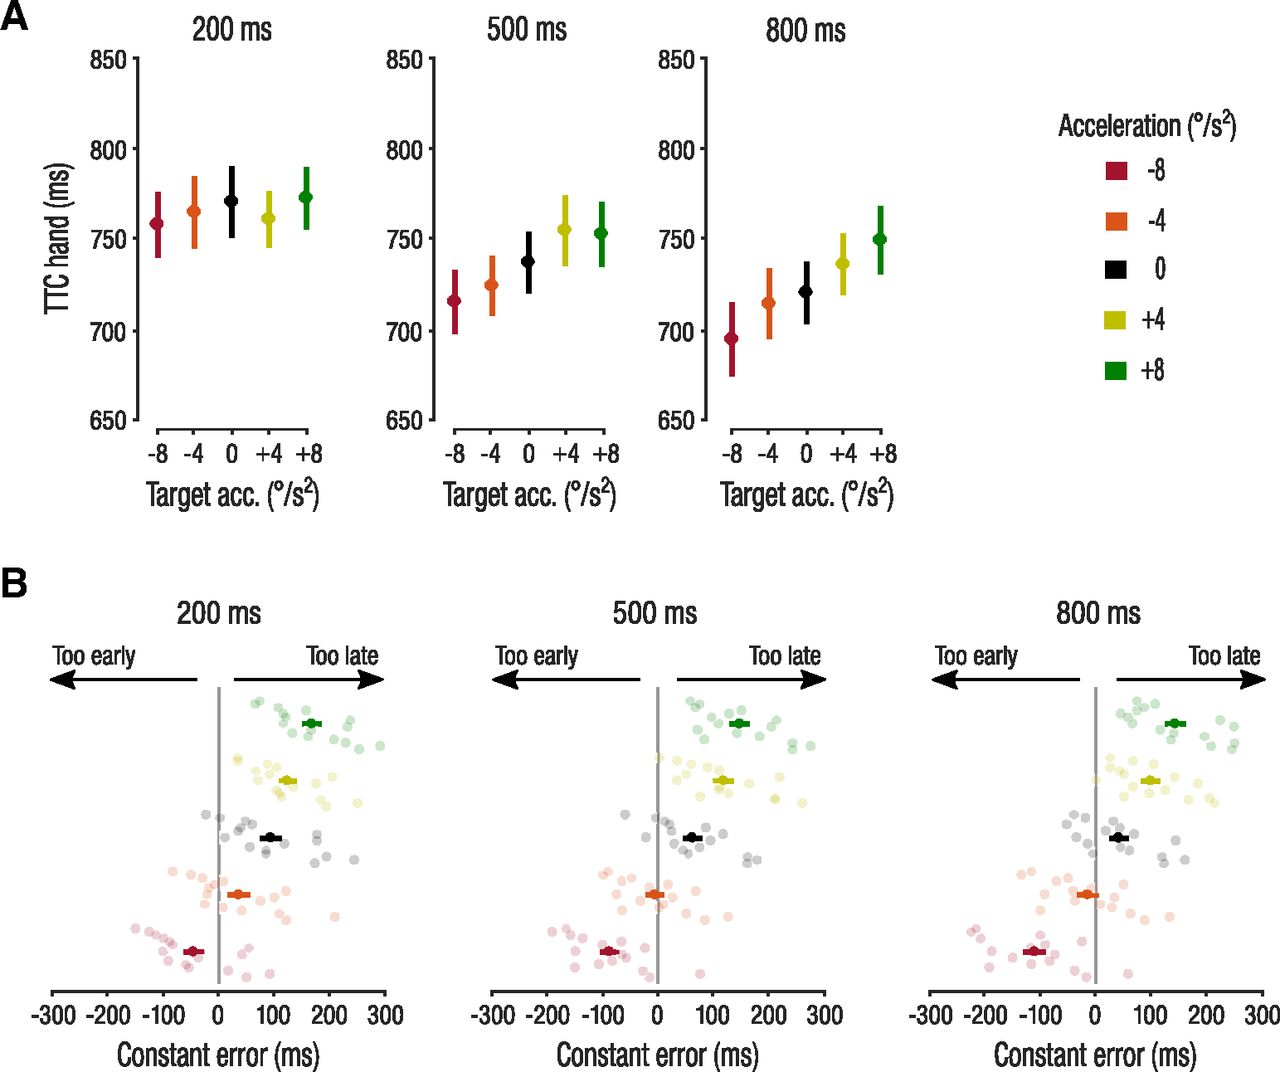
  • Figure 5.
    • Download figure
    • Open in new tab
    • Download powerpoint
    Figure 5.

    Manual interception time. A, Mean TTChand (interception time relative to occlusion onset). B, Mean and individual observers’ constant interception errors. Semi-transparent dots represent individual observers’ median performance. Negative values indicate interceptions that occurred before the target reached the end of the occluder (too early), and positive values indicate interceptions occurring after the target reached the end of the occluder (too late). Error bars represent ± 1 SEM.

  • Figure 6.
    • Download figure
    • Open in new tab
    • Download powerpoint
    Figure 6.

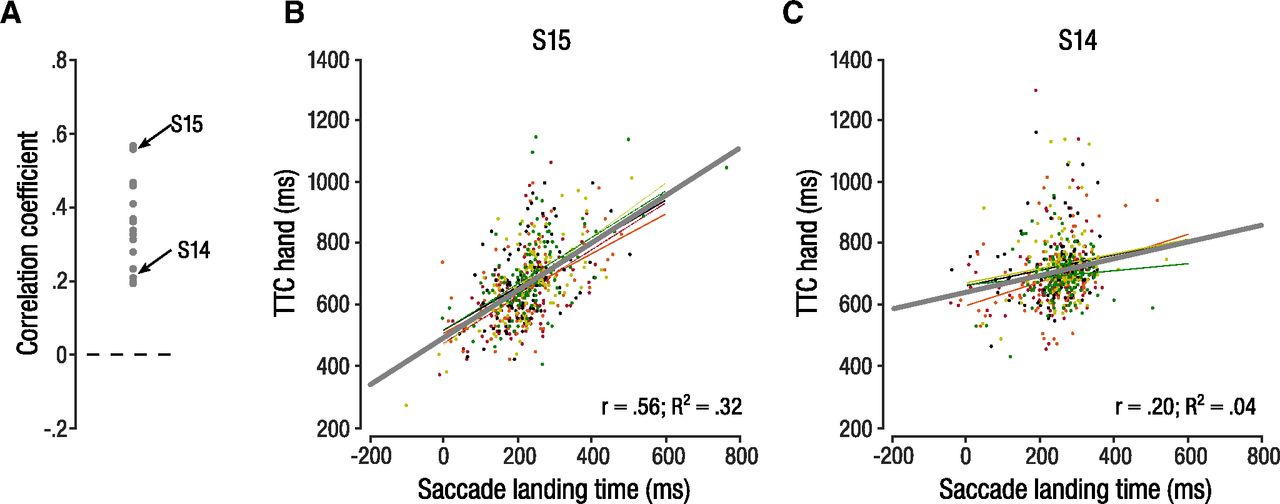
    Trial-by-trial correlation across acceleration conditions and presentation durations between SLT and TTChand. A, Distribution of individual correlation coefficients. B, C, Scatterplot and trend lines of the trial-by-trial correlation for an observer with a strong (B) and for an observer with a weak (C) correlation between SLT and TTChand. Dots represent individual trials. Thin lines represent trend lines for the different acceleration conditions, thick line shows the trend across conditions.

  • Figure 7.
    • Download figure
    • Open in new tab
    • Download powerpoint
    Figure 7.

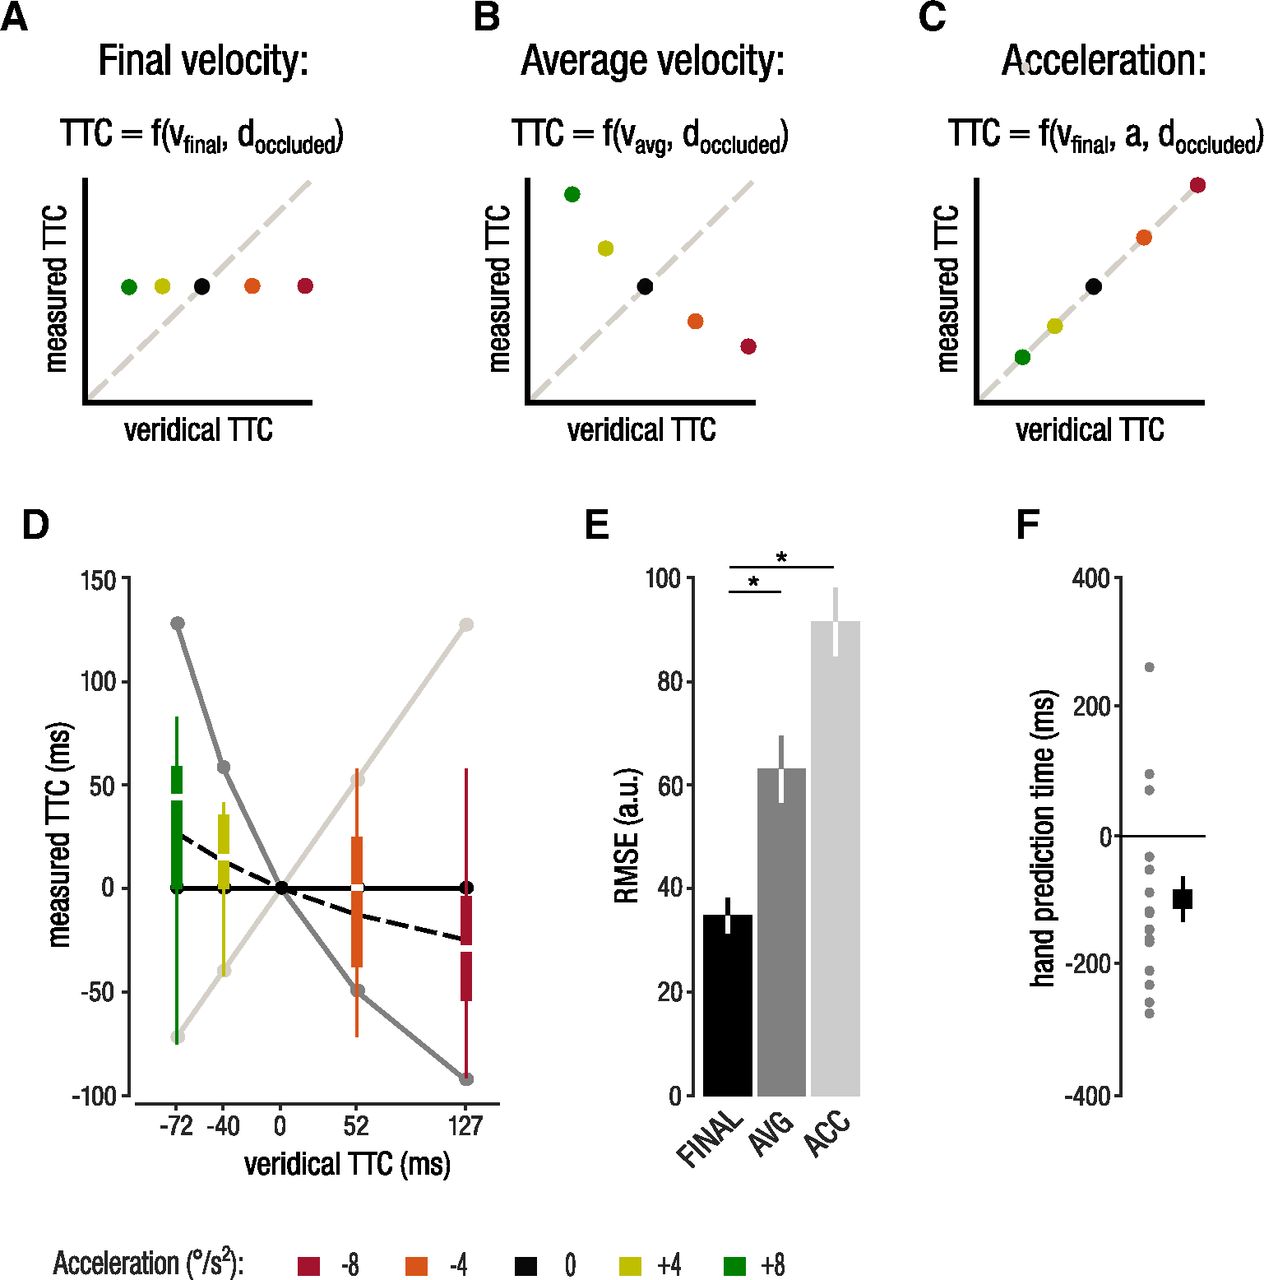
    Model comparison. A–C, Three competing models of how observers might predict TTC for predictive eye and interceptive hand movements. A, The final velocity model postulates that observers predict TTC based on vfinal (identical for all targets in our design, hence predicting a fixed TTC). B, The average velocity model predicts interception timing based on the average target velocity before occlusion, yielding a negative correlation between veridical and measured TTC. C, The acceleration model suggests that observers use target acceleration for interception and predicts the veridical TTC. D, Comparison of model predictions and measured TTChand data. Dashed line shows the TTC prediction based on the mean hand prediction times. E, Root mean squared errors for the competing models on TTChand. F, Individual and mean hand prediction times. Asterisks represent significant differences (p < 0.05).

  • Figure 8.
    • Download figure
    • Open in new tab
    • Download powerpoint
    Figure 8.

    Results from experiment 2. A, B, The model predictions of the final (A) and average velocity (B) models in experiment 2. C, Comparison of TTChand to the model predictions. E, Comparison of model fits. Asterisks represent significant differences (p < 0.05).

Back to top

In this issue

eneuro: 9 (5)
eNeuro
Vol. 9, Issue 5
September/October 2022
  • Table of Contents
  • Index by author
  • Ed Board (PDF)
Email

Thank you for sharing this eNeuro article.

NOTE: We request your email address only to inform the recipient that it was you who recommended this article, and that it is not junk mail. We do not retain these email addresses.

Enter multiple addresses on separate lines or separate them with commas.
Humans Can Track But Fail to Predict Accelerating Objects
(Your Name) has forwarded a page to you from eNeuro
(Your Name) thought you would be interested in this article in eNeuro.
CAPTCHA
This question is for testing whether or not you are a human visitor and to prevent automated spam submissions.
Print
View Full Page PDF
Citation Tools
Humans Can Track But Fail to Predict Accelerating Objects
Philipp Kreyenmeier, Luca Kämmer, Jolande Fooken, Miriam Spering
eNeuro 5 September 2022, 9 (5) ENEURO.0185-22.2022; DOI: 10.1523/ENEURO.0185-22.2022

Citation Manager Formats

  • BibTeX
  • Bookends
  • EasyBib
  • EndNote (tagged)
  • EndNote 8 (xml)
  • Medlars
  • Mendeley
  • Papers
  • RefWorks Tagged
  • Ref Manager
  • RIS
  • Zotero
Respond to this article
Share
Humans Can Track But Fail to Predict Accelerating Objects
Philipp Kreyenmeier, Luca Kämmer, Jolande Fooken, Miriam Spering
eNeuro 5 September 2022, 9 (5) ENEURO.0185-22.2022; DOI: 10.1523/ENEURO.0185-22.2022
Twitter logo Facebook logo Mendeley logo
  • Tweet Widget
  • Facebook Like
  • Google Plus One

Jump to section

  • Article
    • Abstract
    • Significance Statement
    • Introduction
    • Materials and Methods
    • Results
    • Discussion
    • Citation Diversity Statement
    • Footnotes
    • References
    • Synthesis
  • Figures & Data
  • Info & Metrics
  • eLetters
  • PDF

Keywords

  • acceleration
  • eye-hand coordination
  • manual interception
  • prediction
  • saccades
  • smooth pursuit

Responses to this article

Respond to this article

Jump to comment:

No eLetters have been published for this article.

Related Articles

Cited By...

More in this TOC Section

Research Article: New Research

  • Release of extracellular matrix components after human traumatic brain injury
  • Action intentions reactivate representations of task-relevant cognitive cues
  • Functional connectome correlates of laterality preferences: Insights into Hand, Foot, and Eye Dominance Across the Lifespan
Show more Research Article: New Research

Sensory and Motor Systems

  • Action intentions reactivate representations of task-relevant cognitive cues
  • Interference underlies attenuation upon relearning in sensorimotor adaptation
  • Rod Inputs Arrive at Horizontal Cell Somas in Mouse Retina Solely via Rod–Cone Coupling
Show more Sensory and Motor Systems

Subjects

  • Sensory and Motor Systems
  • Home
  • Alerts
  • Follow SFN on BlueSky
  • Visit Society for Neuroscience on Facebook
  • Follow Society for Neuroscience on Twitter
  • Follow Society for Neuroscience on LinkedIn
  • Visit Society for Neuroscience on Youtube
  • Follow our RSS feeds

Content

  • Early Release
  • Current Issue
  • Latest Articles
  • Issue Archive
  • Blog
  • Browse by Topic

Information

  • For Authors
  • For the Media

About

  • About the Journal
  • Editorial Board
  • Privacy Notice
  • Contact
  • Feedback
(eNeuro logo)
(SfN logo)

Copyright © 2025 by the Society for Neuroscience.
eNeuro eISSN: 2373-2822

The ideas and opinions expressed in eNeuro do not necessarily reflect those of SfN or the eNeuro Editorial Board. Publication of an advertisement or other product mention in eNeuro should not be construed as an endorsement of the manufacturer’s claims. SfN does not assume any responsibility for any injury and/or damage to persons or property arising from or related to any use of any material contained in eNeuro.