

Article Figures & Data
Figures
- Figure 1.
Examples of EEG artifact and nonartifact segments. A, 10 s of an EEG recording. Traces for 19 EEG channels specified on the y-axis are shown. Blue shaded regions show manually-annotated artifacts. Red and blue vertical lines indicate onsets (every 0.5 s) of artifact and nonartifact overlapping EEG segments, respectively. B, EEG segment containing an artifact and (C) EEG segment that does not contain an artifact. Both show preprocessed EEG signals of 1 s each. D, E, Time-frequency (TF) representations for the EEG channels highlighted in red in B and C, respectively. The color codes Z-score normalized TF power values.
- Figure 2.
The classifier predicts manually annotated artifacts and nonartifacts with good accuracy. A, Train- and validation-loss curves gradually decrease and converge as the training progresses with each training epoch for the classifier trained on expert-annotated artifacts and nonartifacts. B, The classifier trains poorly on the same data but with randomly sampled annotations, showing no decrease for the validation-loss curve and overfitting to the training set as indicated by the diverging loss curves. The mean curve ± SD (shaded area around the mean curve) over five test folds is shown. Subject-wise five-fold cross-validation was used in each case. The legend and y-axis are shared between A and B. C, The classifier separates expert-annotated artifacts from nonartifacts, and most EEG segments in each class are classified confidently and correctly. D, The random classifier cannot separate randomly labeled EEG segments and lacks confident predictions. The number of EEG segments is plotted on the y-axis, and the predicted probability that an EEG segment has an artifact on the x-axis. The legend and y-axis are shared between C and D. The second distribution inside D is a zoomed-in version of the main distribution with the same y-axis.
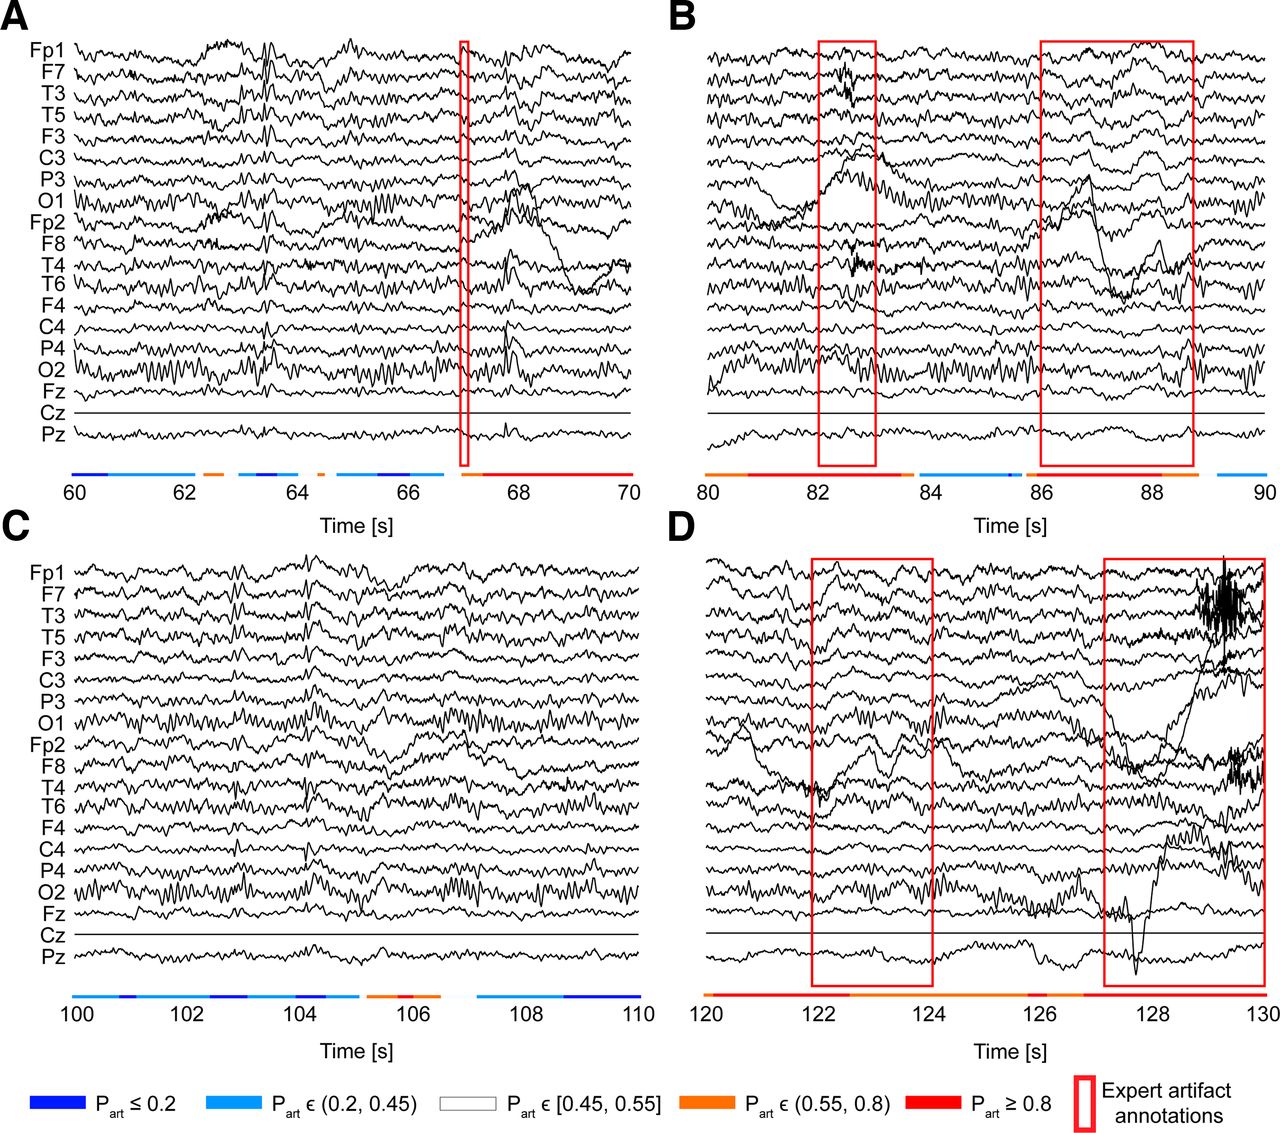
- Figure 3.
The model uncovers artifacts missed by the expert annotator. Examples of manually annotated EEG signals with corresponding model predictions from one of the recordings are shown. The model detected artifacts marked by the expert (A) at 67 s, (B) between 82 and 83 s and 86 and 89 s and (D) 122 and 124 s and 127 and 130 s. It also detected additional possible artifacts between (A) 67 and 70 s, (B) 80 and 82 s, (C) 105 and 107 s, (D) 120 and 122 s, and 124 and 127 s. Nineteen standard EEG channels are specified on the y-axis. The color bar below the signals represents probability-based predictions made by the CNN model. The color indicates one of the five categories of probability of an artifact
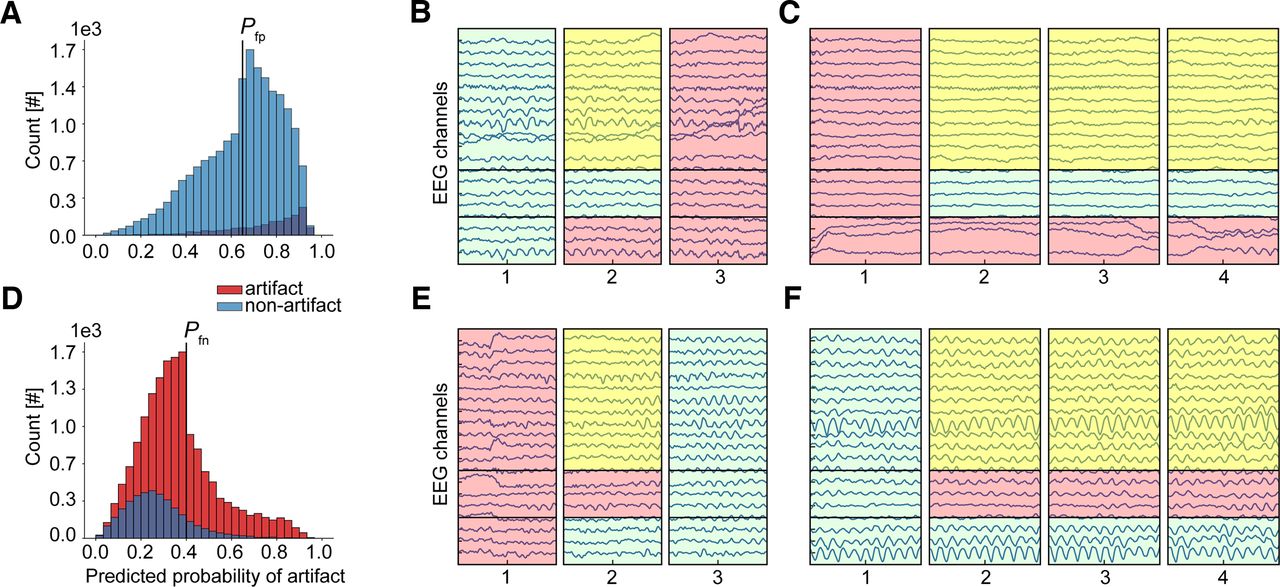
- Figure 4.
Examples of EEG segments selected for revision. Probability distributions of segments with predominantly false positive (A) and predominantly false negative (D) model predictions. Predicted probabilities that EEG segments have an artifact are depicted on the x-axis, and the legend shows original expert annotations. The selection was made based on the predicted probability range [0.65, 1] for A and [0, 0.4] for D, including segments that were adjacent to the selected segments in time, regardless of their predicted probability value. That is why one can see segments of both classes with predicted probabilities <0.65 or >0.4. Probability thresholds, Pfp and Pfn, are shown on the plots as black vertical lines with the corresponding label. B, C, E, F, Examples of EEG segments selected for revision. B and C show adjacent overlapping segments with false positive (rectangle 2 in B and rectangles 2, 3, and 4 in C), true positive (rectangle 3 in B and rectangle 1 in C), and true negative (rectangle 1 in B) predictions. E and F show adjacent overlapping segments with false negative (rectangle 2 in E and rectangles 2, 3, and 4 in F), true negative (rectangle 3 in E and rectangle 1 in F), and true positive (rectangle 1 in E) predictions. Horizontal lines in each example that separate each rectangle in three regions show areas that were shaded according to the predicted annotation (bottom), gold standard (middle), and revised label (top). The predicted annotation was decided based on the predicted probability threshold of 0.5 (nonartifact if the threshold probability was <0.5 and artifact if ≥0.5). The larger top area was shaded by default in yellow if there was a disagreement between the predicted annotation and the gold standard, in red if there was an agreement for an artifact, and in light green for a nonartifact. In the revision process, experts were presented with such segments to re-assess and make a final decision by changing or keeping the annotation in the top area. The experts were blind to the origin of annotations reflected in the bottom and middle regions, i.e., they did not know which was the predicted annotation and which was the gold standard.
- Figure 5.
Training and performance of the CNN classifier change after expert revision. A, Train- and validation-loss curves of the CNN classifier trained on the dataset with expert-revised segments (CNN-r) show improved converging dynamics as compared with the original classifier (CNN) and classifier trained on the same dataset where annotations of the revised segments were randomly generated (CNN-rrnd). The mean curve ± SD (shaded area around the mean curve) over five test folds is shown. Subject-wise fivefold cross-validation was used in each case. B, CNN-r classifier shows improved separation between artifact and nonartifact EEG segments. The two probability distributions inside the plot are the distributions of the original CNN classifier (CNN) and the classifier CNN-rrnd and show changes in the distribution shape. The number of EEG segments is plotted on the y-axis, and the predicted probability that an EEG segment has an artifact on the x-axis. The two small distributions in B have the same y-axis and x-axis scales as ones of the main distribution.
- Figure 6.
The CNN model becomes more confident in its predictions after expert revision. Distribution of the predicted artifact probabilities plotted for the subset of the revision data for which both expert decisions agreed with the original annotation shows agglomeration of values in a high-confidence range for the model trained on the dataset with expert-revised EEG segments (B) as compared with that of the model trained on the original dataset (A). D, E, The same trend is observed in the distributions plotted for the subset of the nonrevised portion of the data. G, H, Distributions are plotted for the subset of the revision data for which both experts changed the original annotation. G, Under the original gold standard, the CNN model trained on the original dataset predicted most nonartifacts with high probability of being artifacts, whereas (H) under the expert-revised gold standard, most of these segments changed their annotation to artifacts and were predicted with high probability of being artifacts by the CNN model trained on the dataset with expert-revised data. For all plots, the number of EEG segments is plotted on the y-axis, and the predicted probability that an EEG segment has an artifact on the x-axis. C, F, I, Examples of EEG segments for 19 EEG channels (y-axis) predicted by the models with original and revised annotations. Horizontal lines in each example that separate each rectangle in four regions show areas that are shaded according to the predicted annotation by the original CNN model (first from bottom), predicted annotation by the new CNN model (second from bottom), original gold standard (first from top), and revised gold standard (second from top). The predicted annotation was decided based on the predicted probability threshold of 0.5; nonartifact (in green) if the threshold probability was <0.5 and artifact (in red) if ≥0.5. CNN, classifier trained on the original dataset; CNN-r, classifier trained on the dataset with expert-revised data; Original GS, gold standard based on original expert annotations; Revised GS, gold standard based on expert-revised annotations.


Tables
- Table 2
Summary of hyperparameters, input/output sizes, and learnable parameters of the CNN architecture used for training
Layer Input size Filters Groups Kernel Output size Parameters Input (TF image with 19 channels) 19 × 45 × 100 - - - - - Convolutional (ReLU) 19 × 45 × 100 50 19 1 × 5
(stride 1 × 1)950 × 45 × 96 5700 Max-pooling 950 × 45 × 96 - - 1 × 2 × 2
(stride 1 × 2 × 2)950 × 22 × 48 - Convolutional (ReLU) 950 × 22 × 48 100 50 5 × 5
(stride 1 × 1)1900 × 18 × 44 904,400 Max-pooling 1900 × 18 × 44 - - 1 × 2 × 2
(stride 1 × 2 × 2)1900 × 9 × 22 - Convolutional (ReLU) 1900 × 9 × 22 150 - 3 × 3
(stride 1 × 1)150 × 7 × 20 2,565,150 Max-pooling 150 × 7 × 20 - - 1 × 1 × 1
(stride 1 × 1 × 1)150 × 7 × 20 - FC (linear) 21,000 - - - 2 42,000 Softmax 2 - - - 2 - Output (class distribution) - - - - 2 - Here, the input in the first layer is a TF image with 19 channels corresponding to 19 EEG channels, and the output of the last layer is a class probability distribution. No padding (i.e., an area of values, usually zeros, that can be added to the borders of the input, increasing its size) was used. For filter weights, we used Kaiming uniform initialization (He et al., 2015), a default in PyTorch implementation of the convolutional layers. Kernel, a two-dimensional matrix of weights that is convolved over the input (in convolutional layers). Multiple kernels form a filter. In pooling layers, there are no filters, and a kernel “summarizes” input values during each sliding step. Stride: a sliding step of a kernel in convolution or pooling. Max-pooling: dimension reduction involving replacing a patch of
Model Sensitivity % Specificity % Precision % bAcc % CNN
CNN-rnd71.0 ± 5.5
4.6 ± 3.178.1 ± 3.5
95.3 ± 3.359.7 ± 2.7
30.0 ± 3.574.6 ± 1.3
49.9 ± 0.2Average test performance scores are shown for four different metrics. CNN, classifier trained on expert-annotated EEG dataset; CNN-rnd, classifier trained on the same dataset where annotations were randomly generated with class probabilities equal to the ratio of examples in each class in the original dataset; bAcc, balanced accuracy. Mean ± SD values are shown. Subject-wise five-fold cross-validation was used in each case. Scores were calculated based on the probability threshold of 0.5.
- Table 4
The CNN classifier trained on the dataset with expert-revised EEG data shows increased test performance as compared with the original CNN classifier
Model Sensitivity % Specificity % Precision % bAcc % CNN
CNN-r
CNN-rrnd71.0 ± 5.5
73.5 ± 4.7
76.5 ± 4.278.1 ± 3.5
87.0 ± 2.0
83.4 ± 2.259.7 ± 2.7
76.7 ± 2.6
68.8 ± 2.174.6 ± 1.3
80.2 ± 1.7
79.9 ± 1.2Average test performance scores are shown for four different metrics. CNN, classifier trained on the original dataset (see Fig. 2; Table 3); CNN-r, classifier trained on the dataset with expert-revised EEG segments; CNN-rrnd, classifier trained on the same dataset where annotations of the revised segments were randomly generated with uniform class probabilities; bAcc, balanced accuracy. Mean ± SD values are shown. Subject-wise five-fold cross-validation was used in each case. Scores were calculated based on the probability threshold of 0.5.
- Table 5
Portion of the dataset revised by the two experts drives the changes in CNN training behavior and performance
Subset Gold standard Model Sensitivity % Specificity % Precision % bAcc % R-a Original ( =Revised) CNN 34.0 72.8 63.5 53.4 Revised ( =Original) CNN-r 33.8 71.4 62.1 52.6 nR-a Original ( =Revised) CNN 80.2 91.0 76.1 85.6 Revised ( =Original) CNN-r 79.6 90.5 74.8 85.0 R-d Original ( ≠Revised) CNN 0.0 1.6 0.0 0.8 Revised ( ≠Original) CNN-r 98.6 97.2 100 97.9 R-a, subset of the revision data for which both expert decisions agreed with the original annotation; nR-a, nonrevised portion of the data; R-d, portion of the revised set for which there was a disagreement between the original and revised annotation; Original, gold standard based on the original expert-annotated dataset; Revised, gold standard based on the dataset with expert-revised EEG segments; Original = Revised, in that subset of the data, the two gold standards agree; Original≠Revised: the two gold standards disagree in that subset of the data; CNN, classifier trained on the original expert-annotated dataset; CNN-r, classifier trained on the dataset with expert-revised EEG segments; bAcc, balanced accuracy. The scores were computed based on the probability threshold of 0.5.
Extended Data 1
The code used to perform preprocessing of the data and all experimental work. The zip file contains pipeline scripts arranged in subfolders indicating the order of execution, a txt file with all dependencies (requirements.txt), and a short description for each step of the pipeline (README.txt). Download Extended Data 1, ZIP file.
In this issue


