Main menu

  • HOME
  • CONTENT
    • Early Release
    • Featured
    • Current Issue
    • Issue Archive
    • Blog
    • Collections
    • Podcast
  • TOPICS
    • Cognition and Behavior
    • Development
    • Disorders of the Nervous System
    • History, Teaching and Public Awareness
    • Integrative Systems
    • Neuronal Excitability
    • Novel Tools and Methods
    • Sensory and Motor Systems
  • ALERTS
  • FOR AUTHORS
  • ABOUT
    • Overview
    • Editorial Board
    • For the Media
    • Privacy Policy
    • Contact Us
    • Feedback
  • SUBMIT

User menu

Search

  • Advanced search
eNeuro
eNeuro

Advanced Search


  • HOME
  • CONTENT
    • Early Release
    • Featured
    • Current Issue
    • Issue Archive
    • Blog
    • Collections
    • Podcast
  • TOPICS
    • Cognition and Behavior
    • Development
    • Disorders of the Nervous System
    • History, Teaching and Public Awareness
    • Integrative Systems
    • Neuronal Excitability
    • Novel Tools and Methods
    • Sensory and Motor Systems
  • ALERTS
  • FOR AUTHORS
  • ABOUT
    • Overview
    • Editorial Board
    • For the Media
    • Privacy Policy
    • Contact Us
    • Feedback
  • SUBMIT
PreviousNext
Research ArticleResearch Article: Methods/New Tools, Novel Tools and Methods

Measuring Nonapoptotic Caspase Activity with a Transgenic Reporter in Mice

P. J. Nicholls, Thomas F. Pack, Nikhil M. Urs, Sunil Kumar, Yang Zhou, Gabriel Ichim, Joshua D. Ginzel, Gabor Turu, Evan Calabrese, Wendy L. Roberts, Ping Fan, Valeriy G. Ostapchenko, Monica S. Guzman Lenis, Flavio Beraldo, Jiri Hatina, Vania F. Prado, Marco A. M. Prado, Ivan Spasojevic, Joshua C. Snyder, Kafui Dzirasa, G. Allan Johnson and Marc G. Caron
eNeuro 8 September 2022, 9 (5) ENEURO.0147-21.2022; https://doi.org/10.1523/ENEURO.0147-21.2022
P. J. Nicholls
1Department of Psychiatry and Behavioral Sciences, Duke University Medical Center, Durham, NC 27710
  • Find this author on Google Scholar
  • Find this author on PubMed
  • Search for this author on this site
  • ORCID record for P. J. Nicholls
Thomas F. Pack
2Department of Cell Biology, Duke University Medical Center, Durham, NC 27710
3Department of Pharmacology and Cancer Biology, Duke University Medical Center, Durham, NC 27710
  • Find this author on Google Scholar
  • Find this author on PubMed
  • Search for this author on this site
Nikhil M. Urs
2Department of Cell Biology, Duke University Medical Center, Durham, NC 27710
  • Find this author on Google Scholar
  • Find this author on PubMed
  • Search for this author on this site
  • ORCID record for Nikhil M. Urs
Sunil Kumar
1Department of Psychiatry and Behavioral Sciences, Duke University Medical Center, Durham, NC 27710
  • Find this author on Google Scholar
  • Find this author on PubMed
  • Search for this author on this site
Yang Zhou
2Department of Cell Biology, Duke University Medical Center, Durham, NC 27710
  • Find this author on Google Scholar
  • Find this author on PubMed
  • Search for this author on this site
Gabriel Ichim
10Center for Research on Cancer in Lyon, University of Lyon, Lyon 69008, France
  • Find this author on Google Scholar
  • Find this author on PubMed
  • Search for this author on this site
Joshua D. Ginzel
2Department of Cell Biology, Duke University Medical Center, Durham, NC 27710
  • Find this author on Google Scholar
  • Find this author on PubMed
  • Search for this author on this site
Gabor Turu
2Department of Cell Biology, Duke University Medical Center, Durham, NC 27710
  • Find this author on Google Scholar
  • Find this author on PubMed
  • Search for this author on this site
Evan Calabrese
4Department of Biomedical Engineering, Duke University Medical Center, Durham, NC 27710
5Center for In Vivo Microscopy, Department of Radiology, Duke University Medical Center, Durham, NC 27710
  • Find this author on Google Scholar
  • Find this author on PubMed
  • Search for this author on this site
Wendy L. Roberts
2Department of Cell Biology, Duke University Medical Center, Durham, NC 27710
  • Find this author on Google Scholar
  • Find this author on PubMed
  • Search for this author on this site
Ping Fan
6Department of Medicine, Duke University Medical Center, Durham, NC 27710
  • Find this author on Google Scholar
  • Find this author on PubMed
  • Search for this author on this site
Valeriy G. Ostapchenko
11Robarts Research Institute, University of Western Ontario, London, Ontario N6A 3K7, Canada
  • Find this author on Google Scholar
  • Find this author on PubMed
  • Search for this author on this site
Monica S. Guzman Lenis
11Robarts Research Institute, University of Western Ontario, London, Ontario N6A 3K7, Canada
12Department of Anatomy and Cell Biology, University of Western Ontario, London, Ontario N6A 3K7, Canada
  • Find this author on Google Scholar
  • Find this author on PubMed
  • Search for this author on this site
Flavio Beraldo
11Robarts Research Institute, University of Western Ontario, London, Ontario N6A 3K7, Canada
13Department of Physiology and Pharmacology, Schulich School of Medicine and Dentistry, University of Western Ontario, London, Ontario N6A 3K7, Canada
  • Find this author on Google Scholar
  • Find this author on PubMed
  • Search for this author on this site
Jiri Hatina
14Institute of Biology, Charles University, Plzen CZ-32300, Czech Republic
  • Find this author on Google Scholar
  • Find this author on PubMed
  • Search for this author on this site
Vania F. Prado
11Robarts Research Institute, University of Western Ontario, London, Ontario N6A 3K7, Canada
12Department of Anatomy and Cell Biology, University of Western Ontario, London, Ontario N6A 3K7, Canada
13Department of Physiology and Pharmacology, Schulich School of Medicine and Dentistry, University of Western Ontario, London, Ontario N6A 3K7, Canada
  • Find this author on Google Scholar
  • Find this author on PubMed
  • Search for this author on this site
  • ORCID record for Vania F. Prado
Marco A. M. Prado
11Robarts Research Institute, University of Western Ontario, London, Ontario N6A 3K7, Canada
12Department of Anatomy and Cell Biology, University of Western Ontario, London, Ontario N6A 3K7, Canada
13Department of Physiology and Pharmacology, Schulich School of Medicine and Dentistry, University of Western Ontario, London, Ontario N6A 3K7, Canada
  • Find this author on Google Scholar
  • Find this author on PubMed
  • Search for this author on this site
  • ORCID record for Marco A. M. Prado
Ivan Spasojevic
6Department of Medicine, Duke University Medical Center, Durham, NC 27710
  • Find this author on Google Scholar
  • Find this author on PubMed
  • Search for this author on this site
Joshua C. Snyder
2Department of Cell Biology, Duke University Medical Center, Durham, NC 27710
9Department of Surgery, Duke University Medical Center, Durham, NC 27710
  • Find this author on Google Scholar
  • Find this author on PubMed
  • Search for this author on this site
Kafui Dzirasa
1Department of Psychiatry and Behavioral Sciences, Duke University Medical Center, Durham, NC 27710
4Department of Biomedical Engineering, Duke University Medical Center, Durham, NC 27710
7Department of Neurobiology, Duke University Medical Center, Durham, NC 27710
  • Find this author on Google Scholar
  • Find this author on PubMed
  • Search for this author on this site
G. Allan Johnson
4Department of Biomedical Engineering, Duke University Medical Center, Durham, NC 27710
5Center for In Vivo Microscopy, Department of Radiology, Duke University Medical Center, Durham, NC 27710
8Department of Physics, Duke University, Durham, NC 27710
  • Find this author on Google Scholar
  • Find this author on PubMed
  • Search for this author on this site
Marc G. Caron
2Department of Cell Biology, Duke University Medical Center, Durham, NC 27710
6Department of Medicine, Duke University Medical Center, Durham, NC 27710
7Department of Neurobiology, Duke University Medical Center, Durham, NC 27710
  • Find this author on Google Scholar
  • Find this author on PubMed
  • Search for this author on this site
  • Article
  • Figures & Data
  • Info & Metrics
  • eLetters
  • PDF
Loading

Article Figures & Data

Figures

  • Tables
  • Figure 1.
    • Download figure
    • Open in new tab
    • Download powerpoint
    Figure 1.

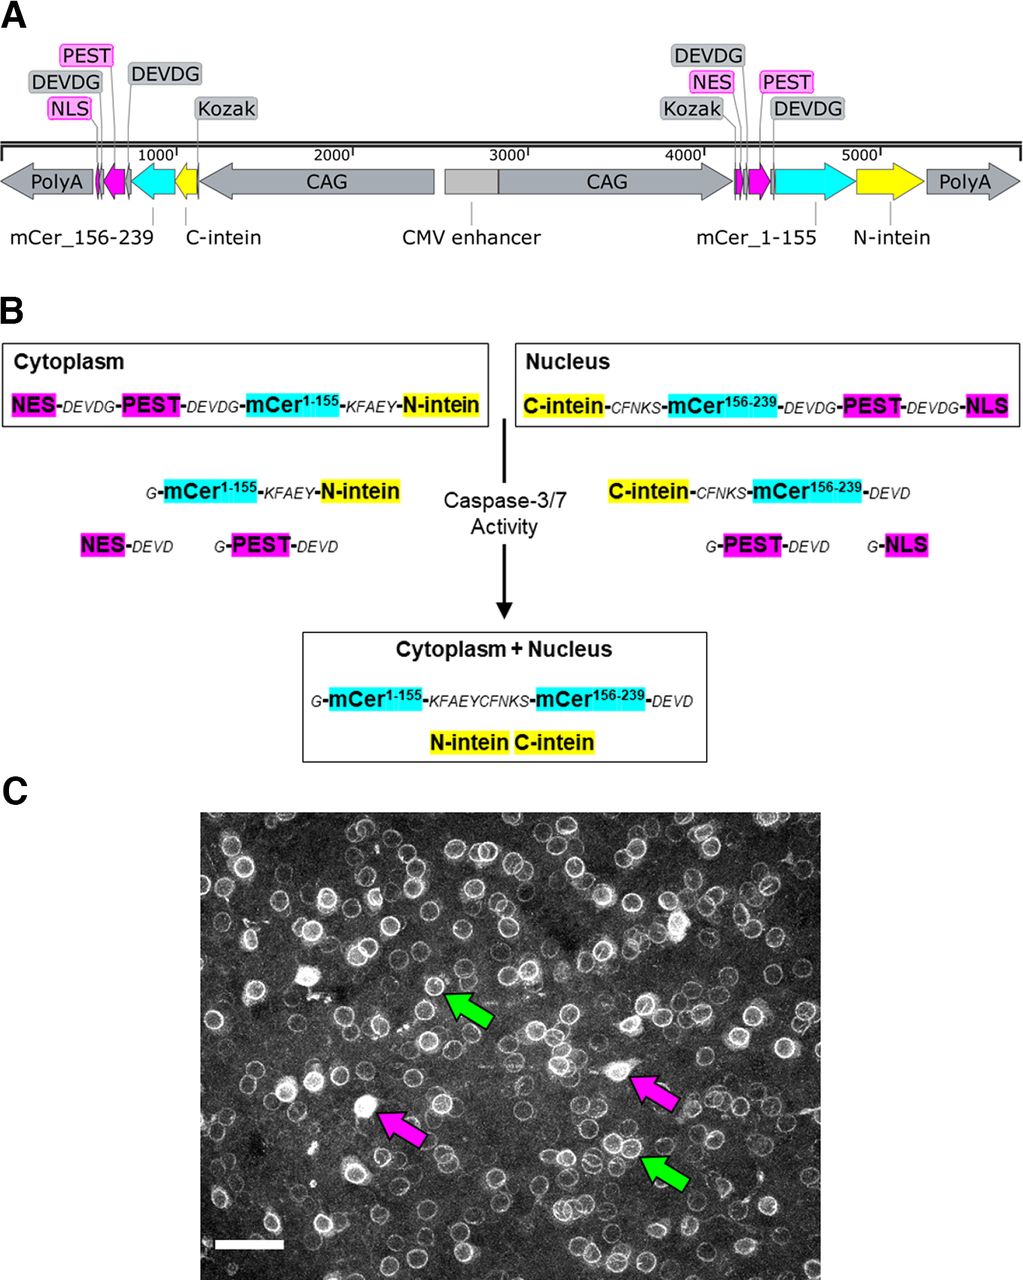
    Design of a transgenic caspase-3/7 activity reporter. A, Vector map. From left, Poly A, polyadenylation sequence; NLS, nuclear localization sequence; DEVDG, caspase cleavage site; PEST, protein degradation sequence; mCer, mCerulean fluorophore; C-, N-intein, carboxy-terminal and amino-terminal bacterial inteins; Kozak, initiation sequence; CAG, CAGGS promoter; NES, nuclear export sequence. B, Schematic of caspase-mediated and intein-mediated bimolecular fluorescence complementation. KFAEY, CFNKS, intein linkers; other abbreviations as in A. C, Examples of weak reporter signal at nuclear envelope (green arrows) and brighter reporter signal filling nucleus and soma (magenta arrows). Basolateral amygdala; scale bar, 50 μm. See also Table 2.

  • Figure 2.
    • Download figure
    • Open in new tab
    • Download powerpoint
    Figure 2.

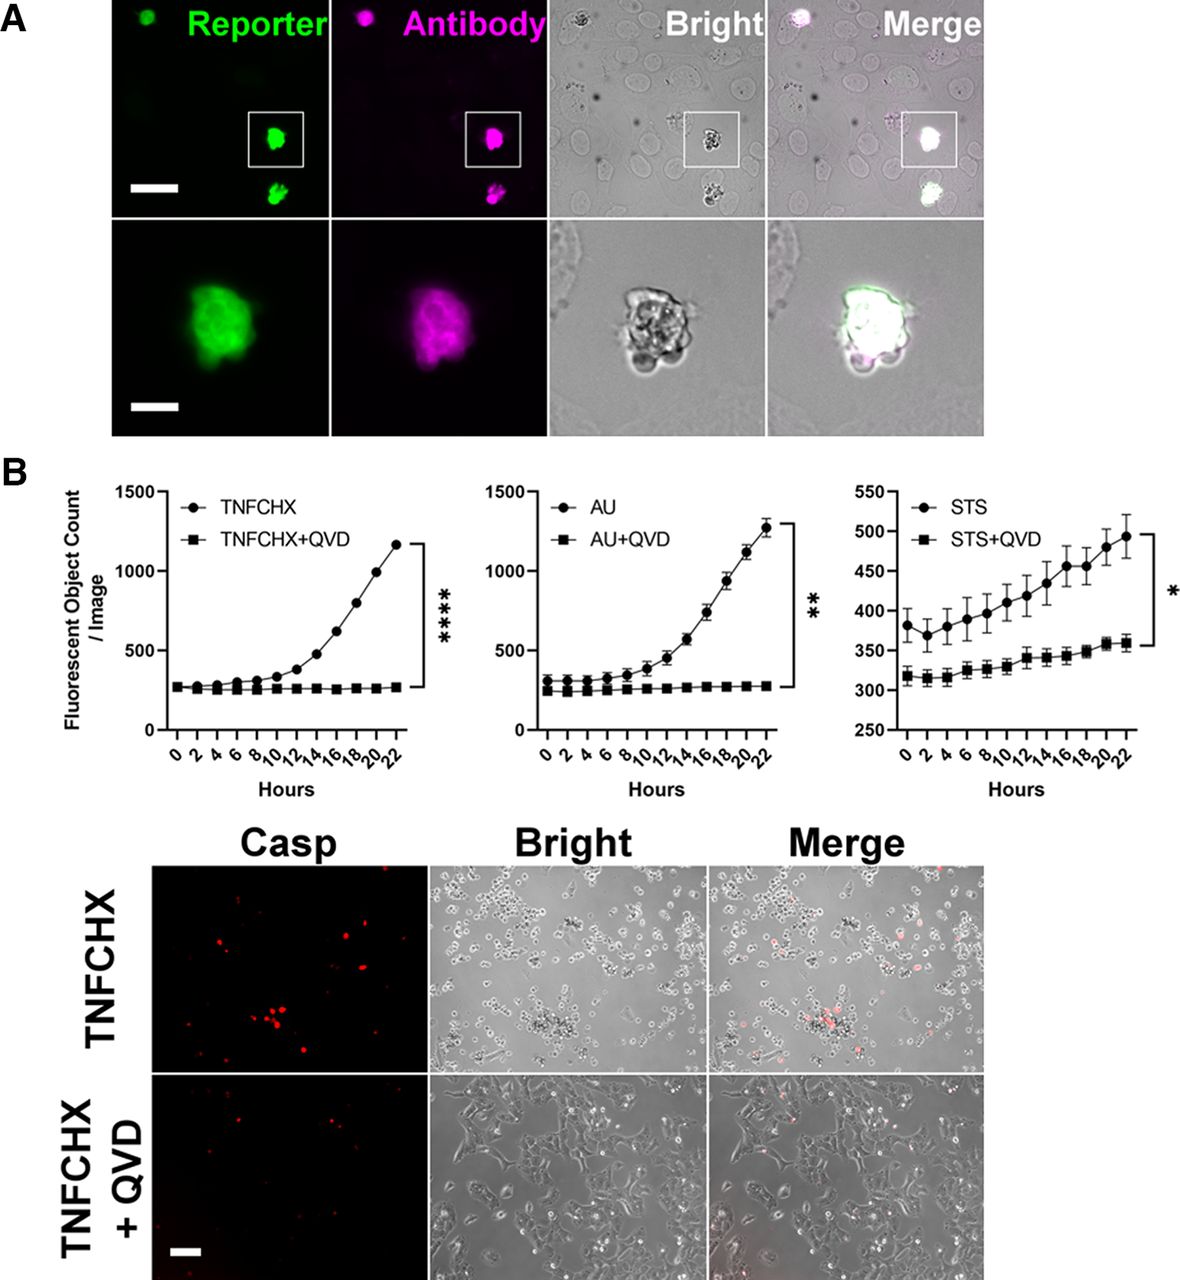
    Detection of apoptosis in vitro. A, In U2OS cells, transiently transfected caspase activity reporter (green) colocalized with cleaved caspase-3 antibody (magenta) in morphologically apoptotic cells (gray). Scale bar, 40 μm (above), 10 μm (below). B, Above, A375 melanoma cells transfected with caspase activity reporter then treated with apoptotic stimuli showed an increase in fluorescent signal that was abolished by the caspase inhibitor Q-VD-OPh (QVD, 20 μm). TNFCHX, hTNFa 20 ng/ml + cycloheximide 1 μg/ml; AU, ABT-736 10 μm + UMI-77 10 μm; STS, staurosporine 1 μm. Two-way RM-ANOVA (treatment: left, F(1,4) = 529.5; middle, F(1,4) = 47.88; right, F(1,4) = 10.78); mean ± SEM; n = 3. *p < 0.05, **p < 0.01, ****p < 0.0001. Below, Example of in vitro conditions. Casp, caspase activity reporter. Scale bar, 100 μm. See also Table 2.

  • Figure 3.
    • Download figure
    • Open in new tab
    • Download powerpoint
    Figure 3.

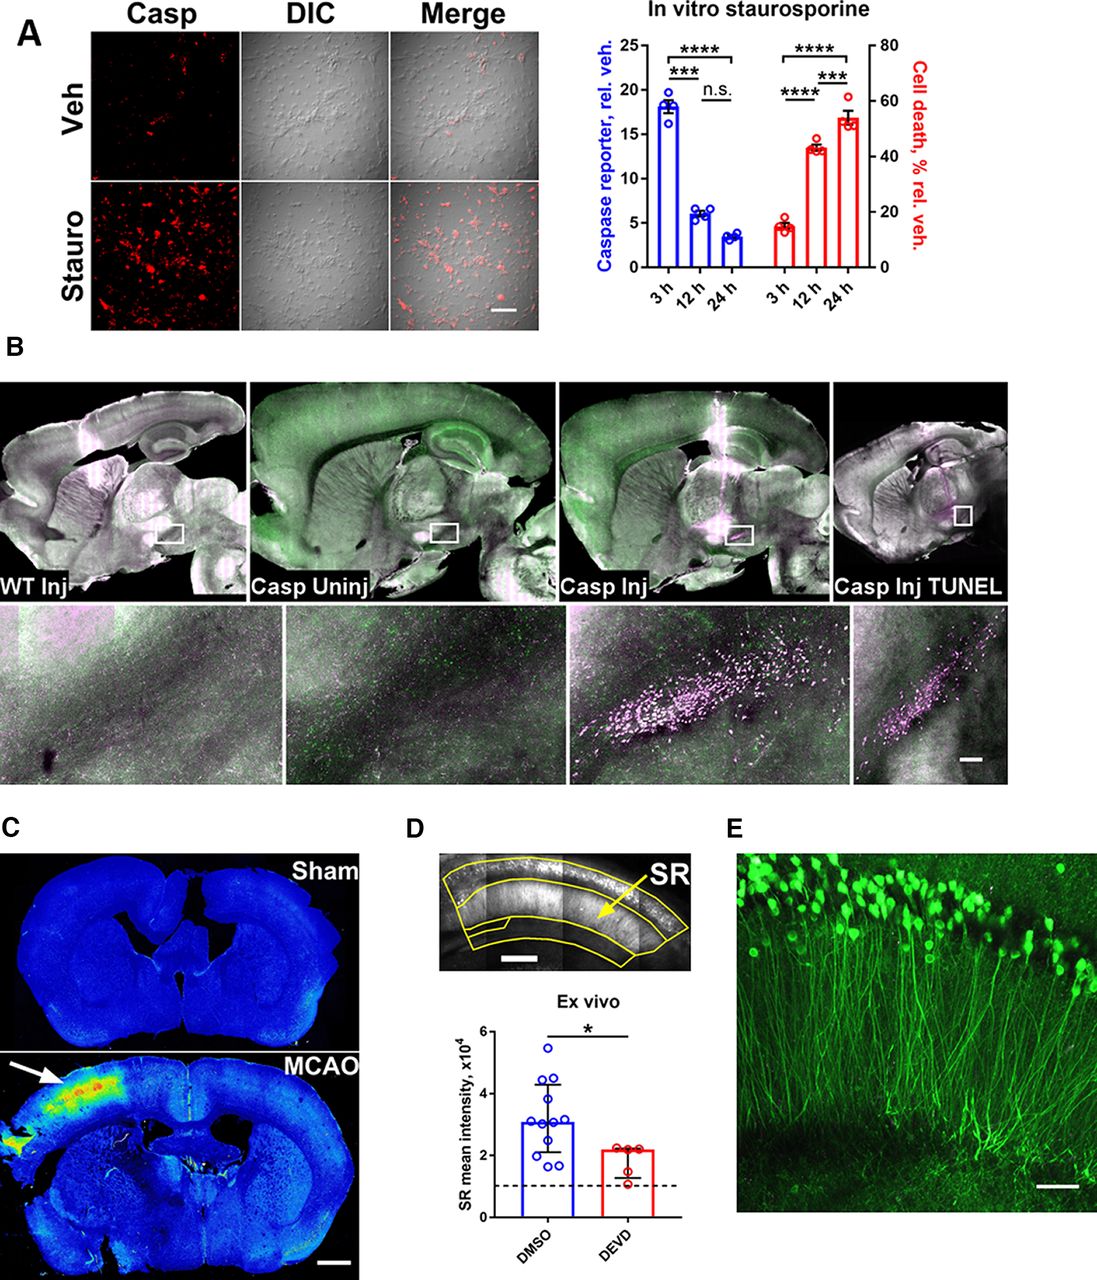
    Validation of a transgenic caspase-3/7 activity reporter. A, Representative data (left) and time course (right) of caspase reporter intensity and cell death in primary hippocampal neurons treated with 100 nm staurosporine. Two-way RM-ANOVA with Tukey’s multiple comparisons test (Reporter × Time F(2,12) = 216.7); mean ± SEM; n = 4. n.s., not significant, ***p < 0.001, ****p < 0.0001. Scale bar, 100 μm. B, Apoptotic reporter signal (magenta) in the substantia nigra pars compacta ipsilateral to a 6-hydroxydopamine injection (Casp Inj), but not contralateral to the injection (Casp Uninj) or in injected wild-type (WT Inj), and confirmed by TUNEL stain (Casp Inj TUNEL). Green (Casp Uninj, Casp Inj) represents nonapoptotic reporter signal. Scale bar, 100 μm. C, Caspase reporter distribution after MCAO (arrow) versus sham. Red-blue is high-low signal intensity. Scale bar, 1 mm. D, Attenuation of reporter signal by a caspase inhibitor (3.7 μm Z-DEVD-FMK) in acute hippocampal slices. SR, stratum radiatum. Dashed line denotes threshold of detection. Mann–Whitney test (U = 9); median ± IQR; n = 12 DMSO, 5 DEVD. *p < 0.05. Scale bar, 200 μm. E, Hippocampal nonapoptotic reporter signal is predominantly in neurons of the stratum pyramidale. Acute hippocampal slice. Scale bar, 50 μm. See also Table 2.

  • Figure 4.
    • Download figure
    • Open in new tab
    • Download powerpoint
    Figure 4.

    Separation of apoptotic and nonapoptotic reporter signal. A, Separation of nonapoptotic (above) from apoptotic (below) reporter signal by comparing short-wavelength (green) and long-wavelength (magenta) emission. Data are the same experiment as Figure 3B. Scale bar, 200 μm. B, Quantitative comparison of apoptotic and nonapoptotic reporter signal in short-wavelength (green) and long-wavelength (magenta) channels, derived from data used for Figure 7D (see Materials and Methods). C, Lack of colocalization between nonapoptotic reporter signal (green) and TUNEL stain (magenta) in the basolateral amygdala. Scale bar, 100 μm (above) and 25 μm (below). D, Colocalization of reporter signal (green) with TUNEL stain (magenta) in apoptotic epithelial cells of the choroid plexus. Scale bar, 100 μm (above) and 25 μm (below). E, Separation of apoptotic (row 1) from nonapoptotic (row 2) reporter signal in Purkinje cells of Arpc3 conditional knock-out mice, with and without Cre recombination. Scale bar, 100 μm (left) and 50 μm (right). F, Caspase reporter signal is present in shedding skin of a transgenic P0 mouse (left, Tg) and in apoptotic webbing between its toes (right). Weak signal in wild-type (WT) P0 mouse is autofluorescence in the stomach. See also Table 2.

  • Figure 5.
    • Download figure
    • Open in new tab
    • Download powerpoint
    Figure 5.

    Regional and cellular location of nonapoptotic reporter signal. A, Nonapoptotic reporter signal (green) in a clarified sagittal section of P22 brain. B, Nonapoptotic reporter signal in a coronal section of P44 brain (right). Left atlas tracing image credit: Allen Institute (Lein et al., 2007). Inset, Anterior basolateral amygdala. Scale bar, 100 μm. C, Nonapoptotic signal (green) is elevated in prelimbic cortex (PrL), hippocampus (Hipp), and anterior basolateral amygdala (aBLA). Scale bar, 1 mm (above) and 200 μm (below). D, RNA in situ hybridization against mCerulean (mCer, magenta). In the insets, note lack of colocalization with DAPI signal outside of the pyramidal cell layer. Scale bar, 500 μm (above) and 20 μm (below). See also Table 2.

  • Figure 6.
    • Download figure
    • Open in new tab
    • Download powerpoint
    Figure 6.

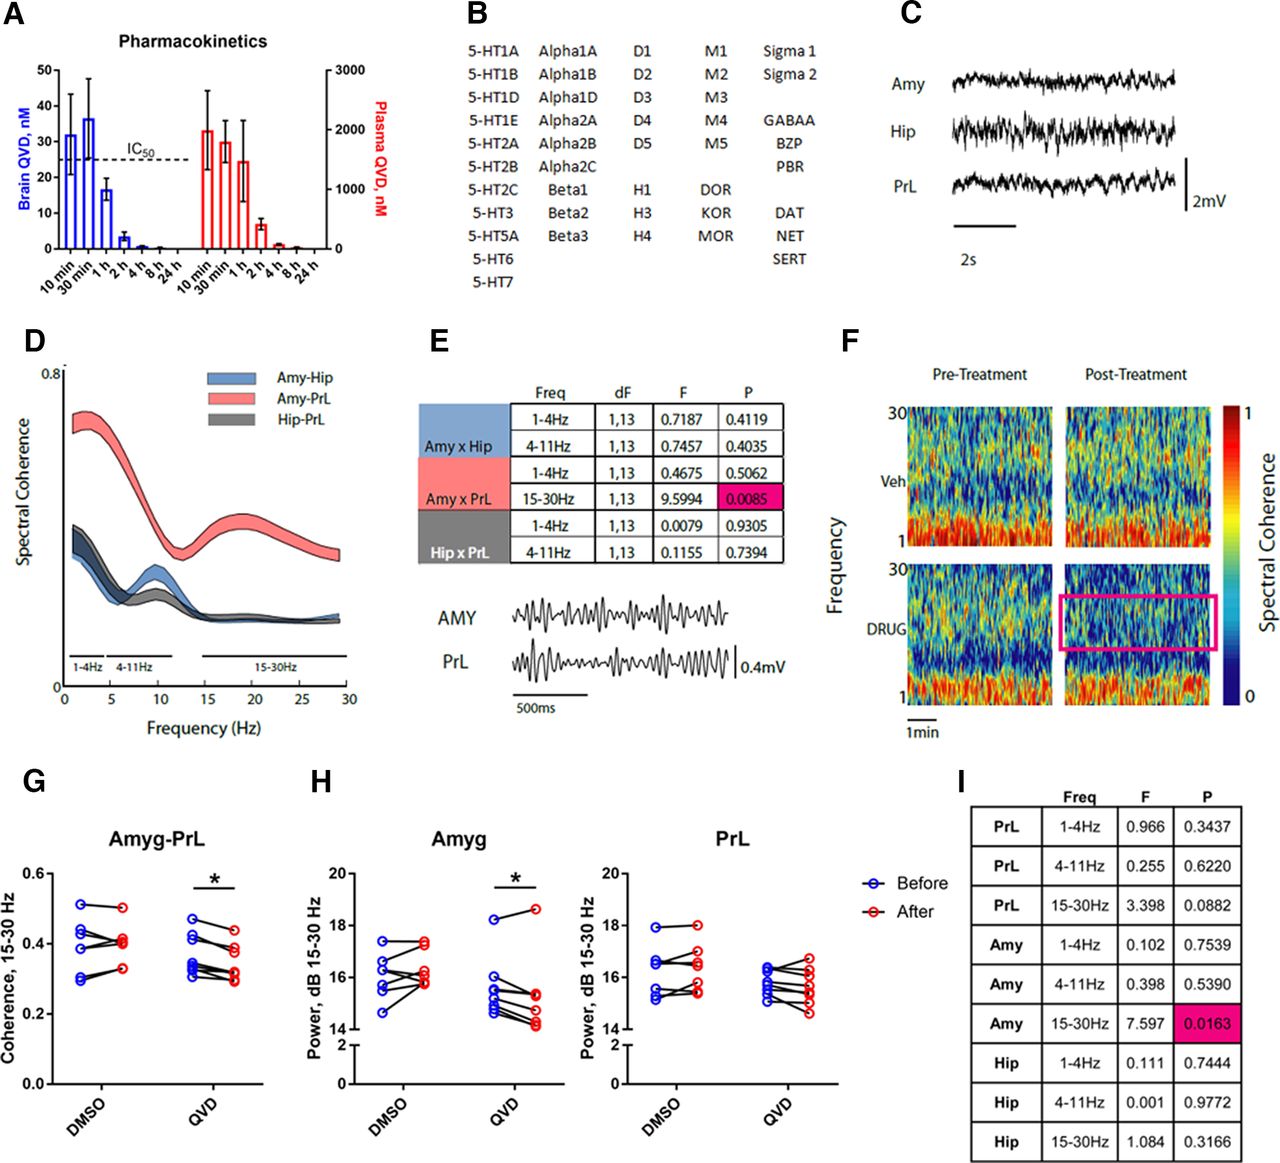
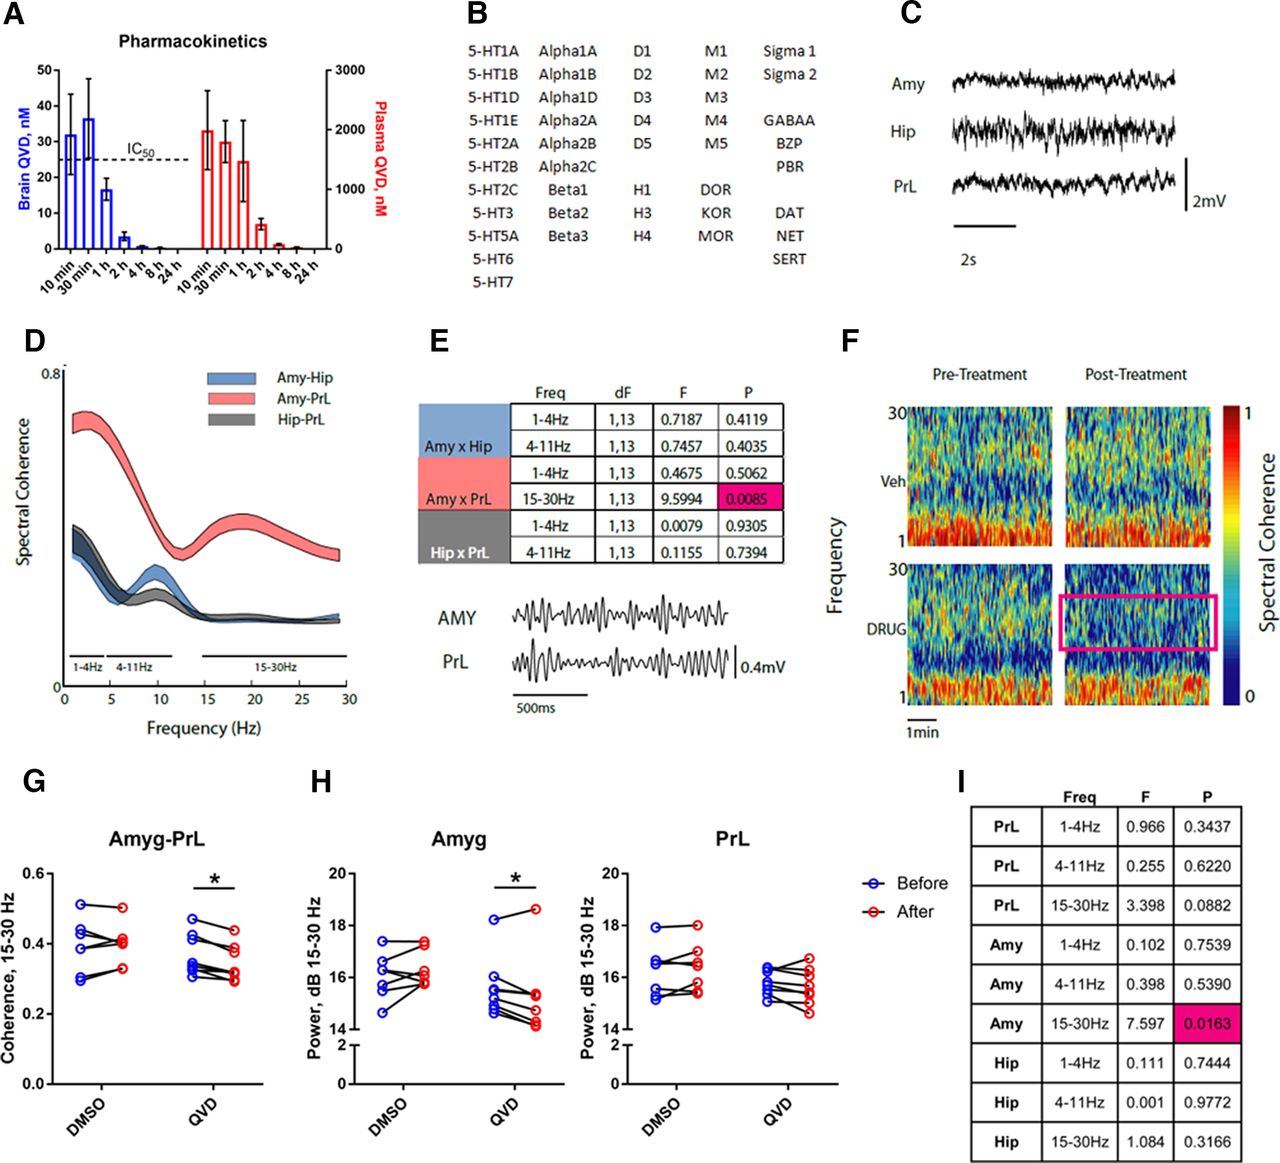
    NACA contributes to functional connectivity in a stress-associated amygdalar circuit. A, Pharmacokinetics of 5 mg/kg Q-VD-OPh in mouse brain and plasma after intraperitoneal injection. Mean ± SEM; three to five mice per time point. B, Receptors and transporters screened for interaction with Q-VD-OPh. C, Representative traces of LFPs recorded from amygdala (Amy), hippocampus (Hip), and prelimbic cortex (PrL) in a freely behaving mouse. D, Spectral coherence between three area pairs (Amy-Hip, Amy-PrL, and Hip-PrL). Data are presented as 95% confidence intervals; 15 mice. E, Table of spectral coherence differences across functional connectivity bands depicted in D, and representative β (15–30 Hz) frequency traces. Two-way RM-ANOVA with Box–Cox transform; magenta highlights significant value. F, Representative spectral coherence data between basal amygdala and prelimbic cortex. Magenta box shows decreased coherence after caspase inhibitor treatment. G, Reduced functional connectivity between basal amygdala and prelimbic cortex after caspase inhibitor treatment (QVD). Two-way RM-ANOVA with Sidak’s multiple comparisons test (Drug × Time F(1,13) = 6.594). H, Decreased LFP power after QVD treatment in basal amygdala (left), but not in prelimbic cortex (right). Two-way RM-ANOVA with uncorrected Fisher’s LSD (Drug × Time: left, F(1,13) = 6.811; right, F(1,13) = 3.343). I, Table of spectral power differences. Two-way RM-ANOVA with Box–Cox transform; magenta highlights significant value. D, E, G–I, n = 7 DMSO, 8 QVD; *p < 0.05.

  • Figure 7.
    • Download figure
    • Open in new tab
    • Download powerpoint
    Figure 7.

    NACA, the amygdala, and behavioral stress. A, Colocalization of reporter signal (Casp, green) with the neuronal marker myocyte enhancer factor 2 (MEF2, magenta) in basolateral amygdala. Scale bar, 200 μm (above) and 50 μm (below). B, Lack of colocalization of reporter signal (Casp, green) with (all magenta): parvalbumin (PVALB), glial fibrillary acidic protein (GFAP), and glutamic acid decarboxylase 67 kDa (GAD67). White arrows indicate cells with elevated antibody staining. Scale bar, 50 μm. C, Reduced baseline NACA in female mice. Dashed line represents threshold of detection. Mann–Whitney test (U = 20); median ± IQR; n = 9 M, 10 F. D, Left, Time course of the experiment. Middle, Representative caspase reporter intensity data (red-blue, high-low intensity). Right, Sex-specific increase in NACA 9 d after restraint stress. Dashed line denotes threshold of detection. Two-way ANOVA with Sidak’s multiple comparisons test (Sex × Stress F(1,37) = 9.931); mean ± SEM; n = 12 M. Cont., 11 M. Rest., 9 F Cont., 9 F Rest. from two independent experiments. Scale bar, 100 μm. *p < 0.05, **p < 0.01. See also Table 2.

Tables

  • Figures
    • View popup
    Table 1

    Stereotaxic Coordinates

    Brain areaAP coordinates (mm)ML coordinates (mm)DV coordinates (mm)
    PrL+1.8±0.25–1.75
    Amyg–1.46±2.85–3.9
    DHipp–2.4±1.63–1.25
    • View popup
    Table 2

    Imaging parameters

    FigureSpecimenPixel Size
    (μm)
    Z interval
    (μm)
    SlicesProjectionChannelsExcitation (nm)Emission (nm)System
    1CFixed0.41276MaximumSubtracted858470–550, 570–640Ti:sapphire laser, 20×/1.0 NA
    2AFixed0.1801N/ASingle, merged424–448 (green), 538–562
    (magenta), LED (gray)
    460–500 (green), 570–640
    (magenta), transmitted
    light (gray)
    Mercury arc lamp and LED,
    2.3×/0.57 NA
    2BIn vitro0.6401N/ASingle, merged450–490 (red), LED (gray)500–550 (red), transmitted
    light (gray)
    Mercury arc lamp and LED,
    10×/0.3 NA
    3AIn vitro0.5801N/ASingle, merged405 (red), 488 (gray)430–470 (red), transmitted
    light (gray)
    Diode laser (red), Ar laser
    (gray), 10×/0.4 NA
    3B, left 3Clarified3.292051MaximumMerged858470–550, 570–640Ti:sapphire laser, 20×/1.0 NA
    3B, TUNELDeclarified3.292011MaximumMerged1000470–550, 570–640Ti:sapphire laser, 20×/1.0 NA
    3CFixed2.4901N/ASingle458480–495Ar laser, 10×/0.4 NA
    3DAcute slice0.821015SumSubtracted858470–550, 570–640Ti:sapphire laser, 20×/1.0 NA
    3EAcute slice0.2221MaximumMerged858470–550, 570–640Ti:sapphire laser, 20×/1.0 NA
    4A, left 6Clarified3.292051MaximumSingle, merged858470–550, 570–640Ti:sapphire laser, 20×/1.0 NA
    4A, TUNELDeclarified3.292011MaximumMerged1000470–550, 570–640Ti:sapphire laser, 20×/1.0 NA
    4CFixed0.82541MaximumSingle, merged858470–550, 570–640Ti:sapphire laser, 20×/1.0 NA
    4DFixed0.82541MaximumSingle, merged858470–550, 570–640Ti:sapphire laser, 20×/1.0 NA
    4EFixed0.821021MaximumSingle (row 1),
    subtracted (row 2)
    858470–550, 570–640Ti:sapphire laser, 20×/1.0 NA
    4F, leftIn vivo9.2901N/ASingle424–448460–500Mercury arc lamp, 1×/0.25 NA
    4F, rightIn vivo9.2901N/ASingle424–448460–500Mercury arc lamp, 1×/0.25 NA
    5AClarified3.292051MaximumMerged858460–500, 520–550Ti:sapphire laser, 20×/1.0 NA
    5BFixed2.2701N/ASingle450–490500–550Mercury arc lamp,
    2.3×/0.57 NA
    5CFixed3.292014MaximumMerged858470–550, 570–640Ti:sapphire laser, 20×/1.0 NA
    5DFixed0.26212MaximumSingle, merged405 (gray), 561 (magenta)415–470 (gray), 570–607
    (magenta)
    Diode (gray), DPSS (magenta),
    40×/1.2 NA
    7AFixed0.82551MaximumSingle, merged858470–550 (green), 570–640
    (magenta)
    Ti:sapphire laser, 20×/1.0 NA
    7BFixed0.82517 (col 1),
    12 (col 2),
    3 (col 3)
    MaximumSingle, merged858470–550 (green), 570–640
    (magenta)
    Ti:sapphire laser, 20×/1.0 NA
    7DFixed0.55551MaximumSubtracted858470–550, 570–640Ti:sapphire laser, 20×/1.0 NA
    • Related to Figures 1-5 and 7.

Back to top

In this issue

eneuro: 9 (5)
eNeuro
Vol. 9, Issue 5
September/October 2022
  • Table of Contents
  • Index by author
  • Ed Board (PDF)
Email

Thank you for sharing this eNeuro article.

NOTE: We request your email address only to inform the recipient that it was you who recommended this article, and that it is not junk mail. We do not retain these email addresses.

Enter multiple addresses on separate lines or separate them with commas.
Measuring Nonapoptotic Caspase Activity with a Transgenic Reporter in Mice
(Your Name) has forwarded a page to you from eNeuro
(Your Name) thought you would be interested in this article in eNeuro.
CAPTCHA
This question is for testing whether or not you are a human visitor and to prevent automated spam submissions.
Print
View Full Page PDF
Citation Tools
Measuring Nonapoptotic Caspase Activity with a Transgenic Reporter in Mice
P. J. Nicholls, Thomas F. Pack, Nikhil M. Urs, Sunil Kumar, Yang Zhou, Gabriel Ichim, Joshua D. Ginzel, Gabor Turu, Evan Calabrese, Wendy L. Roberts, Ping Fan, Valeriy G. Ostapchenko, Monica S. Guzman Lenis, Flavio Beraldo, Jiri Hatina, Vania F. Prado, Marco A. M. Prado, Ivan Spasojevic, Joshua C. Snyder, Kafui Dzirasa, G. Allan Johnson, Marc G. Caron
eNeuro 8 September 2022, 9 (5) ENEURO.0147-21.2022; DOI: 10.1523/ENEURO.0147-21.2022

Citation Manager Formats

  • BibTeX
  • Bookends
  • EasyBib
  • EndNote (tagged)
  • EndNote 8 (xml)
  • Medlars
  • Mendeley
  • Papers
  • RefWorks Tagged
  • Ref Manager
  • RIS
  • Zotero
Respond to this article
Share
Measuring Nonapoptotic Caspase Activity with a Transgenic Reporter in Mice
P. J. Nicholls, Thomas F. Pack, Nikhil M. Urs, Sunil Kumar, Yang Zhou, Gabriel Ichim, Joshua D. Ginzel, Gabor Turu, Evan Calabrese, Wendy L. Roberts, Ping Fan, Valeriy G. Ostapchenko, Monica S. Guzman Lenis, Flavio Beraldo, Jiri Hatina, Vania F. Prado, Marco A. M. Prado, Ivan Spasojevic, Joshua C. Snyder, Kafui Dzirasa, G. Allan Johnson, Marc G. Caron
eNeuro 8 September 2022, 9 (5) ENEURO.0147-21.2022; DOI: 10.1523/ENEURO.0147-21.2022
Twitter logo Facebook logo Mendeley logo
  • Tweet Widget
  • Facebook Like
  • Google Plus One

Jump to section

  • Article
    • Abstract
    • Significance Statement
    • Introduction
    • Materials and Methods
    • Results
    • Discussion
    • Acknowledgments
    • Footnotes
    • References
    • Synthesis
    • Author Response
  • Figures & Data
  • Info & Metrics
  • eLetters
  • PDF

Keywords

  • caspases
  • in vivo reporter
  • nonapoptotic
  • mapping
  • amygdala
  • stress
  • sex differences

Responses to this article

Respond to this article

Jump to comment:

No eLetters have been published for this article.

Related Articles

Cited By...

More in this TOC Section

Research Article: Methods/New Tools

  • Cell Density Impacts Population Activity in Human iPSC-Derived Neural Networks
  • Adapting a Two-Photon Scanning Microscope for Simultaneous Single-Photon Imaging of an Infrared Dopamine Sensor
  • Age-Related Decline in Myelin Markers and Oligodendrocyte Density in Rhesus Macaque Prefrontal Cortex
Show more Research Article: Methods/New Tools

Novel Tools and Methods

  • Cell Density Impacts Population Activity in Human iPSC-Derived Neural Networks
  • Adapting a Two-Photon Scanning Microscope for Simultaneous Single-Photon Imaging of an Infrared Dopamine Sensor
  • Age-Related Decline in Myelin Markers and Oligodendrocyte Density in Rhesus Macaque Prefrontal Cortex
Show more Novel Tools and Methods

Subjects

  • Novel Tools and Methods
  • Home
  • Alerts
  • Follow SFN on BlueSky
  • Visit Society for Neuroscience on Facebook
  • Follow Society for Neuroscience on Twitter
  • Follow Society for Neuroscience on LinkedIn
  • Visit Society for Neuroscience on Youtube
  • Follow our RSS feeds

Content

  • Early Release
  • Current Issue
  • Latest Articles
  • Issue Archive
  • Blog
  • Browse by Topic

Information

  • For Authors
  • For the Media

About

  • About the Journal
  • Editorial Board
  • Privacy Notice
  • Contact
  • Feedback
(eNeuro logo)
(SfN logo)

Copyright © 2026 by the Society for Neuroscience.
eNeuro eISSN: 2373-2822

The ideas and opinions expressed in eNeuro do not necessarily reflect those of SfN or the eNeuro Editorial Board. Publication of an advertisement or other product mention in eNeuro should not be construed as an endorsement of the manufacturer’s claims. SfN does not assume any responsibility for any injury and/or damage to persons or property arising from or related to any use of any material contained in eNeuro.