

Article Figures & Data
Figures
- Figure 1.
Overview of experimental paradigm, image processing pipeline and neuroanatomical regions and identify of target structures used for primary cultures. A, The brain of postnatal day 0–2 mouse pups were dissected, and target structures isolated before cell dissociation and culture in 96-well plates for 10 DIV. B, Overview of the eight target structures and subsequent dissection strategy in four transgenic mouse lines (TH-GFP, DAT-Ai9, ChAT-Ai9, and SERT-Ai9). Additional images are from the Allen Developing Mouse Brain Atlas (Lein et al., 2007; Allen Brain Atlas, 2008). TH, tyrosine hydroxylase; MAP2, microtubule associated protein 2; DAPI: 4′,6-diamidino-2-phenylindole; LC, locus ceoruleus; DMV, dorsal motor nucleus of the vagus; XII, hypoglossal nucleus; SNc, substantia nigra pars compacta; VTA, ventral tegmental area; SERT, serotonin transporter; DAT, dopamine transporter; ChAT, choline acetyl-transferase.
- Figure 2.
Vulnerable neurons are more vulnerable to hydrogen peroxide than resilient neurons. Neurons were treated with hydrogen peroxide at 10 DIV, and fixed at 11 DIV. A, Example photomicrographs of all positive-identified neuron types across the vulnerable, and resilient target structures. B, Normalized number of positive neurons across hydrogen peroxide concentrations. Box and whiskers plots, in the style of Tukey, where the median value is indicated, and the lower and upper hinges correspond to the first and third quartiles. * = one-way ANOVA, Tukey’s HSD test, p < 0.05; * = pairwise t test, vulnerable versus resilient, p < 0.05. Detailed statistical tests and multiple comparisons can be found in Extended Data Table 2-1. TH, tyrosine hydroxylase; MAP2, microtubule associated protein 2; LC, locus ceoruleus; DMV, dorsal motor nucleus of the vagus; XII, hypoglossal nucleus; SNc, substantia nigra pars compacta; VTA, ventral tegmental area; R, raphé; STR, striatum.
- Figure 3.
Differential vulnerability between neurons to hydrogen peroxide. A–D, Normalized number of positive-neurons, for each concentration of hydrogen peroxide, and neuronal population. Box and whiskers plots, in the style of Tukey, where the median value is indicated, and the lower and upper hinges correspond to the first and third quartiles, Kruskal–Wallis multiple comparison, p-values adjusted with the Bonferroni method, *p < 0.05. Shared control estimation plot: mean difference for comparisons against the shared control, SNc, using Data Analysis with Bootstrap Estimation, with 5000 bootstrap resamples. All confidence intervals are bias-corrected and accelerated. Detailed statistical tests and multiple comparisons can be found in Extended Data Table 3-1. LC, locus ceoruleus; DMV, dorsal motor nucleus of the vagus; XII, hypoglossal nucleus; SNc, substantia nigra pars compacta; VTA, ventral tegmental area; R, raphé; STR, striatum.
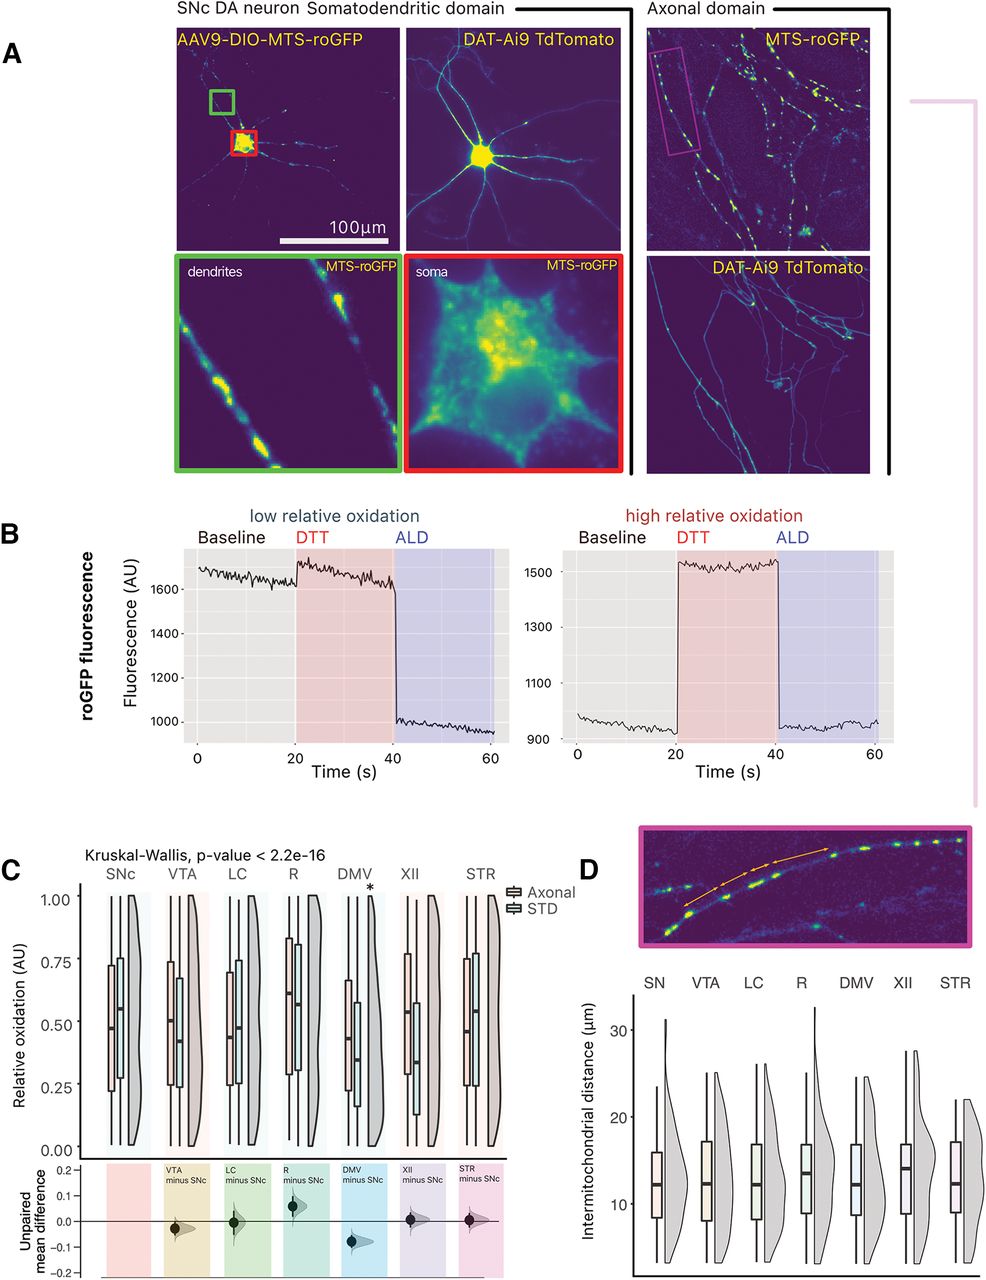
- Figure 4.
No overt difference in ROS production is observed between neurons. A, The redox sensitive GFP, roGFP, was expressed in a cre-dependent manner in target neurons. Photomicrographs of roGFP in a TdTomato-positive SNc DA neuron, in the somatodendritic (STD) compartment and in the axonal compartment. B, Example traces of GFP fluorescence arbitrary units (AU) in responsive ROIs, in an SNc DA neuron. Two traces are shown: for a GFP-positive puncta showing low relative oxidation status, and for a GFP-positive puncta showing high relative oxidation status. C, Quantification of the relative oxidative state of mitochondria across neuron types. Box and whiskers plots, in the style of Tukey, where the median value is indicated, and the lower and upper hinges correspond to the first and third quartiles, Kruskal–Wallis multiple comparison, p-values adjusted with the Bonferroni method, *p < 0.05. Shared control estimation plot: mean difference for comparisons against the shared control, SNc, using Data Analysis with Bootstrap Estimation, with 5000 bootstrap resamples. All confidence intervals are bias-corrected and accelerated. D, Quantification of intermitochondrial distance in the axonal domain (measured from the center of each GFP positive puncta). Box and whiskers plots, in the style of Tukey, where the median value is indicated, and the lower and upper hinges correspond to the first and third quartiles, Kruskal–Wallis p > 0.05. Density plots show distribution of individual measurements. Detailed statistical tests and multiple comparisons can be found in Extended Data Tables 4-1 and 4-2. Extended Data Figure 4-1 also provides micrographs showing the expression of MTSroGFP in locus coeruleus neurons and comparative data on the relative oxidation in the somatodendritic and axon domain of the different neuron types, as well as the normalized number of DAPI-positive nuclei in the neuron survival experiments performed with hydrogen peroxide. LC, locus ceoruleus; DMV, dorsal motor nucleus of the vagus; XII, hypoglossal nucleus; SNc, substantia nigra pars compacta; VTA, ventral tegmental area; R, raphé; STR, striatum.
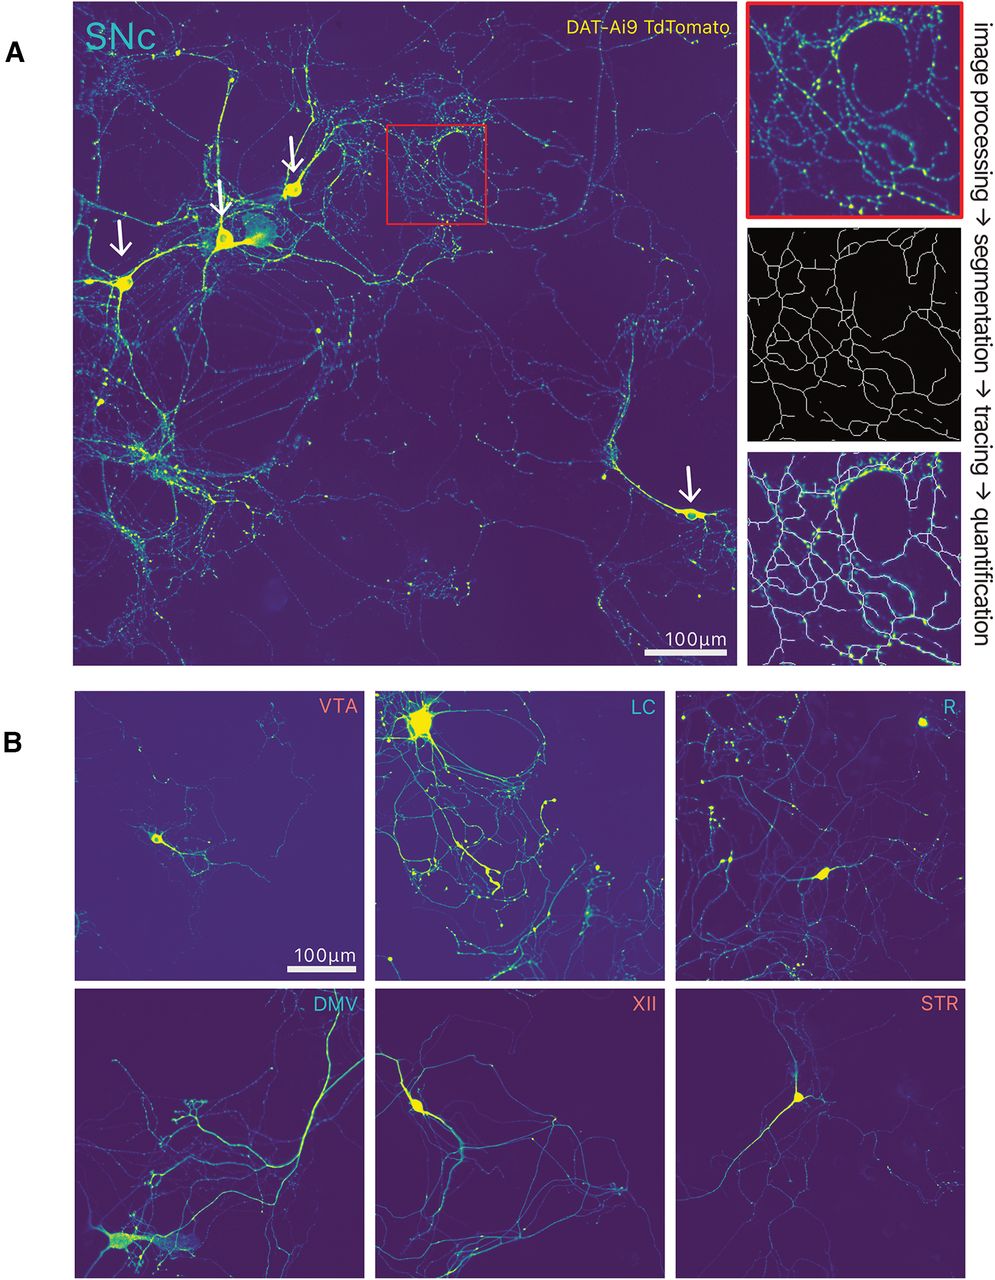
- Figure 5.
Overview of neurite tracing for quantification. A, Photomicrograph of SNc DA neurons, and overview of neurite quantification method. B, Photomicrographs illustrating the different types of neurons examined, with their neurochemical marker immunocytochemistry. LC, locus ceoruleus; DMV, dorsal motor nucleus of the vagus; XII, hypoglossal nucleus; SNc, substantia nigra pars compacta; VTA, ventral tegmental area; R, raphé; STR, striatum.
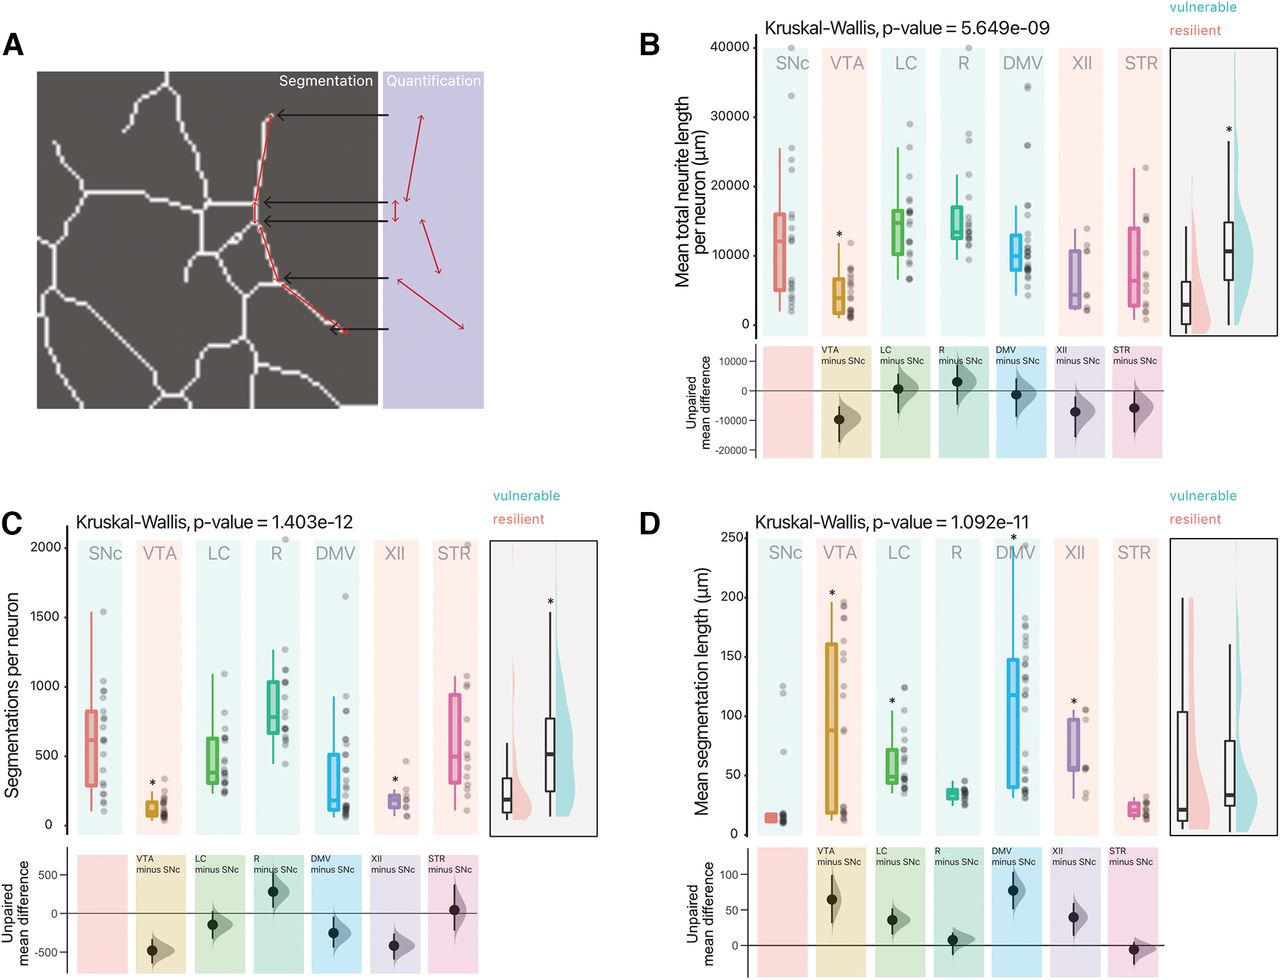
- Figure 6.
Vulnerable neurons have large axonal domains, which are globally more complex than resilient neurons. A, Overview of quantification method for neurite segmentations. B, Quantification of mean neurite length (total neurite length, per well, divided by number of neurons). Box and whiskers plots, in the style of Tukey, where the median value is indicated, and the lower and upper hinges correspond to the first and third quartiles, Kruskal–Wallis multiple comparison, p-values adjusted with the Bonferroni method, *p < 0.05. Shared control estimation plot: mean difference for comparisons against the shared control, SNc, using Data Analysis with Bootstrap Estimation, with 5000 bootstrap resamples. All confidence intervals are bias-corrected and accelerated. C, Quantification of mean number of segmentations (sections) of neurites segmented per neuron. Box and whiskers plots, in the style of Tukey, where the median value is indicated, and the lower and upper hinges correspond to the first and third quartiles, Kruskal–Wallis multiple comparison, p-values adjusted with the Bonferroni method, *p < 0.05. Shared control estimation plot: mean difference for comparisons against the shared control, SNc, using Data Analysis with Bootstrap Estimation, with 5000 bootstrap resamples. All confidence intervals are bias-corrected and accelerated. D, Quantification of mean length of segmentations (sections) of neurites segmented per neuron. Box and whiskers plots, in the style of Tukey, where the median value is indicated, and the lower and upper hinges correspond to the first and third quartiles, Kruskal–Wallis multiple comparison, p-values adjusted with the Bonferroni method, *p < 0.05. Shared control estimation plot: mean difference for comparisons against the shared control, SNc, using Data Analysis with Bootstrap Estimation, with 5000 bootstrap resamples. All confidence intervals are bias-corrected and accelerated. B to C have a supplementary plot of all data grouped as Vulnerable and Resilient, where an independent two-group Mann–Whitney U test was performed, and an asterisk denotes p < 0.05. Precise values can be found in the supplementary tables alongside unpaired Gardner–Altman two group estimation plots. Detailed statistical tests and multiple comparisons can be found in Extended Data Table 6-1. LC, locus ceoruleus; DMV, dorsal motor nucleus of the vagus; XII, hypoglossal nucleus; SNc, substantia nigra pars compacta; VTA, ventral tegmental area; R, raphé; STR, striatum.
- Figure 7.
Identification of potential functional axonal varicosities by Syt-1 immunocytochemistry. A, Overview of the image analysis strategy used for quantification of Syt-1 positivity of varicosities, and distribution of Syt-1 intensity within varicosities (bottom right).Arbitrary units (AU) B, Photomicrographs of axonal fields of neurons, with their neurochemical marker and Syt-1 immunocytochemistry. LC, locus ceoruleus; DMV, dorsal motor nucleus of the vagus; XII, hypoglossal nucleus; SNc, substantia nigra pars compacta; VTA, ventral tegmental area; R, raphé; STR, striatum.
- Figure 8.
Vulnerable neurons have a higher proportion of varicosities that are positive for Syt-1. A, Density plot of Syt-1 intensity [arbitrary units (AU), fluorescence] in all segmented varicosities included for analysis (red line indicate quintiles). B, Quantification of the proportion of varicosities that are positive for Syt-1. Box and whiskers plots, in the style of Tukey, where the median value is indicated, and the lower and upper hinges correspond to the first and third quartiles, Kruskal–Wallis multiple comparison, p-values adjusted with the Bonferroni method, *p < 0.05. Shared control estimation plot: mean difference for comparisons against the shared control, SNc, using Data Analysis with Bootstrap Estimation, with 5000 bootstrap resamples. All confidence intervals are bias-corrected and accelerated. C, Quantification of intervaricose distance (nearest neighbor analysis of segmentations). Box and whiskers plots, in the style of Tukey, where the median value is indicated, and the lower and upper hinges correspond to the first and third quartiles, Kruskal–Wallis multiple comparison, p-values adjusted with the Bonferroni method, *p < 0.05. Shared control estimation plot: mean difference for comparisons against the shared control, SNc, using Data Analysis with Bootstrap Estimation, with 5000 bootstrap resamples. All confidence intervals are bias-corrected and accelerated. D, Mean number of varicosities per unit length of axonal domain. Box and whiskers plots, in the style of Tukey, where the median value is indicated, and the lower and upper hinges correspond to the first and third quartiles, Kruskal–Wallis multiple comparison, p-values adjusted with the Bonferroni method, *p < 0.05. Shared control estimation plot: mean difference for comparisons against the shared control, SNc, using Data Analysis with Bootstrap Estimation, with 5000 bootstrap resamples. All confidence intervals are bias-corrected and accelerated. B to C have a supplementary plot of all data grouped as vulnerable and resilient, where an independent two-group Mann–Whitney U test was performed, and an asterisk denotes p < 0.05. Precise values can be found in the supplementary tables alongside unpaired Gardner–Altman two group estimation plots. Detailed statistical tests and multiple comparisons can be found in Extended Data Table 8-1. LC, locus ceoruleus; DMV, dorsal motor nucleus of the vagus; XII, hypoglossal nucleus; SNc, substantia nigra pars compacta; VTA, ventral tegmental area; R, raphé; STR, striatum.


Extended Data
Extended Data Table 2-1
Statistical reporting for Figure 2B. Download Table 2-1, DOCX file.
Extended Data Table 3-1
Statistical reporting for Figure 3A–D. Download Table 3-1, DOCX file.
Extended Data Figure 4-1
A, Expression of MTSroGFP in locus coeruleus neurons. Photomicrographs of a LC noradrenergic neuron infected with AAV9-TH-MTSroGFP. The neuron is identified by the presence of TH (red). MTSroGFP is shown in green. Nuclei, stained with DAPI, are shown in blue. B, Comparing relative oxidation in neuron types and in somatodendritic domain and axons shows only very small differences. Compared with Welch two-sample t test. C, Normalized number of nuclei (DAPI-positive) across hydrogen peroxide concentrations. Box and whiskers plots, in the style of Tukey, where the median value is indicated, and the lower and upper hinges correspond to the first and third quartiles. * = one-way ANOVA, Tukey’s HSD test, p < 0.05; * = pairwise t test, vulnerable versus resilient, p < 0.05. Download Figure 4-1, TIF file.
Extended Data Table 4-1
Statistical reporting for Figure 4C. Download Table 4-1, DOCX file.
Extended Data Table 4-2
Statistical reporting for Figure 4D. Download Table 4-2, DOCX file.
Extended Data Table 6-1
Statistical reporting for Figure 6B–D. Download Table 6-1, DOCX file.
Extended Data Table 8-1
Statistical reporting for Figure 8B–D. Download Table 8-1, DOCX file.
In this issue


