

Article Figures & Data
Figures
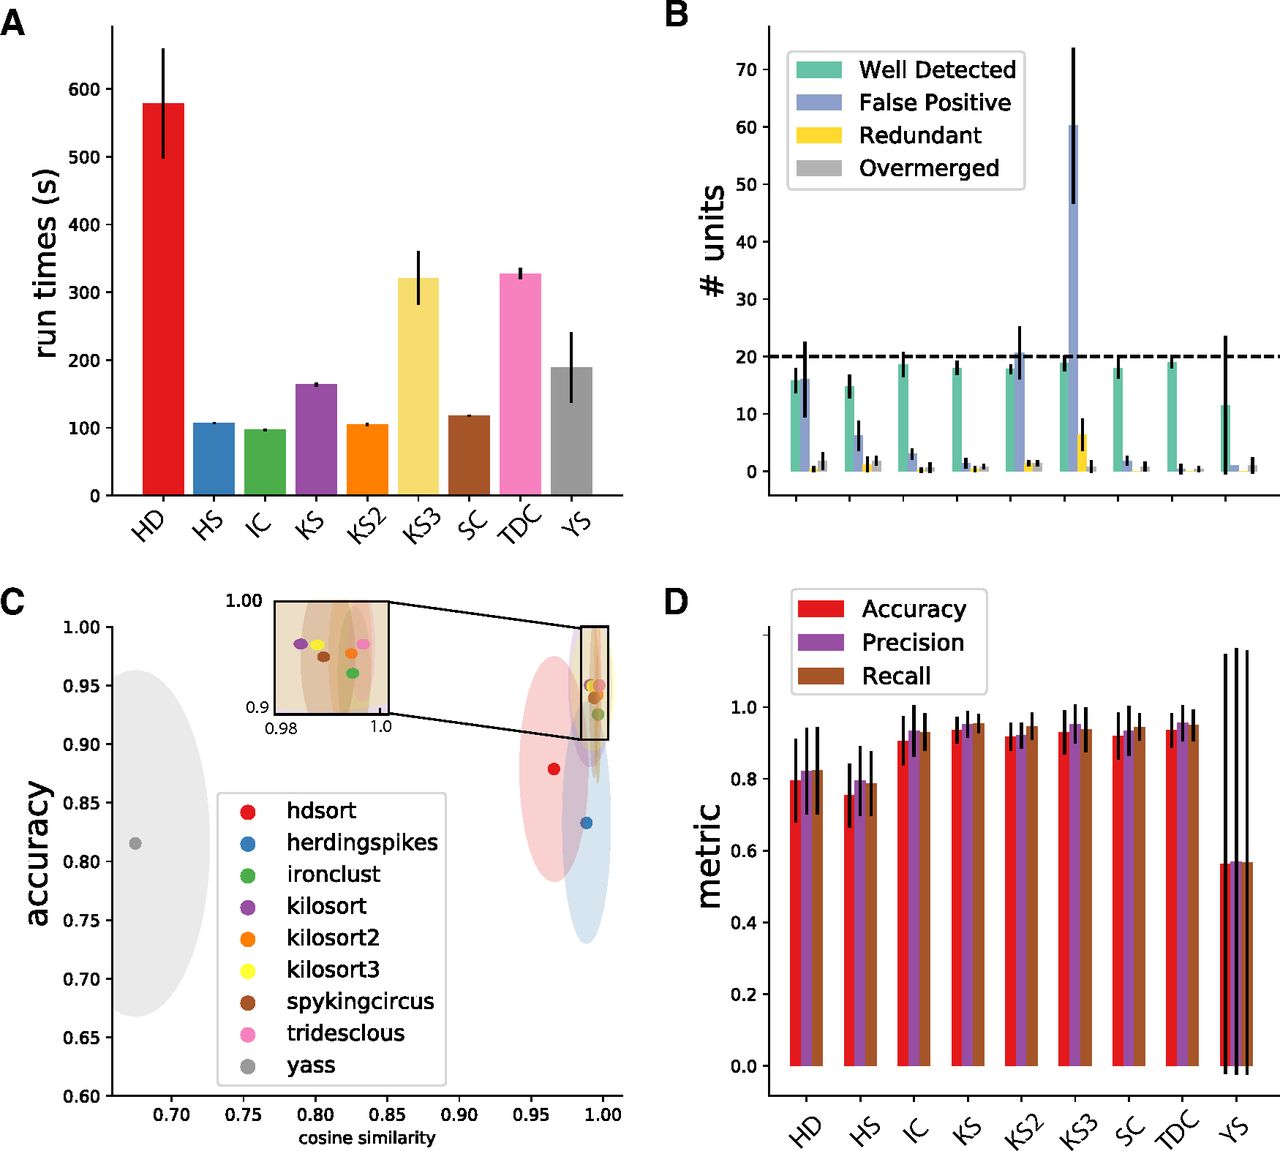
- Figure 2.
Spike sorting performance. A, Average run times over five different recordings (see Materials and Methods) for all the tested sorters. Errors bars indicate the SD over multiple recordings. B, Average number of cells found by the sorters that are either well detected, redundant, overmerged, or considered as FP (see Materials and Methods). Error bars indicates SD over multiple recordings. C, The average cosine similarity between templates found by the sorters and ground-truth templates, as function of the accuracy for the given neurons. Ellipses shows standard error of the means in cosine similarity (x-axis) and accuracy (y-axis). D, Average metrics (accuracy, precision, recall; see Materials and Methods) for all the sorters. Error bars show SD over multiple recordings.
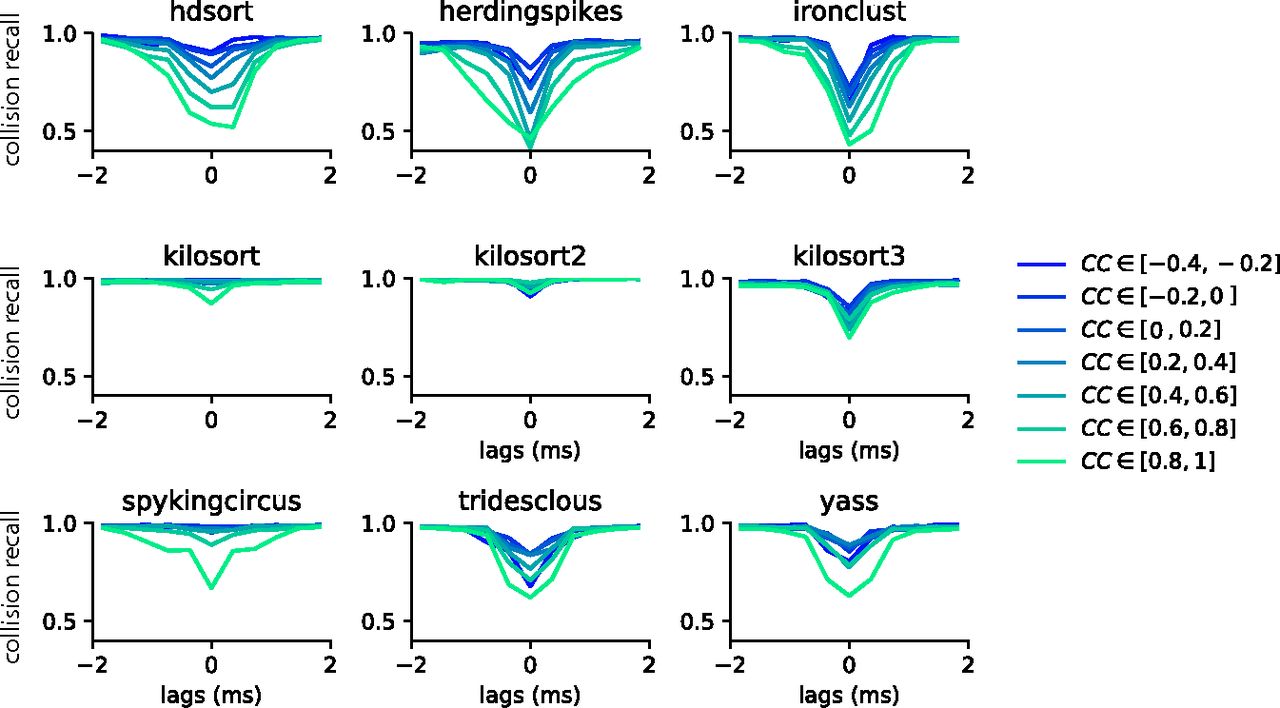
- Figure 3.
Collision recall per sorter. Error (quantified as the collision recall; see Materials and Methods) for various sorters and for all possible lags (between −2 and 2 ms), as function of the similarity between the pairs of templates (color code). All curves are averaged over multiple pairs and multiple recordings (see Materials and Methods).
- Figure 6.
Average performances of the spike sorters as function of the temporal lags. Each panel shows the average collision recall for template pairs with a similarity above 0.5 for a different condition, in terms of firing rate and correlation levels.
- Figure 1.
Generation of the synthetic recordings. A, A total of 20 cells are randomly placed in front of a 32-channel NeuroNexus probe layout. The plot shows the location of each cell for one recording. B, Sample template pairs generated by neurons with different cosine similarity values. C, Cosine similarity matrix between all pairs of templates for a sample recording. D, Cosine similarity as function of the distance between the neurons, either using the real position from the simulations (orange circles), or the estimated barycenter of the templates (blue circles). E, Histogram of the cosine similarity distribution from one of the simulated recordings. F, Cross-correlograms and auto-correlograms for three sample spike trains. G, Average auto-correlograms of all units (red line, gray area represents the SD). H, Average cross-correlogram over all pairs of neurons (red line, gray area represents the SD around the mean). I, Sample traces from 10 channels of one synthetic recording.
- Figure 4.
Controlling spike trains correlations and firing rates. A, Average cross-correlograms between all pairs of distinct neurons firing as independent Poisson sources at 5 Hz (red curve, gray area represents the SD). B, Same as A, but for auto-correlograms. C, Raster plot showing the activity of the uncorrelated neurons firing at 5 Hz. D–E, Same as A–B, but for a rate of 15 Hz and 20% correlation. F, Raster plot showing the activity at 20% correlation and 15 Hz rate.
- Figure 5.
Spike sorting performance for different conditions. A, Average collision recall over the nine conditions shown in Figure 6 (3 firing rate levels and 3 correlation levels) as function of the lag between spikes, for pairs of cells with cosine similarity higher than 0.5. The shaded area shows the SD over the conditions. B, Similarly as A, the average collision recall as function of the cosine similarity between pairs of cells. C, Mean relative error between the ground-truth cross-correlograms and the estimated ones, for all sorters, averaged over all pairs with a similarity higher than 0.5.
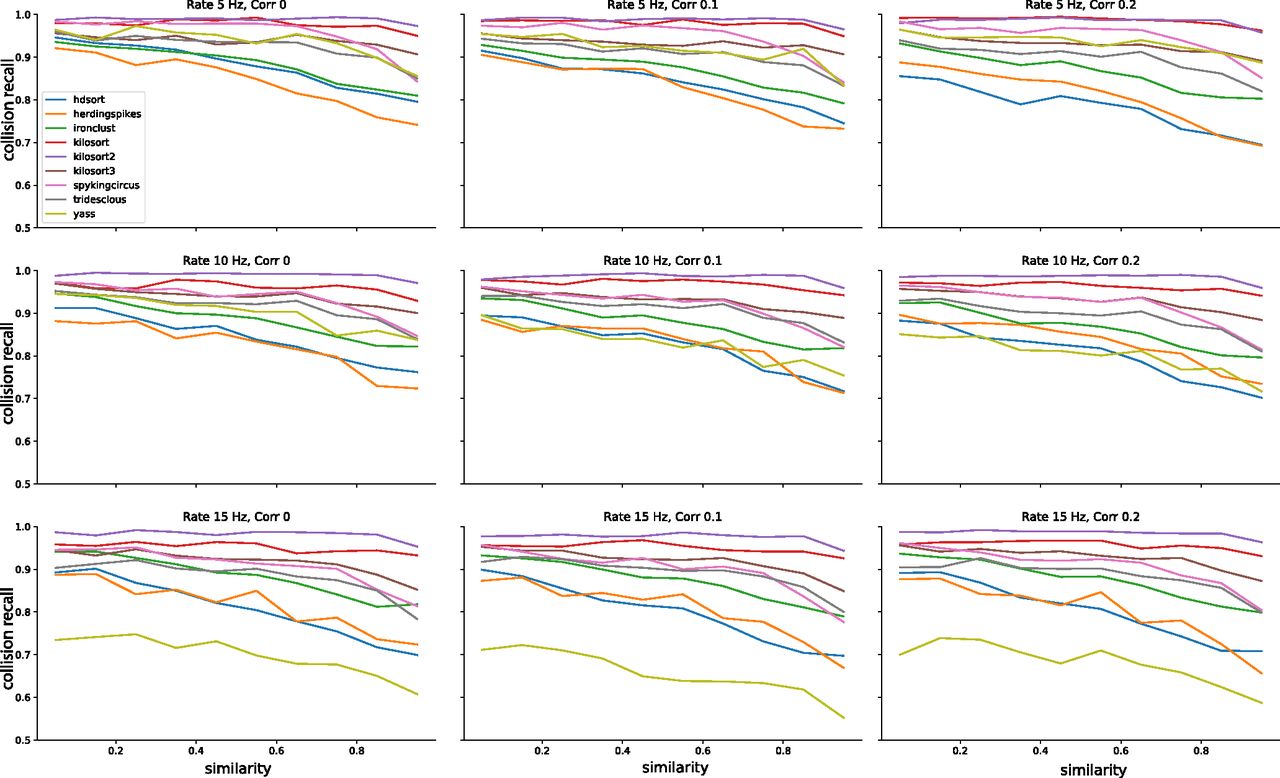
- Figure 7.
Average performances of the spike sorters as function of the template similarity. Each panel shows the average collision recall over all lags in [–2, 2] ms for a different condition, in terms of firing rate and correlation levels.


In this issue


