

Article Figures & Data
Figures
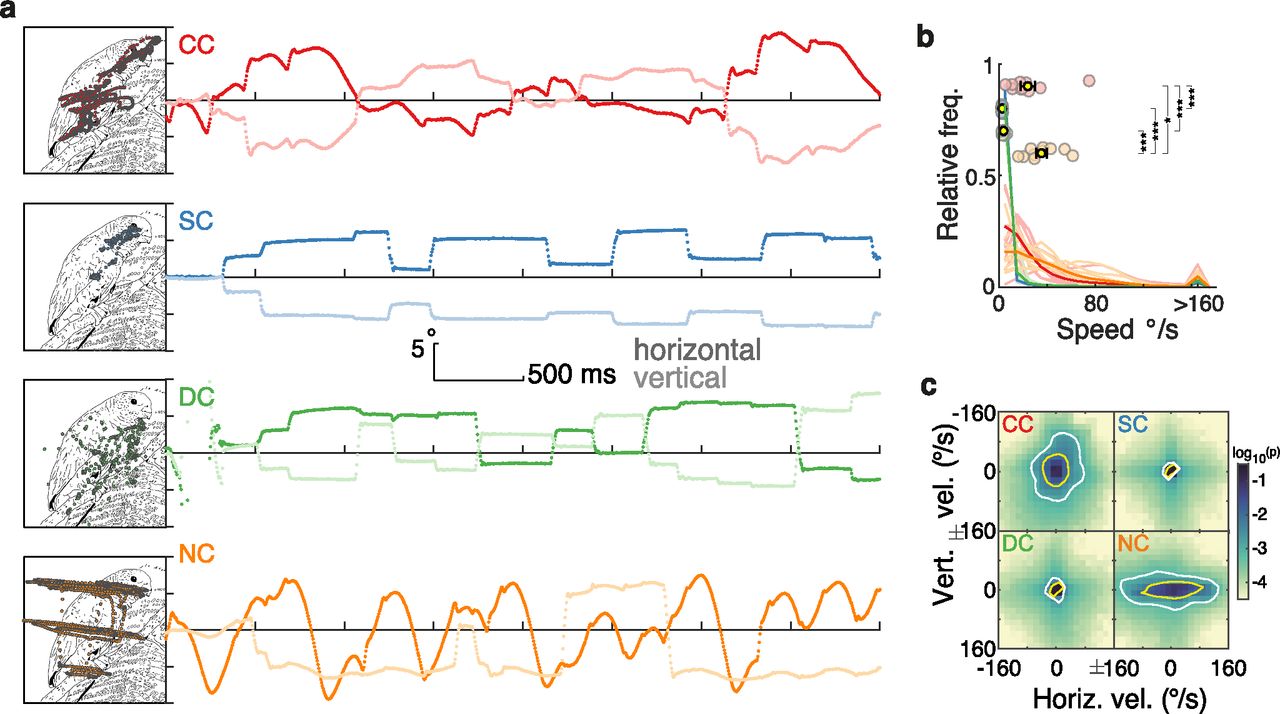
- Figure 1.
Eye movement kinematics during the visual exploration of an example image. a, Examples of eye movement recordings of one participant from each group. Images were explored for 4 s. The left panels depict the gaze traces overlaid on a line-drawing sketch of the original photographic grayscale image; note that participants watched the original grayscale images. The right panels show eye movement traces as they progress over time and space along the horizontal (dark lines) and vertical (light lines) dimension. Extended Data Figures 1-1 and 1-2 show two other examples of eye movement recordings. b, Distribution of the magnitude of instantaneous gaze velocity. Light lines indicate each participant’s distribution, and dark lines each group’s average distribution. Colored circles display each participant’s median value, and the yellow dots and error bars display the group’s mean and SEM (Extended Data Fig. 1-3, statistics). c, Distribution of instantaneous gaze velocity (bin size, 16°/s; densities were individually generated for each participant and then averaged across the participants of each group). The color scale indicates the probability of a given gaze velocity in log10 scale. Yellow and white contours indicate areas that span ∼75% and 90% of the distribution. In all figures, significant contrasts among groups are indicated as follows: *p < 0.01, **p < 0.001, ***p < 0.0001, respectively.
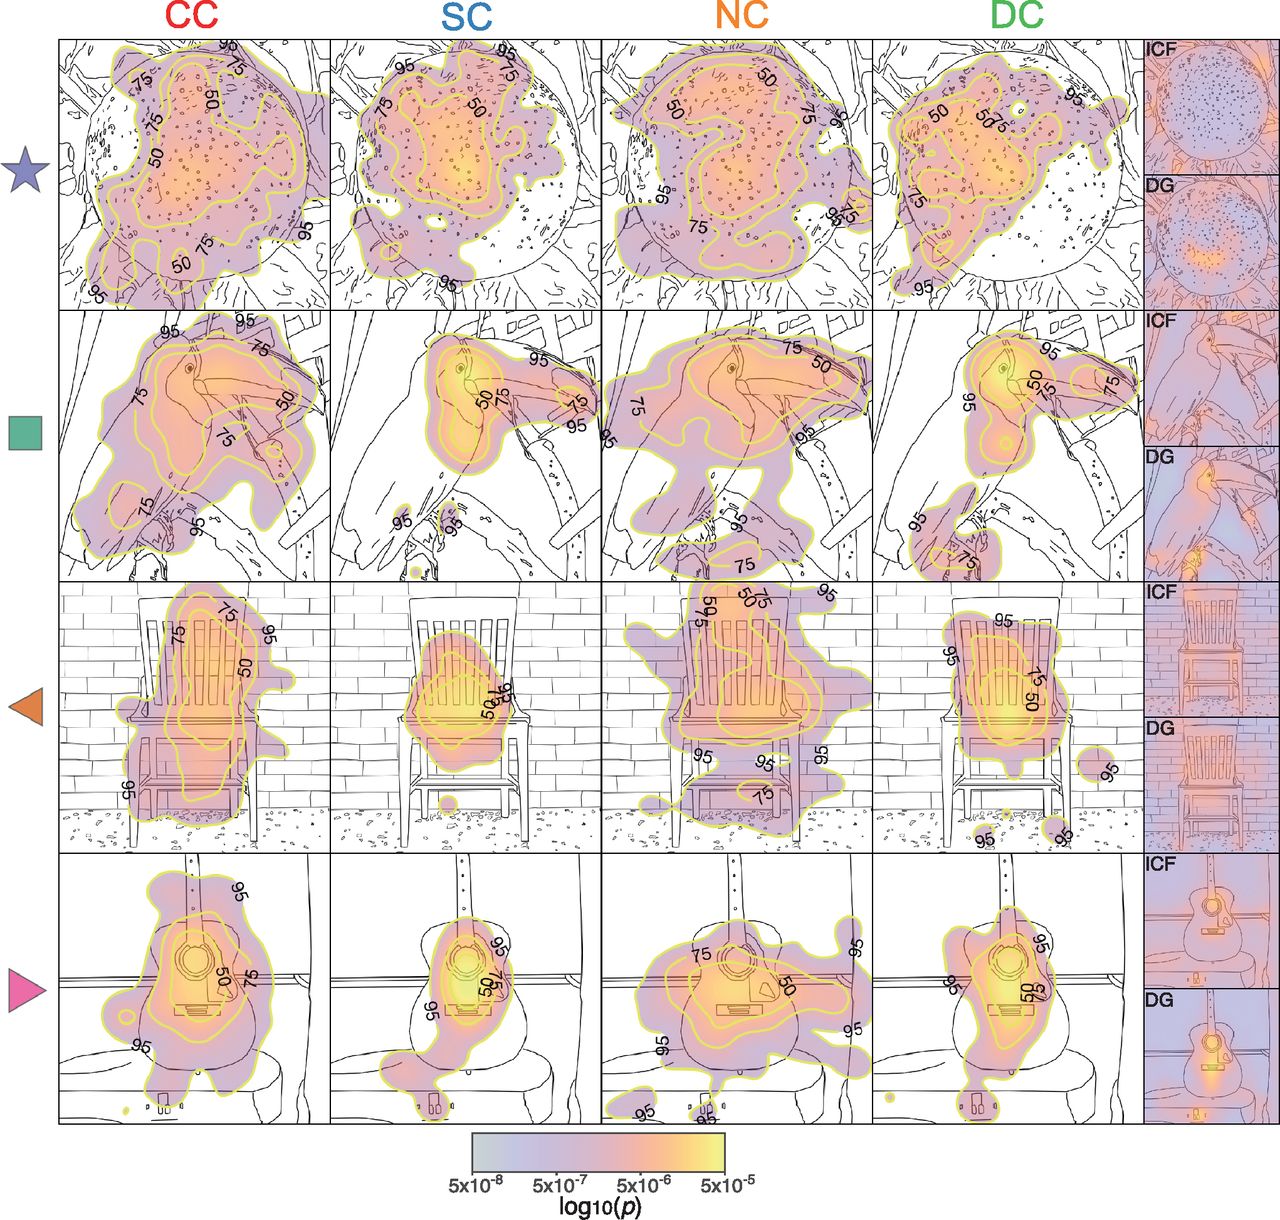
- Figure 2.
Examples of visual exploration by group. The subpanels show, for different images and the four groups of participants (Fig. 1, description), the spatial distributions of the probabilities to gaze different locations (pooled across participants and smoothed with a 2D Gaussian unit kernel), superimposed over line-drawing sketches of the original images. Warmer colors indicate a higher probability to gaze a location. Yellow contours indicate areas that span the top 50%, 75%, and 95% of the spatial distribution. As this distribution is constructed from all gaze eye-tracking samples (each occurring every 2 ms), these maps are equivalent to the spatial distributions of dwell time. The mean of entropy and AUC values for each of the four images are indicated by the corresponding symbol (star, square, and left and right pointing triangles) in Figure 3, b and f. The last column shows the DG-II and ICF predictor maps for each image. Extended Data Figure 2-1 shows the grand average of the spatial distributions of the probability to gaze a certain location across all images separately for each of the four groups. In addition, the corresponding grand average DG-II and ICF predictor maps are displayed.
- Figure 3.
Spatial spread and predictability of visual exploration patterns. a, Mean gaze entropy for each group (yellow dot with error bars, indicating the SEM) as well as for individual participants (colored dots; Extended Data Fig. 3-1, statistics). b, CC participants gaze entropy per image compared with the gaze entropy values of the other three control groups. Colored continuous lines indicate a linear regression line for entropy values of the CC group (x-axis) and each one of the three control groups (SC, blue; DC, green; NC, orange). The top left inset depicts the corresponding Pearson’s correlation values (in a red scale, top right corner) and the corresponding p-values (in green, lower left corner). Asterisks indicate significant correlations after controlling for multiple comparisons (α = 0.05/6). c, AUC values of the SC predictor map per participant and group. Dark-colored dots indicate AUC values for individual participants as derived by the predictor maps of the SC group to classify gaze and nongazed location. Light-colored circles from the corresponding AUC values for the control analysis in which image correspondence was shuffled. Bottom, Colored stars indicate that actual and control analysis values significantly differed. The control analysis values were not different from 0.5 (chance level). Extended Data Figure 3-2 shows statistics, and Extended Data Figure 3-3 shows the relationship between AUC values and different CC participants’ characteristics. d, AUC values of the SC predictor map across time. Curves show, for each group, AUC values calculated from consecutive 500 ms data partitions (Extended Data Fig. 3-4, statistics). e, AUC values of the SC predictor map as a function of instantaneous gaze velocity. SC predictor maps were used to calculate gaze in CC individuals separately for 10 quantiles of instantaneous gaze velocity (Extended Data Fig. 3-5, statistics). Extended Data Figure 3-6 shows the relationship between gaze velocity during fixations (SC and DC groups) and CC and NC participants’ first and second instantaneous gaze velocity quantiles. f, Correlations of entropy and AUC values across all images for the CC group. Different object categories are color coded. Extended Data Figure 3-7 shows the same correlation for SC, NC, and DC groups.
- Figure 4.
Degree of explained visual exploration behavior for low-level and high-level visual information and context. a, AUC values resulting from the low-level ICF predictor maps (Extended Data Fig. 4-1, statistics). b, AUC values resulting from the high-level DG-II predictor maps (Extended Data Fig. 4-2, statistics). c, Ratio between ICF and DG-II AUC values (Extended Data Fig. 4-3, statistics). Extended Data Figures 4-4, 4-5, and 4-6 show AUC values of the ICF and DG-II predictor map across time and the corresponding statistics. Extended Data Figure 4-7 shows the ratio between ICG and DG-II AUC values obtained from low-pass-filtered versions of the images and the AUC values obtained from the nonfiltered images (Extended Data Figs. 4-8, 4-9, statistics).
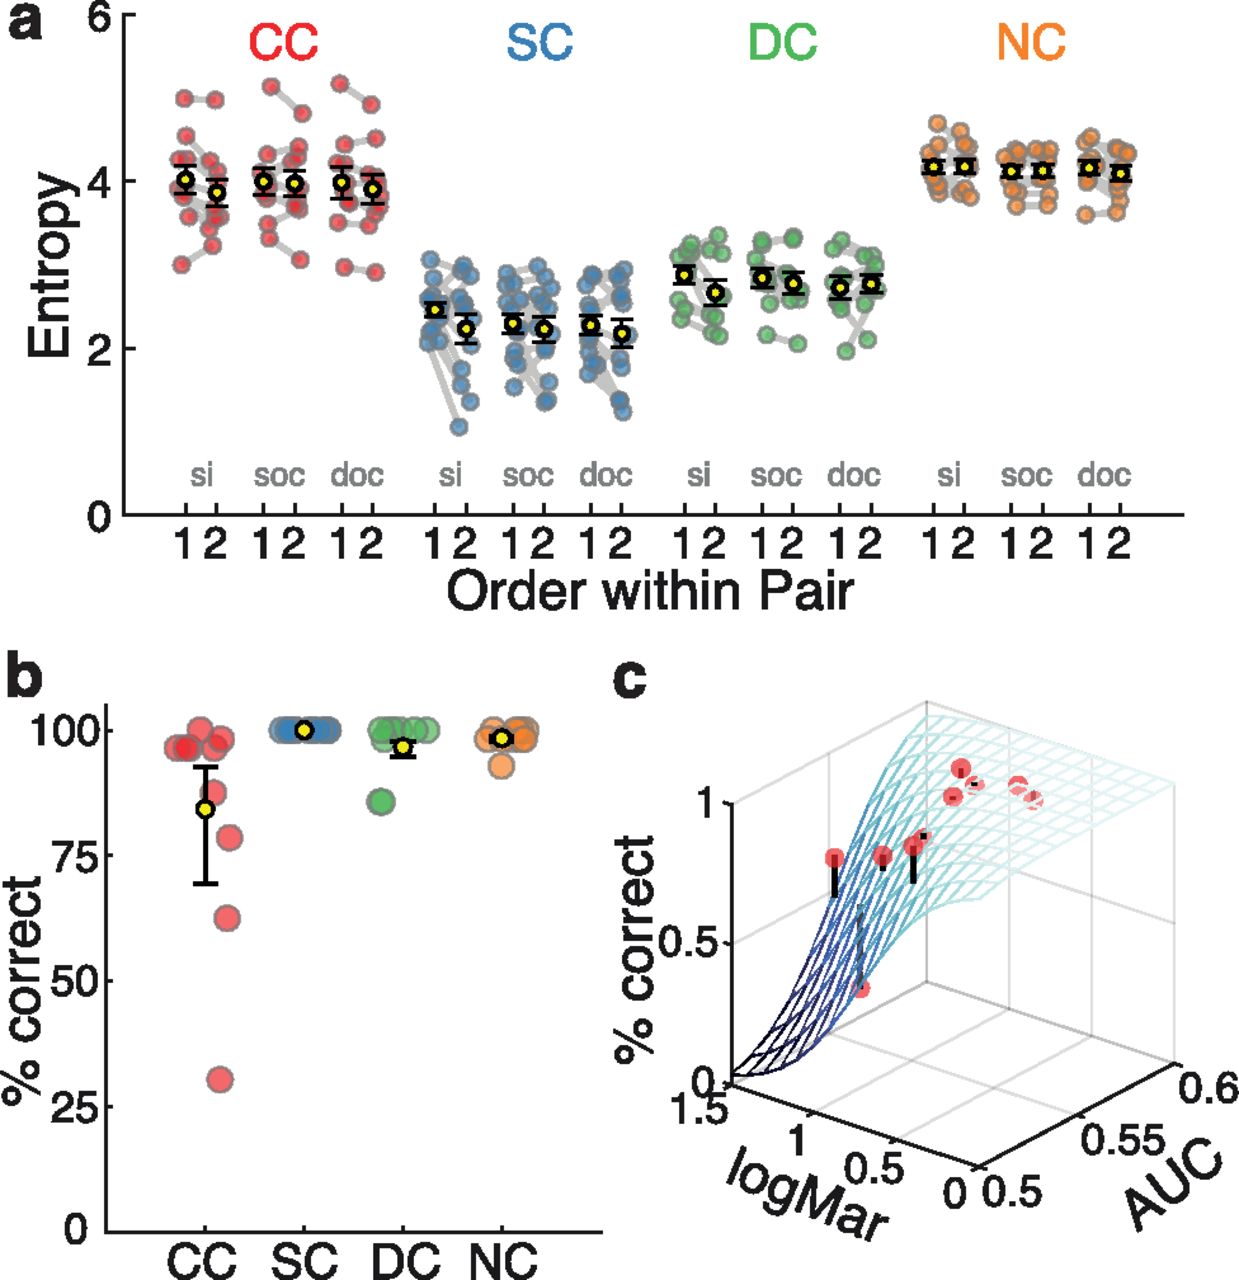
- Figure 5
Effect of stimulus repetition and object recognition performance. a, Gaze entropy for the first versus the second presentation of the same image (si), different images from the same object category (soc), and different images from different object categories (doc; Extended Data Fig. 5-1, 5-2, 5-3, statistics. b, Percentage of correct images recognized for in each group (mean group performance in black with error bars indicating the SEM; Extended Data Fig. 5-4, statistics). c, Recognition performance, visual acuity (logMar) and AUC values (obtained using SC predictor maps) for each CC individual. The blue shade mesh depicts the generalized logistic fit. Black lines starting at the red dots indicate the discrepancy between actual performance of a CC participant and model predictions (Extended Data Fig. 5-5, statistics). Extended Data Figures 5-6 and 5-7 show the relationship between performance and age at testing.


Tables
Age at
testing (years)Age at surgery
(months)Cataract type
at surgeryPresurgical visual
acuity (best eye)Most recent visual
acuity (CC/DC: postsurgical;
best eye)Cataract
family
historyDecimal logMAR CC group (N = 10) CC-1 16.9 4 Dense FFL+ 0.33 0.47 No CC-2 13.5 83 Absorbed CF 3 m 0.15 0.79 No CC-3 31.7 168 Absorbed Unknown 0.1 1 Yes CC-4 42.9 264 Absorbed 0.06 (decimal) 0.16 0.79 Yes CC-5 16.1 186 Absorbed 0.03 (decimal) 0.08 1.1 No CC-6 12.3 138 Dense CF CF 0.03 1.4 Yes CC-7 21.7 213 Dense CF 0.5 m 0.12 0.9 Yes CC-8 10.7 17 Dense PL at 0.5 m 0.25 0.6 No CC-9 23.5 3 Dense FFL– 0.25 0.6 No CC-10 17.2 34 Dense FFL+ 0.16 0.79 No Summary M: 20.7
R: 10–42M: 111 (9.2 years)
R: 4–264GM: 0.14
R: 0.03–0.3M: 0.86
R: 0.47–1.4DC group (N = 9) DC-1 24.4 31 Not dense FFL+ 0.5 0.3 No DC-2 13.8 89 Dense CF 1 m 0.66 0.17 Unknown DC-3 16.2 130 Not dense 0.4 0.8 0.09 No DC-4 13.2 71 Dense FFL+ 0.46 0.33 Unknown DC-5 17.3 91 Not dense 0.16 0.8 0.09 Unknown DC-6 11.5 91 Not dense 0.25 0.8 0.09 Unknown DC-7 18.8 208 Not dense 0.2 0.7 0.13 No DC-8 11.6 54 Dense CF 1 m 1 0 Unknown DC-9 13.5 30 Dense FFL+ 0.66 0.17 Unknown Summary M:15.6
R:11–24M: 88.3 (7.4 years)
R: 30–2084 dense GM: 0.7
R: 0.46 – 1M: 0.16
R: 0 – 0.33NC group (N = 10) Summary M: 15
R: 8–37GM: 0.45
R: 0.25–0.8M: 0.35
R: 0.1–0.6SC group (N = 13) Summary M: 23.7
R: 11–401 (all) 0 (all) PL, Perception light; CF, counting finger (equivalence with logMAR acuity has been reported to be 1.7–2.0 at 30 cm; Schulze-Bonsel et al., 2006); CF CF, counting finger close to face; FFL, fixate and follows light; M, mean; GM, geometric mean; R, range.
Movies
- Movie 1.
Examples of visual exploration patterns. Each subpanel shows the exploration of one participant for the complete period of image presentation. Each red dot represents one eye-tracking gaze sample (downsampled from 500 to 125 Hz for better visualization) overlaid on a line-drawing sketch of the original photographic grayscale image; note that participants watched the original grayscale images.
- Movie 2.
Examples of visual exploration patterns. Same as in Movie 1.
Table 1-1
The relationship between visual acuity and age of surgery (CC and DC groups) and age of testing (all groups). Download Table 1-1, EPS file.
Figure 1-1
Examples of eye movement recordings of one participant from each of the four groups. Download Figure 1-1, EPS file.
Figure 1-2
Examples of eye movement recordings of one participant from each of the four groups. Download Figure 1-2, EPS file.
Figure 1-3
Instantaneous gaze velocity statistical result. Download Figure 1-3, DOCX file.
Figure 2-1
Exploratory and feature bias. a, Grand average, across all image and participants (per group), of the spatial distributions of the probability to gaze. b, Grand average, across all images, of DG-II and ICF predictor maps. Download Figure 2-1, EPS file.
Figure 3-1
Entropy statistical result. Download Figure 3-1, DOCX file.
Figure 3-2
AUC (SC predictor map) statistical result. Download Figure 3-2, DOCX file.
Figure 3-3
a–d, Relationship between SC predictor map AUC values in CC individuals and logMAR visual acuity (a), age at testing (b), age at surgery (c), and time from surgery (d). Download Figure 3-3, EPS file.
Figure 3-4
AUC (SC predictor) per time interval statistical result. Download Figure 3-4, DOCX file.
Figure 3-5
AUC (SC predictor) per velocity quantile statistical result. Download Figure 3-5, DOCX file.
Figure 3-6
Fixational gaze velocity SC and DC groups and first and second quantiles of gaze velocity in the CC and NC groups. Top, The grand average distribution, for the SC and DC groups, of the magnitude of instantaneous gaze velocity for samples corresponding to fixations. Bottom, Gaze instantaneous velocity first and second decile values for each CC and NC participant. Download Figure 3-6, EPS file.
Figure 3-7
Correlation across images between entropy values and AUC values. a–c, SC (a), NC (b), and DC groups (c). Download Figure 3-7, EPS file.
Figure 4-1
AUC (ICF predictor map) statistical result. Download Figure 4-1, DOCX file.
Figure 4-2
AUC (DG-II predictor map) statistical result. Download Figure 4-2, DOCX file.
Figure 4-3
ICF/DG-II AUC ratio statistical result. Download Figure 4-3, DOCX file.
Figure 4-4
AUC values across time. Curves show, for each group, AUC values calculated from consecutive 500 ms data partitions. a, ICF predictor. b, DG-II predictor. Extended Data Figures 4-5 and 4-6 show statistics. Download Figure 4-4, EPS file.
Figure 4-5
AUC (ICF predictor) per time interval statistical result. Download Figure 4-5, DOCX file.
Figure 4-6
AUC (DG-II predictor) per time interval statistical result. Download Figure 4-6, DOCX file.
Figure 4-7
a, b, Ratio between AUC values for saliency predictor map obtained from low-pass-filtered versions of the images and the AUC values obtained from the nonfiltered images, for the ICF (a) and DG-II (b) predictor maps. ICF and DG-II saliency models were run with low-pass-filtered versions of the images using 0.5, 1, and 2 visual degrees spatial frequency cutoff. Group differences were evaluated separately per predictor map and filtered version with robust linear model contrasts. The ratio between ICF predictor map AUC values from images filtered at 0.5° and nonfiltered images was higher in the CC group compared with the SC group (t(38) = –2.82, p = 0.007; Extended Data Fig. 4-8, statistics) and the DC group (t(38) = –3.51, p = 0.001), but was not significantly different from the NC group (t(38) = –1.06, p = 0.29). No difference between groups was found for the 1° ratio or 2° ratio AUC. The ratio between DG-II predictor map AUC values from images filtered at 0.5° and nonfiltered images was higher in the CC and NC groups compared with the SC and DC group (all four contrast, p < 0.007; Extended Data Fig. 4-9), but was not different in the comparison between CC and NC (p = 0.79). The ratio between AUC values from images filtered at 1° and nonfiltered images was higher in the CC group compared with the DC group (p = 0.005). No other group contrast was significant. No group difference was found for the DG-II 2°. In summary, compared with SC and DC participants, for CC and NC participants gazed and nongazed locations were to a larger degree predicted by the low spatial spectral content of the images. Download Figure 4-7, EPS file.
Figure 4-8
AUC (ICF predictor map low-pass filtered, 0.5) statistical result. Download Figure 4-8, DOCX file.
Figure 4-9
AUC (DG-II predictor map low pass 0.5 filtered, 0.5) statistical result. Download Figure 4-9, DOCX file.
Figure 5-1
Entropy values for the first versus second image of a pair of identical images statistical result. Download Figure 5-1, DOCX file.
Figure 5-2
Entropy values for the first versus second image of a pair of images from same category statistical result. Download Figure 5-2, DOCX file.
Figure 5-3
Entropy values for the first versus second image of a pair of images from different category statistical result. Download Figure 5-3, DOCX file.
Figure 5-4
Performance for each group statistical result. Download Figure 5-4, DOCX file.
Figure 5-5
CC participants’ performance statistical result. Download Figure 5-5, DOCX file.
Figure 5-6
Performance versus age at testing. Age at testing was not correlated with performance across all participants (r = 0.06, p = 0.69) or when tested only for the CC group (r = 0.1, p = 0.78). For CC participants, a logistic regression model analysis showed no association between object recognition performance and age at testing (p = 0.17; Extended Data Fig. 5-7). Download Figure 5-6, EPS file.
Figure 5-7
CC participants’ performance and age statistical result. Download Figure 5-7, DOCX file.
In this issue


